There are a lot of assumptions that must be met before a regression or correlation can be thought to have any meaning.
For linear regressions and correlations it would be nice, at least, to think we are talking about linear data: but I do not think that is always the case.
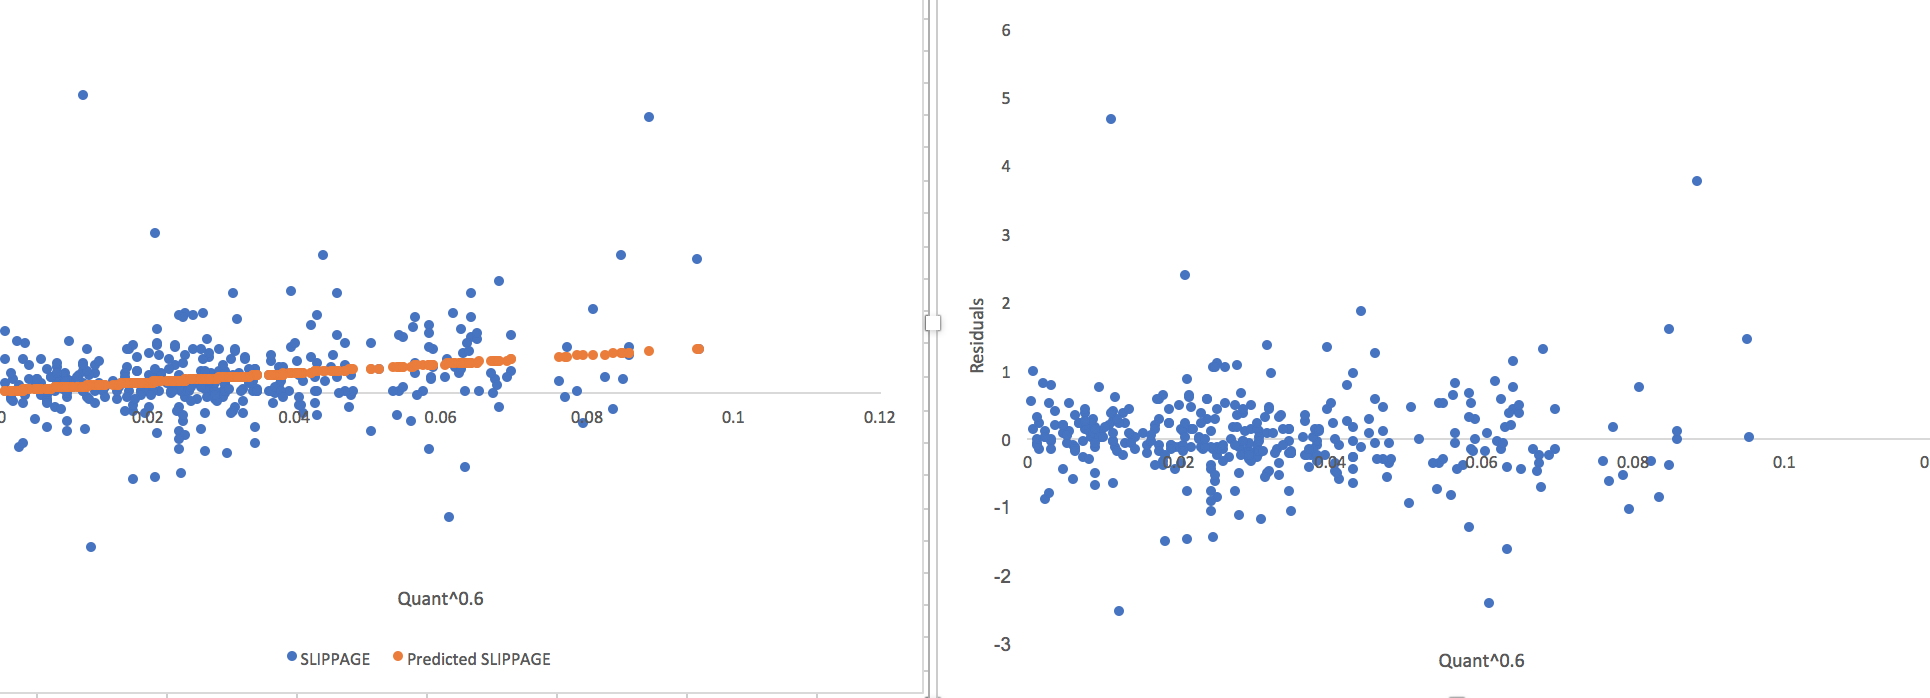
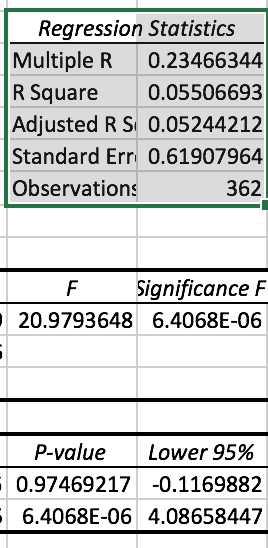
That the residuals have a normal distribution can be important and that the variances are constant is always important for regressions. Fortunately one can often see whether these assumptions are violated in a scatterplot too—along with the assumption of linearity.
It would be nice to see scatterplots for this type of data. Then people could decide whether it is worth their time to read the rest of the post. And people who might want to add their own post to the thread could have a handle on of the validity of data before they make any comments.
Thank you in advance for adding scatterplots to any posts with linear regressions or correlations—when possible.
For those who do not wish to share the information about their ports or sims that an Excel linear regression reveals then a graph of the residuals would be just as good. Maybe better.
In the end, people can post whatever the want but, personally, I won’t be reading many posts about regressions and correlations without a scatterplot. Those with a lot of free time who cannot find something productive to do may wish to continue reading. And this can be fun or interesting: when it has any meaning at all.
I think linear regressions have a lot of assumptions (and therefore a lot of problems). In truth those assumptions are almost never met. One can argue forever about what you may be able to get away with. But with a scatterplot you can make your own personal judgement and not have to seem contrary by asking the original poster, in the thread, about the validity of his or her data.
I have enough concerns with regressions that at the moment I don’t use them for much more than slippage—which, at least, is not a time series and has some independence from day to day. And you have to do something: ANOVA, buckets or something if you are looking at (Q/V). Even there I am paying close attention to the residuals for my own data. And I will throw the data away (or use a different statistical method) if it is not linear, or the variances are not constant or………
Again, thank you in advance.
-Jim