Thank you all for the suggestions and feedback.
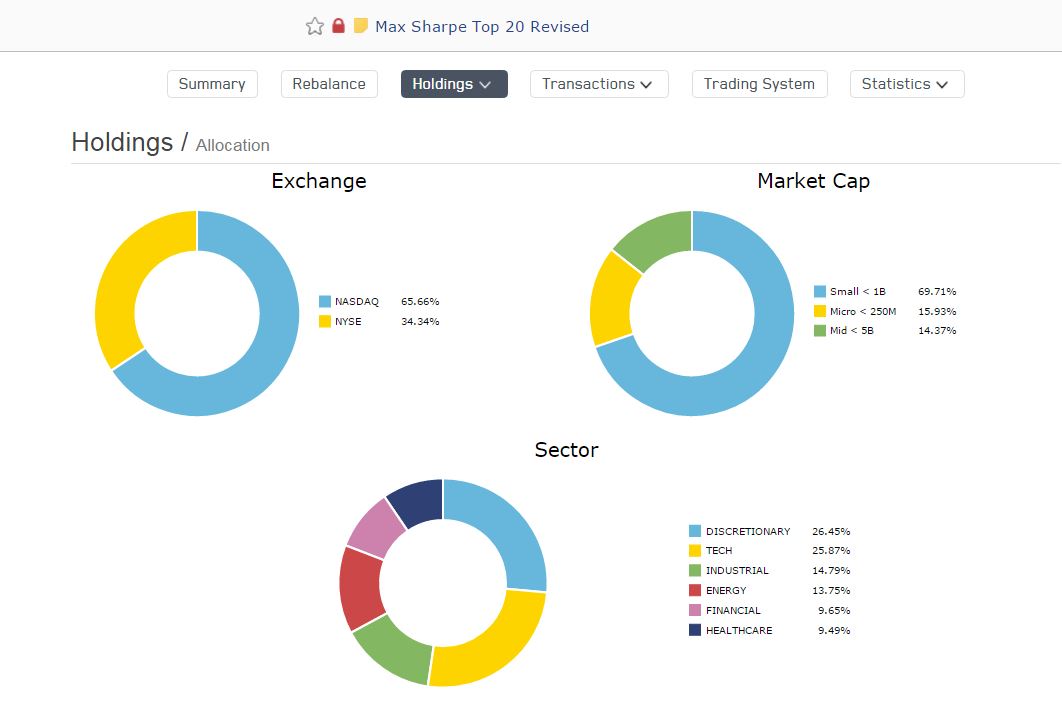
I am thinking of asset diversification without loosing good performance.
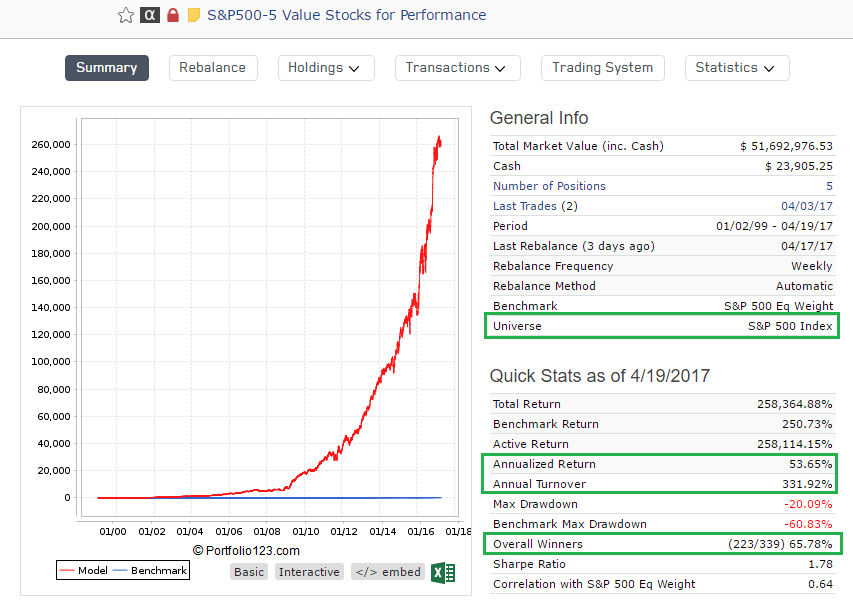
5 value stocks in sp500.
5 growth and value stocks in midcap
7 value and momentum stocks in small cap.
Xlu/xlp, Tlt and Gld.
It make it 20 stocks in the list. And manageable for small account on a weekly basis.
Will take advantages of all the caps and relatively good correlation to reduce the draw down without compromising much performance.
I believe,
All strategies will work sometimes,
i.e.,
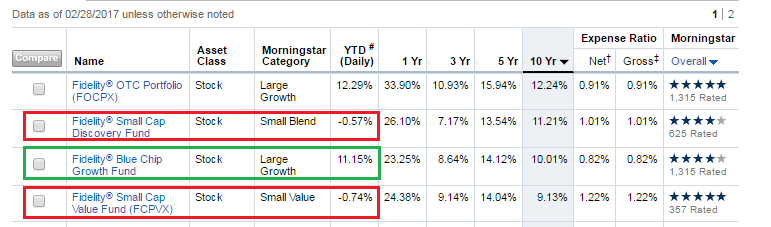
Fidelity small cap recovery fund returns 20% last year
Fidelity blue chip growth was flat last year.
This year last 3 months
Fidelity small cap discovery is flat
Fidelity Blue chip Growth returns 10%.
by combining strategies will work most of the time. So more potential for growth rather than stuck with 1 idea with 20 stocks.
==========================================================
Fidelity fund performance results are attached.
Believe, my ideas are no better than Fidelity research firm idea in long term.
the money moving between strategy in stocks most of the time and
some time out of stock to bond and gold like recession times and
short term pull back few times a year.
Anyone disagree on this ?
Your 10 stock models looks good. But if your best 5 stocks are contributing at this level you should ask if those additional 5 stocks are contributing much to your 10 stock model.
Diversifications is a very good thing. But it is easy to get so caught-up in the idea that you end up adding stocks to a port that, in reality, are contributing very little. I have, in fact, added stocks in the past that have basically done nothing except add risk. For me personally it would have been much better to keep some money in cash and do the 5 stock model.
If the "marginal returns’ of those added stocks is low—move to another port (or even an ETF) with some of your money and use the 5 stock model. Or just keep some money in cash or buy bonds.
I have not done the math on your models but I have to wonder. If 5 stocks are contributing 50% then if a ten stock model returns 30% those 5 lower ranked stocks are not doing much better than the bench—somewhere around 10%. I have seen several different models in your posts and I cannot remember all off their returns but you might consider calculating that number for your specific ports.
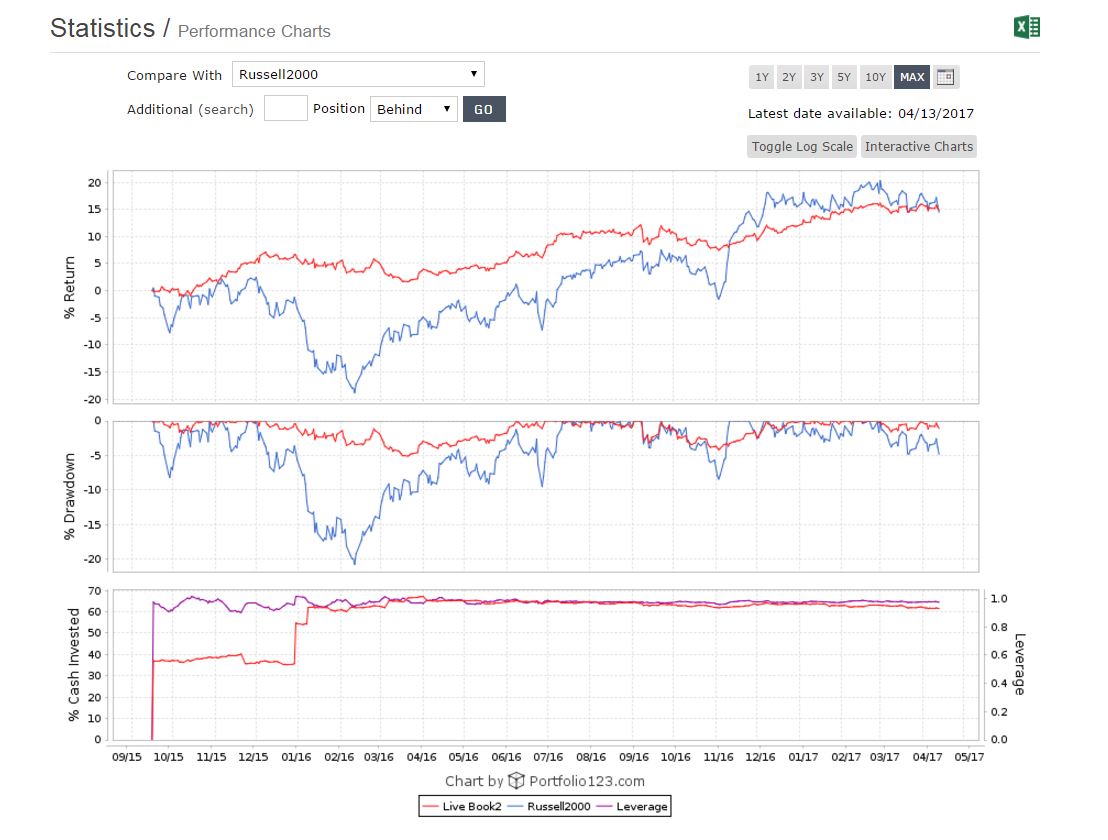
The 10 stocks model return 39.5%,
And 20 stocks model returns 28%.
All these 3 model don’t have any return for last 3 months as Fidelity smallcap value fund’s performance.
that make thinking of concentrated model with different themes.
Possibly designing a growth model to compliment this value model.
It may take time; but it is possible. as we have Willion O’ Neil CANSLIM and Fidelity Blue Chip Growth models to validate the growth concepts if I come-up with one.
In regards to diversification - your turnover is 300%. That is some diversification right there! In other words - diversification can come from rapidly churning a set of small stocks quite rapidly. Holding onto 30 stocks for 1 year vs turning over a portfolio with 5 stocks 6 times a year - both of those provide diversification in a different way. Of course there’s still the issue of transaction costs and tax concerns (the latter is not a concern for tax-deferred accounts, obviously - ie 401k/IRA).
So I wouldn’t get too concerned about this particular port not being diversified enough. Ultimately what matters is the reasoning behind the factors and rules you’ve picked, and then the performance. In this case, I can see the latter part (performance), and I have to say: Nice work!
Concentration requires good edge (which is imposible to have using only P123 without further deep investigation / insider info).
If you don’t have it like the most people then diversify.
Read this stuff: Kelly Criterion (Concentration) vs Modern Portfolio Theory (Mean-Variance Optimization and diversification).
The good example of Kelly concentration advance is significant outperformance of top quartile of private equity firms vs top hedge funds in the long run. Or check Buffet which is canonic full Kelly follower.
The edge is extremly hard to get in the efficient markets like the stock market in comprasion to a private transaction universe.
The only chance we have here (in absence of other info) is undecovered small cap equity (the most models as you see biasied towards it).
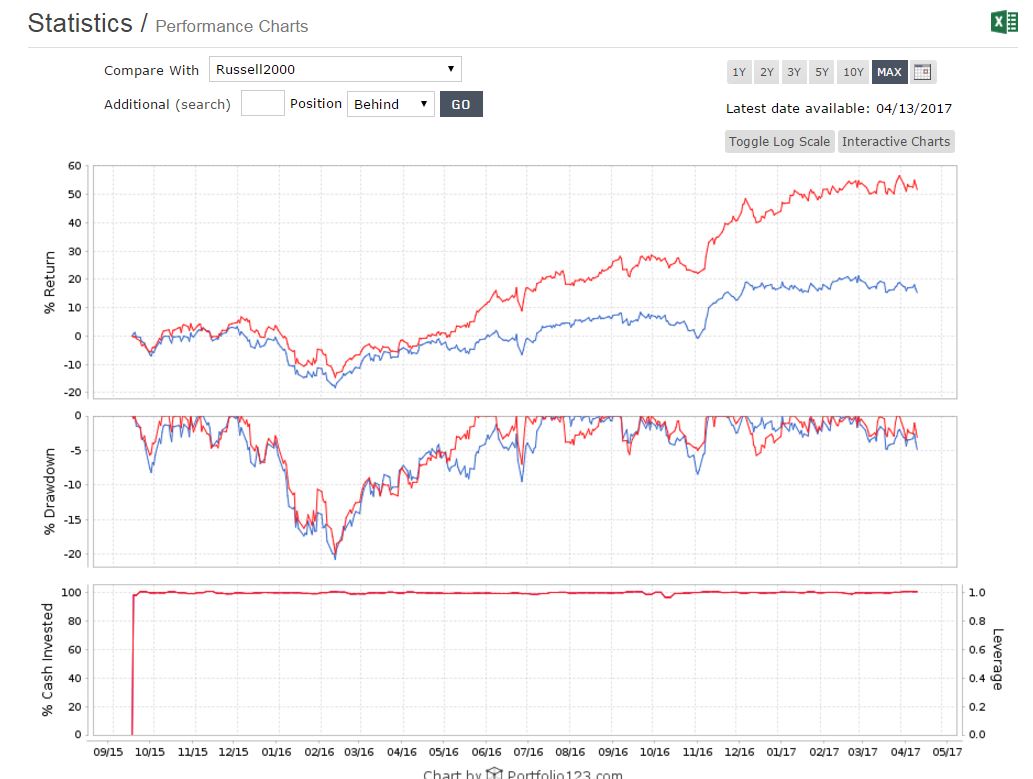
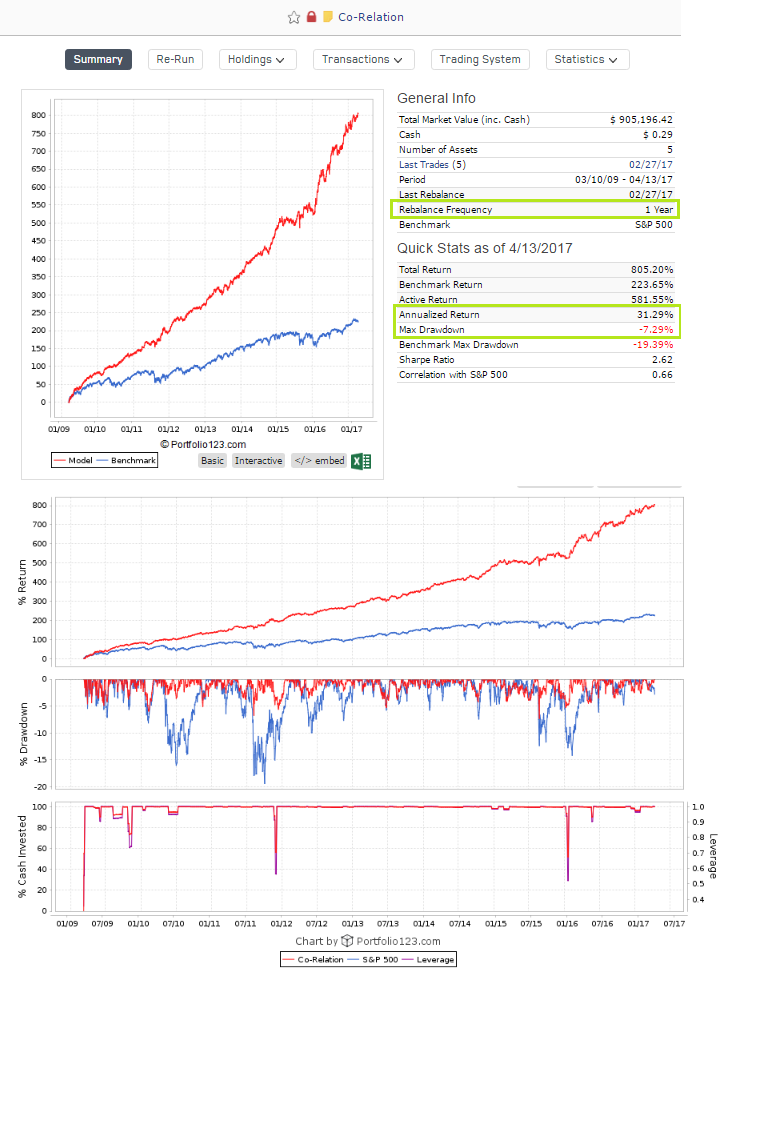
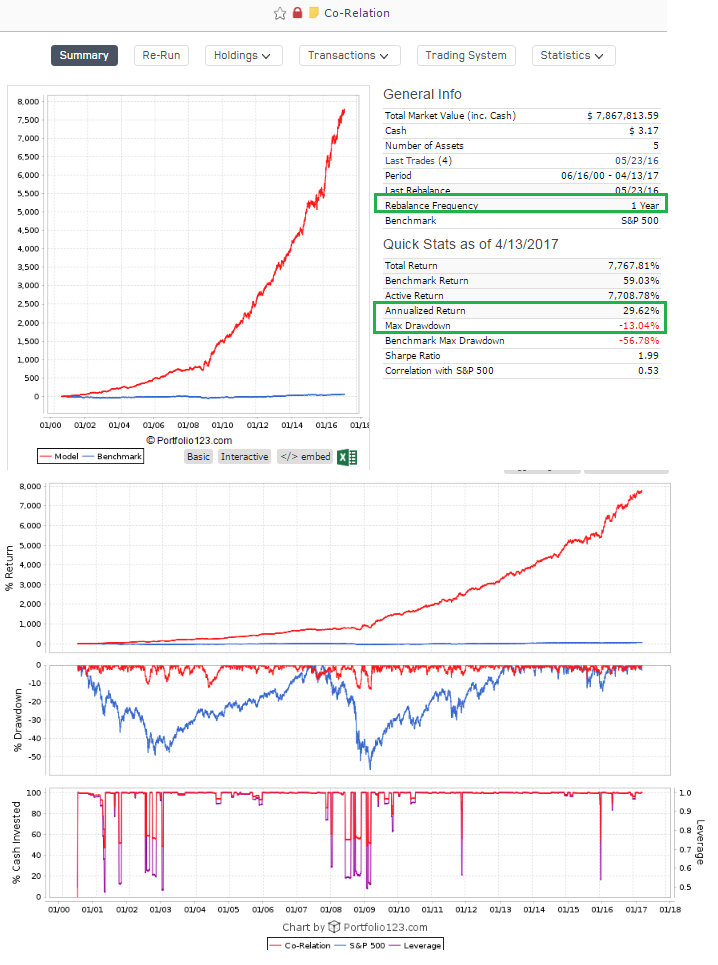
As you can see my concentrated long only even without any hedge (TLT is good on it) 20 stocks system (biased toward small cap) significantly outperformed (in terms of out of sample sortino) diversified book of about 300 positions including ETFs and shorts. So conclusion is to know what to do and concentrate on it
Kumme, Your Modell is fine. 3 months sideline is something that happens to every model.
You need to work on the psychological side of your trading.
Really it does not matter if you do 20 or 50 percent a year, we need to be more disciplined
Not smarter then others. I TRADE a 100 Stock micro cap port and I really do not care anymore if there is something better out there
Yes liquidity is low
Yes I have to work with Gtc limit orders
Yes micro caps are hated
Yes 100 Stocks are much
Yes the market seems expensive and the world is soon over like the bears say
Yes momentum is well known
Yes value is well known
Yes the size effect is well known
Yes going with earnings estimates as a market timer is well known
Yes my port is dead boring since it swings rarely more then a percent a day
But the difference if all that given is: at the end Of the day it’s 90 percent discipline
If you are going to be dead rich or not depends on your leather a… and not your brilliant mind
That drags you into a very hack (behavior that produces the anomalies like value, sie effect not to be disciplined you need to find a system that
That others will exploite.
Our mind drags us into complicated stuff, it can not work what is simple, that is a
Nasty trap!
And if you Want to be disciplined you need to find something that you feel good about.
Ilove my system because I have researched its hacks for 17 years, and I lovethe low
Trading frequency, I love that it has relative low drawdowns, and that I need no stop losses.
I love that it uses very high diversification.
You need to ask yourself when do you feel better, if you have two good variations of a System.
And then you have to life with the disadvantages, because maybe that is exactly the reason why
They work. Small caps are for example extreme hard to own.
I actually have stopped talking to people about the size effect.
Sorry to get off topic here, but You have to be fine with not having the perfect system
Everybody who is doing more then 20 percent a year on average has hit the jackpot
And should average into it and be rich in 10-15 years
The following formula based on Kelly can be applied for a number of holdings calculation in each system:
Position size = portfolio size x maximum tolerable drawdown x (win rate - loose rate /(average gain/average loss)).
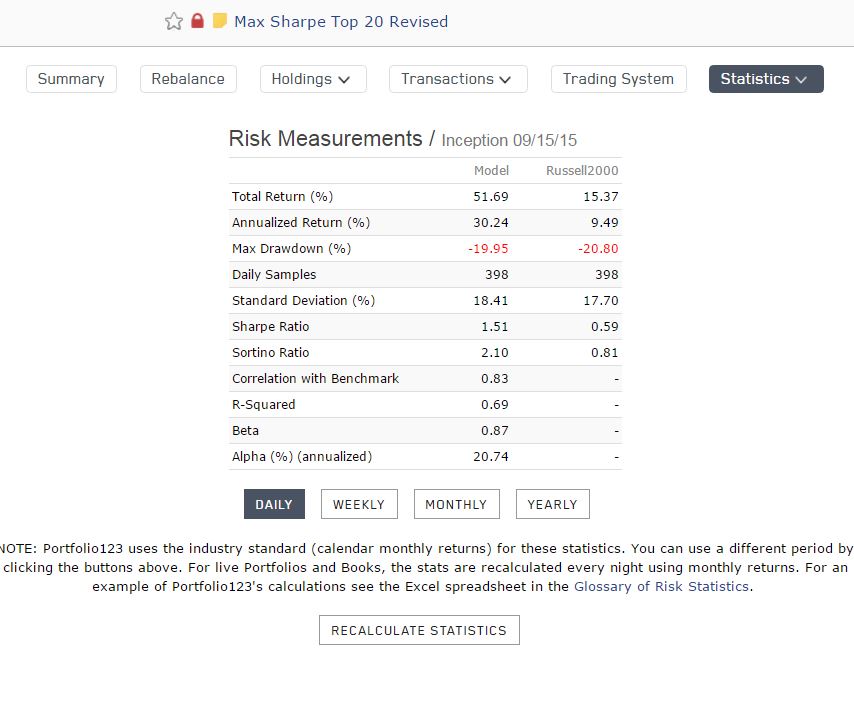
For example, for my max sharpe 20 stocks port system, if allowable drawdown is 20%, win rate 58%, loose rate 42%, average win 13%, average loss 9%. Then optimal holding size (to maximize wealth in the long run, geometric return in other words) is 20%*(58% - 42%/(13/9)) = 5.78% which is equal to 17 stocks in the portfolio.
I assume the calculations are correct. Be aware that this assumes that the stocks are not correlated to each other. I think 17 stocks would have a larger drawdown in 2008 when everything became correlated.
And the rest of the money should be in something that is not correlated—like cash—and not in another stock port if you are concerned about drawdown.
But “path” makes no difference with geometric returns: this is just the commutative property of multiplication. You can put the returns in any order and your final total is the same. So if you know ahead of time (you can’t) that your port is good and you have a long holding period then drawdown would be of no concern. Again, this would be with a long holding period.
The other good news is that I do not think even a 5 stock model is beyond “Optimal Kelly” unless you use leverage. I do think that less than 5 stocks does not perform well because you are getting beyond “Optimal Kelly.” So it may be that I am off a stock or two in this calculation. That does not mean that you could stomach the drawdowns—“Optimal Kelly” or not.
Diversification is most important because you do not know for sure if your port is good going forward. And I would be cautious about calculations of future maximum drawdowns with this or the CAPM.
Edit for below: that is my point on drawdowns too. I hope anything I said was not taken as endorsement of using the Kelly formula for calculating drawdowns.
The Kelly Formula is utterly dangerous in my opinion. Ralph Vince calls his version “Optimal f”.
It assumes that you know the future drawdown of your holdings. But this is total fiction. No system can ever “guarantee” future drawdowns. Ralph Vince wrote about this. And if you follow the Geometric Mean (Optimal f) you will have high exposure AND the biggest drawdown at the same time.
Ralph Vince says in his book: “Optimal f will give the greatest geometric growth but also enough rope to hang yourself with”.
Well said.
Optimal f is great example on how to overcomplicate.
First make an assumtion that is wrong (e.g. EMH, Volatility = Risk, Risk Free Rate, normal distribution of stock returns, and all other bull…).
Then create an mathematical formula that covers up your wrong assumtion and let you feel better, because it tricks your mind that
you know what you can not know. Then puplish it and win a nobel price.
Then apply it and underperform the market or even create LTCM and get a bail out.
Or be a business punk and sain and keep it simple.
“Zip your Pocket Book if somebody talks you about Beta” and “We do need to be more disciplined not smarter then others” tells it all (Buffet).
Is a shame how a hole Science of Business and economics has been f… up by mathematicians and technocrats that do not have a glue about
business and the economy and it is a shame that modells get the modell price which assumtions are wrong.
I would take the stock system with the more stocks because of lower day to day vola of the port and it has more degrees of freedom…
if you Want to be disciplined you need to find something that you feel good about.
I love my system because I have researched its hacks for 17 years, and I love the low
Trading frequency, I love that it has relative low drawdowns, and that I need no stop losses.
I love that it uses very high diversification.
I love my system performance and turn over but not the draw down.
As i am in day job, i like less trading, less draw down and take less risks and would like to have reasonable performance.
When 5% and 10% draw down comes worst than the bench mark;
no matter what the more chances for questioning the system for it’s validity. and we will give-up the trading system and trading plan.
So, i come with a asset allocation plan. I will trade for few years this way to gain discipline.
Now, I feel good about, want to be disciplined and will follow my plan.
I want to grow the assets independently for 1 year, then re-balance to trim the excessive gain and buy more shares on loosing assets, it will naturally happens when allocate same size of last year using all the current assets balances.
This is the way big banks are operating, So, i just want to follow the proven method rather than weekly and monthly rebalancing of assets in a book which is more confusing for me.
Kelly formula is not used for drawdown calculation. Original formula is f = P(W) - P(L)/Odds. Special coefficient (named allowable drawdown) required exactly because of assumed zero correlation between events, which is not true in investing. N non-correlated bets reduce overall portfolio volatility by N^0.5. In practice without shorts using only long stocks, portfolio volatility can’t be lower than 1/3 of a separate stock volatility (even if separate stocks are low correlated to each other, they become much more correlated to the overall portfolio if it becomes bigger and bigger and overall volatility almost won’t change starting 15-25 stocks). Therefore Kelly original fraction should be reduced at least by 3 times.
Other way to think about allowable drawdown coefficient is an assumption that all bets may be losing (because of non-zero correlation) at the same time and you loose allowable drawdown portion of a portfolio.
Simulations show that full Kelly may lose 98% of the initial portfolio even after 700 bets (assuming you have 14% edge on each bet), half Kelly gives 50% drawdown. At the same time full Kelly maximum win is 480 times higher than original amount and mean value is 48 times higher. Full Kelly is still the optimal solution to maximize value in the long run.
Now the question is how to get this edge to play the game (if we don’t have it we should buy the market). For example, if we have a market timing model (whatever it is), that shows some correlation of its value to future market return, what is the probability of winning and what is the odds to put is in the formula.
The answer is a conditional probability. If we know nothing we have regular market return probability function (let’s say normal with M-mean and S-sigma or volatility). Since we have our timing model that show some correlation, we have some information and move our density function to the right and narrow it (mean is higher and volatility is lower). The market return was changed after we got our market timing model numbers because of conditional probability.
The question is how to calculate exact numbers? Let’s say my market timing model shows 0.5 correlation to 6m future S&P return. How did I improve my winning probability and odds in this case on average? I was asked about this question recently on a meeting with a potential investor. I have found the answer but not 100% sure about it yet. Maybe somebody knows for sure? The same approach can be applied to a ranking system, stocks selection process and allocation weights.
