if you Want to be disciplined you need to find something that you feel good about.
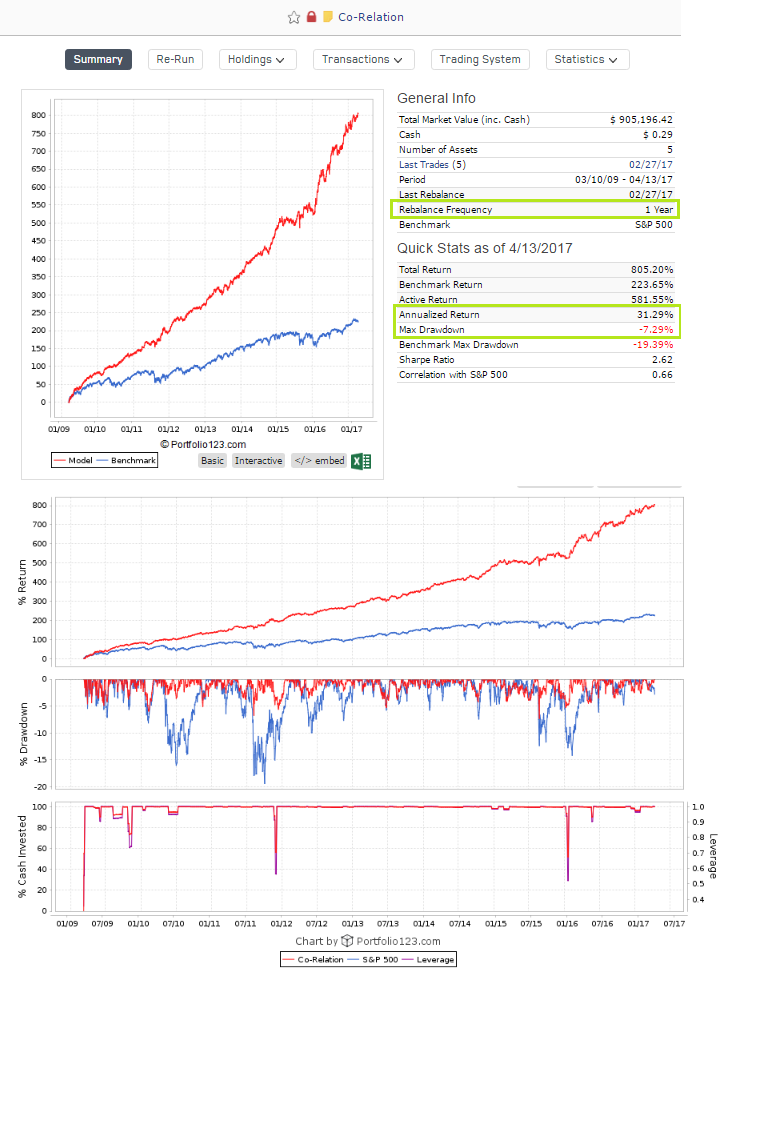
I love my system because I have researched its hacks for 17 years, and I love the low
Trading frequency, I love that it has relative low drawdowns, and that I need no stop losses.
I love that it uses very high diversification.
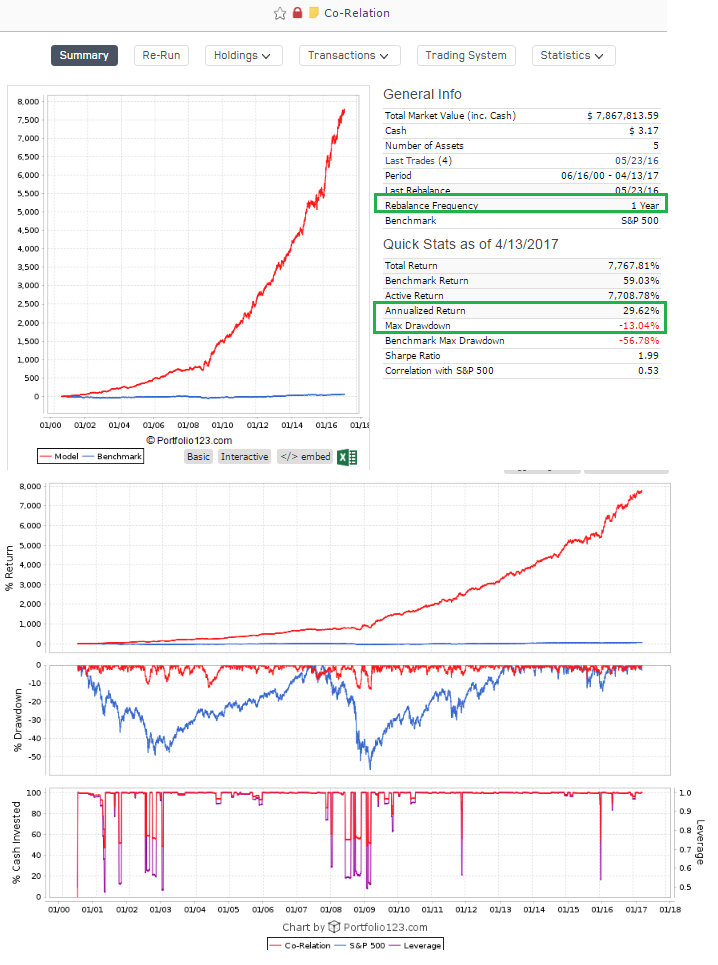
I love my system performance and turn over but not the draw down.
As i am in day job, i like less trading, less draw down and take less risks and would like to have reasonable performance.
When 5% and 10% draw down comes worst than the bench mark;
no matter what the more chances for questioning the system for it’s validity. and we will give-up the trading system and trading plan.
So, i come with a asset allocation plan. I will trade for few years this way to gain discipline.
Now, I feel good about, want to be disciplined and will follow my plan.
I want to grow the assets independently for 1 year, then re-balance to trim the excessive gain and buy more shares on loosing assets, it will naturally happens when allocate same size of last year using all the current assets balances.
This is the way big banks are operating, So, i just want to follow the proven method rather than weekly and monthly rebalancing of assets in a book which is more confusing for me.
Kelly formula is not used for drawdown calculation. Original formula is f = P(W) - P(L)/Odds. Special coefficient (named allowable drawdown) required exactly because of assumed zero correlation between events, which is not true in investing. N non-correlated bets reduce overall portfolio volatility by N^0.5. In practice without shorts using only long stocks, portfolio volatility can’t be lower than 1/3 of a separate stock volatility (even if separate stocks are low correlated to each other, they become much more correlated to the overall portfolio if it becomes bigger and bigger and overall volatility almost won’t change starting 15-25 stocks). Therefore Kelly original fraction should be reduced at least by 3 times.
Other way to think about allowable drawdown coefficient is an assumption that all bets may be losing (because of non-zero correlation) at the same time and you loose allowable drawdown portion of a portfolio.
Simulations show that full Kelly may lose 98% of the initial portfolio even after 700 bets (assuming you have 14% edge on each bet), half Kelly gives 50% drawdown. At the same time full Kelly maximum win is 480 times higher than original amount and mean value is 48 times higher. Full Kelly is still the optimal solution to maximize value in the long run.
Now the question is how to get this edge to play the game (if we don’t have it we should buy the market). For example, if we have a market timing model (whatever it is), that shows some correlation of its value to future market return, what is the probability of winning and what is the odds to put is in the formula.
The answer is a conditional probability. If we know nothing we have regular market return probability function (let’s say normal with M-mean and S-sigma or volatility). Since we have our timing model that show some correlation, we have some information and move our density function to the right and narrow it (mean is higher and volatility is lower). The market return was changed after we got our market timing model numbers because of conditional probability.
The question is how to calculate exact numbers? Let’s say my market timing model shows 0.5 correlation to 6m future S&P return. How did I improve my winning probability and odds in this case on average? I was asked about this question recently on a meeting with a potential investor. I have found the answer but not 100% sure about it yet. Maybe somebody knows for sure? The same approach can be applied to a ranking system, stocks selection process and allocation weights.