So XGBoost is the best Boosting program on the planet. But JASP’s Boosting program is menu driven and one of the easiest Boosting programs on the planet (I might add free). And I believe it is powerful enough to make one want to look into Boosting further.
Download for JASP: JASP
As far as data, I looked at data on a spreadsheet with over 1,000,000 rows of data at one point. There are problems (and strengths) with that study. But there are 3 problems with that data. 1) An average member cannot duplicate it quickly. 2) It may not be easy even for P123 to duplicate.
- And let me be scientific about this. Scientifically speaking and in retrospect I think some of the factors in that study s*ck as factors.
I think the study supported the effectiveness of XGBoost and of TensorFlow. But let me move to a method that can be replicated by everyone and with everyone trying their own factors that may not s*ck as much.
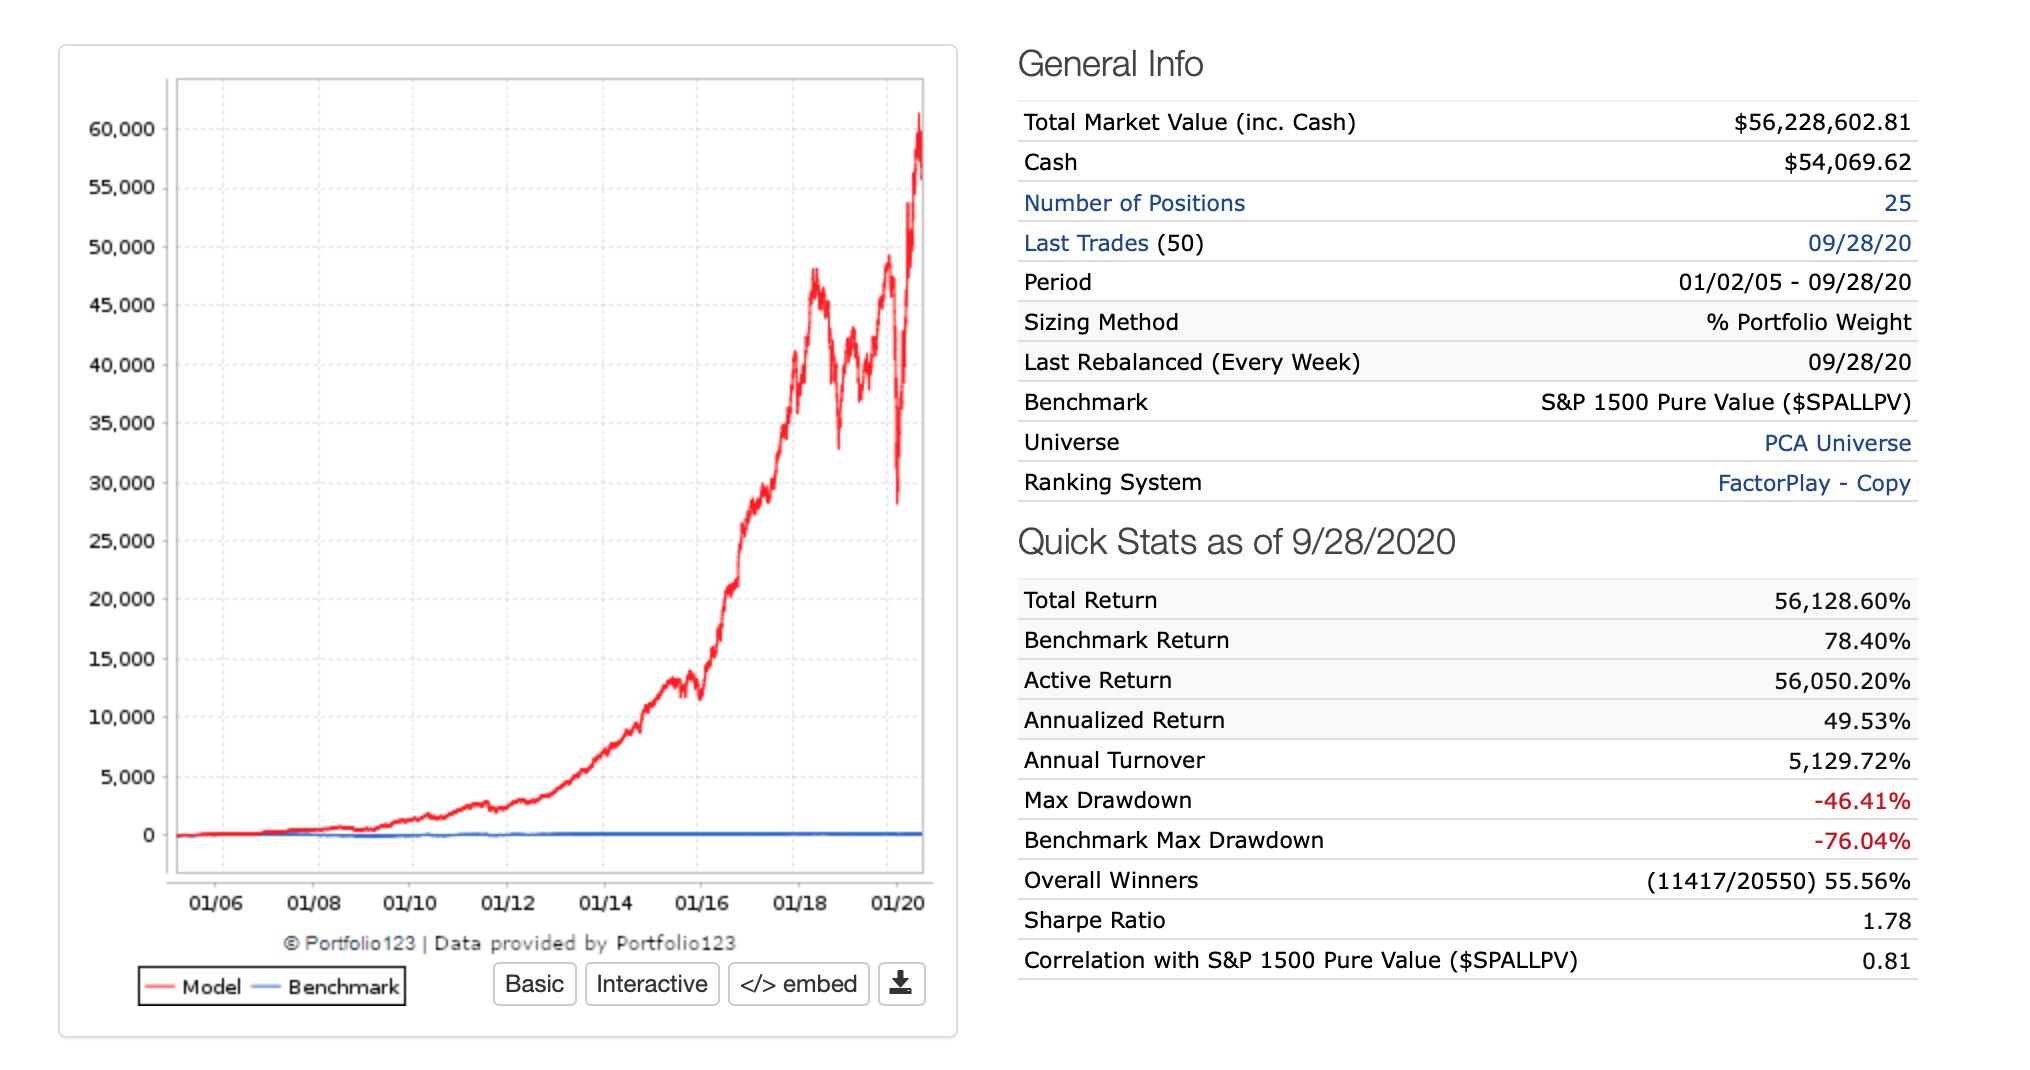
I used a P123 sim to sample 25 highly ranked stocks. For practical reasons I set sell rule: 1, Force Positions into Universe: No, and Allow Immediate Buyback: No. This allowed me to get the rank of a stock as the input and alway have one week’s return as the label and have the sim always buy exactly 25 stocks each week.
Keep in mind that using this method the stocks selected each week were not always the highest ranked stocks due to: Allow Immediate Buyback: No. Also I did not use slippage in order to avoid adding noise to the predicted returns. (Image1 of sim below).
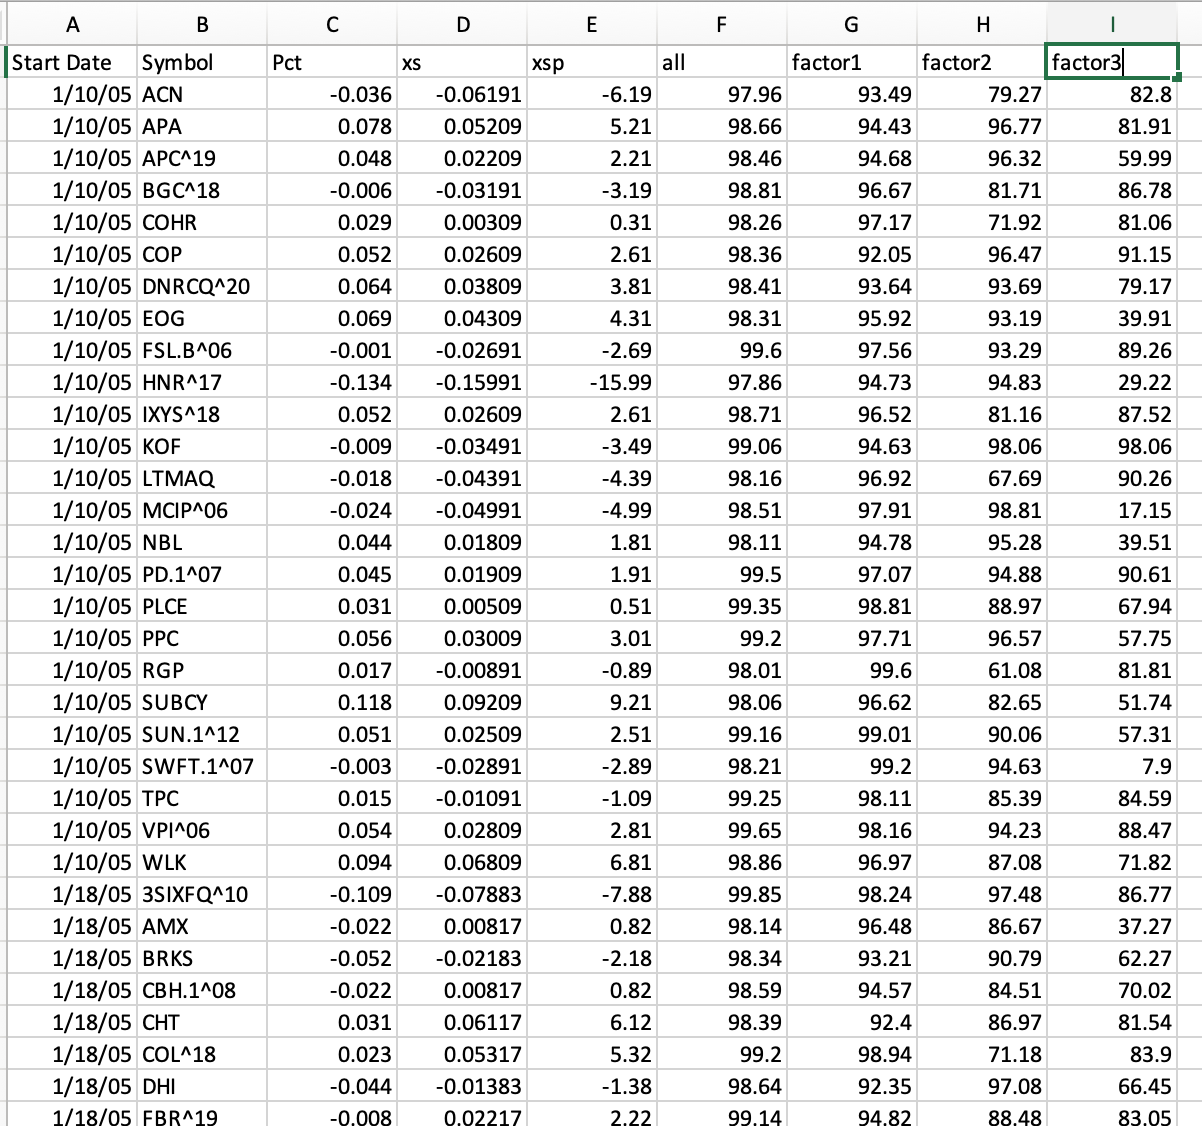
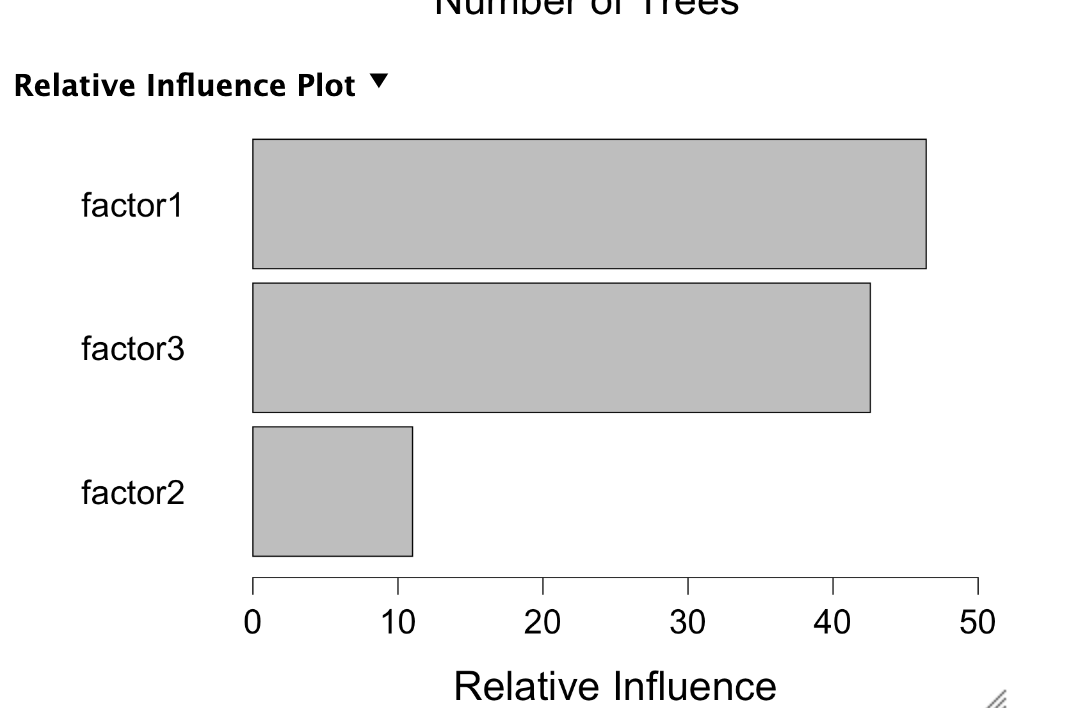
I then separate out one compound node (header name Factor1) and 2 other factors (Factor2 and Factor3) and got the ranks of those Factors for the same tickers over the same period. Quickly, I kept some factors in a compound node because they were highly correlated and separating them out would not help and add noise (I think). Generally, separating some of the factors was expected to be helpful with boosting because the inputs and returns were not a linear relationship.
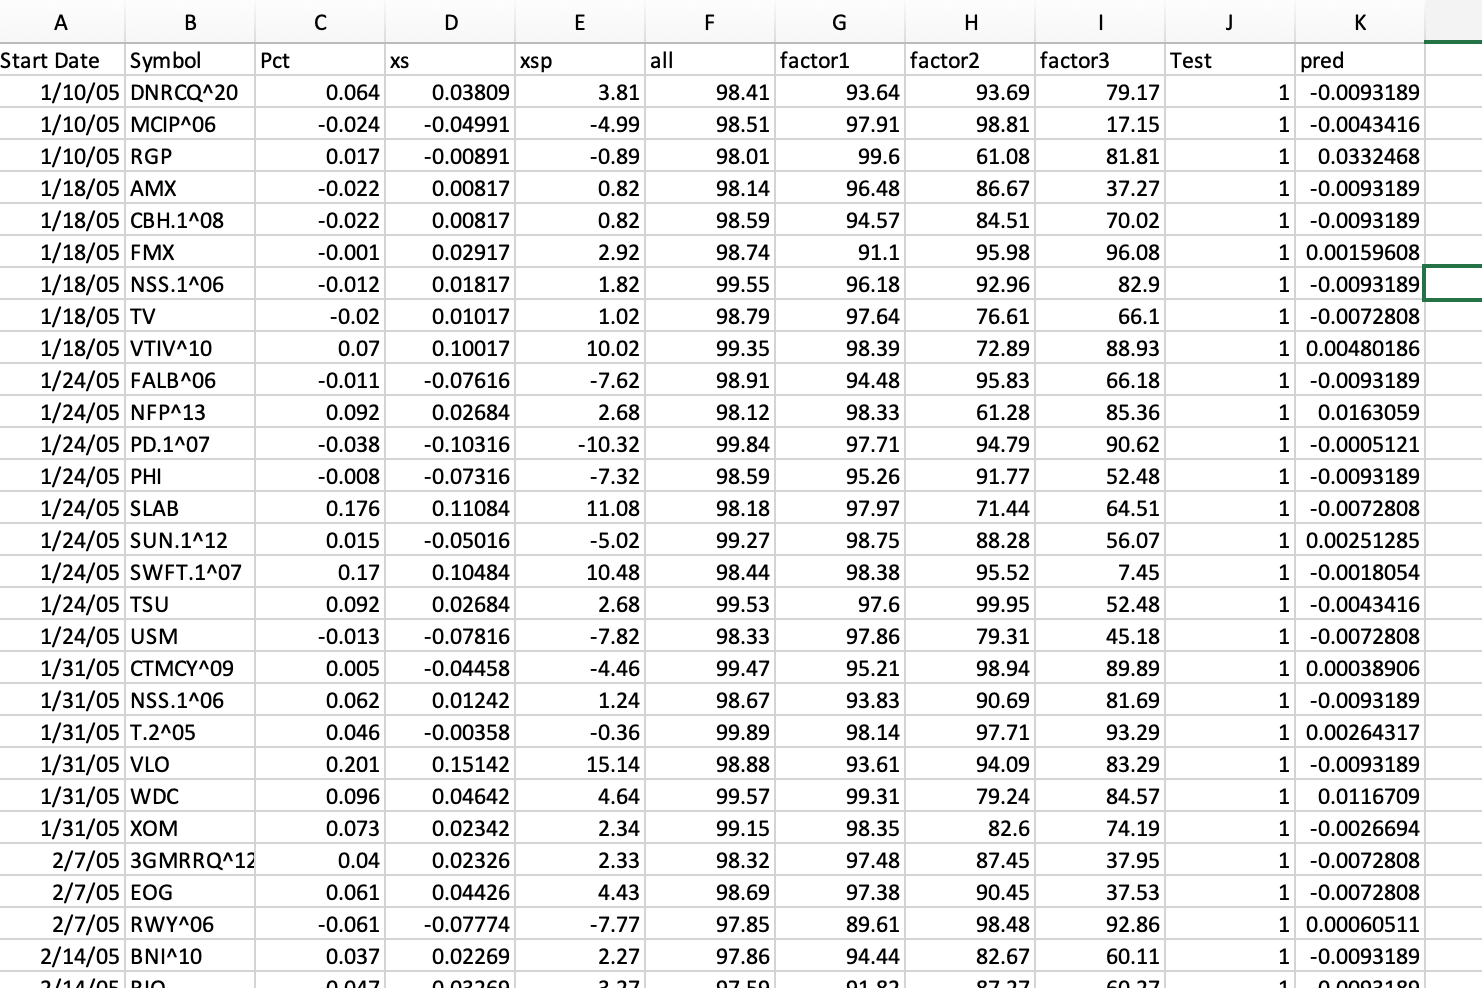
The spreadsheet also had returns, excess returns (compared the the average return of all 25 stocks for that week) and percent excess returns (xsp). Also there are column headers for date and ticker. So I got the data into a spreadsheet (image2).
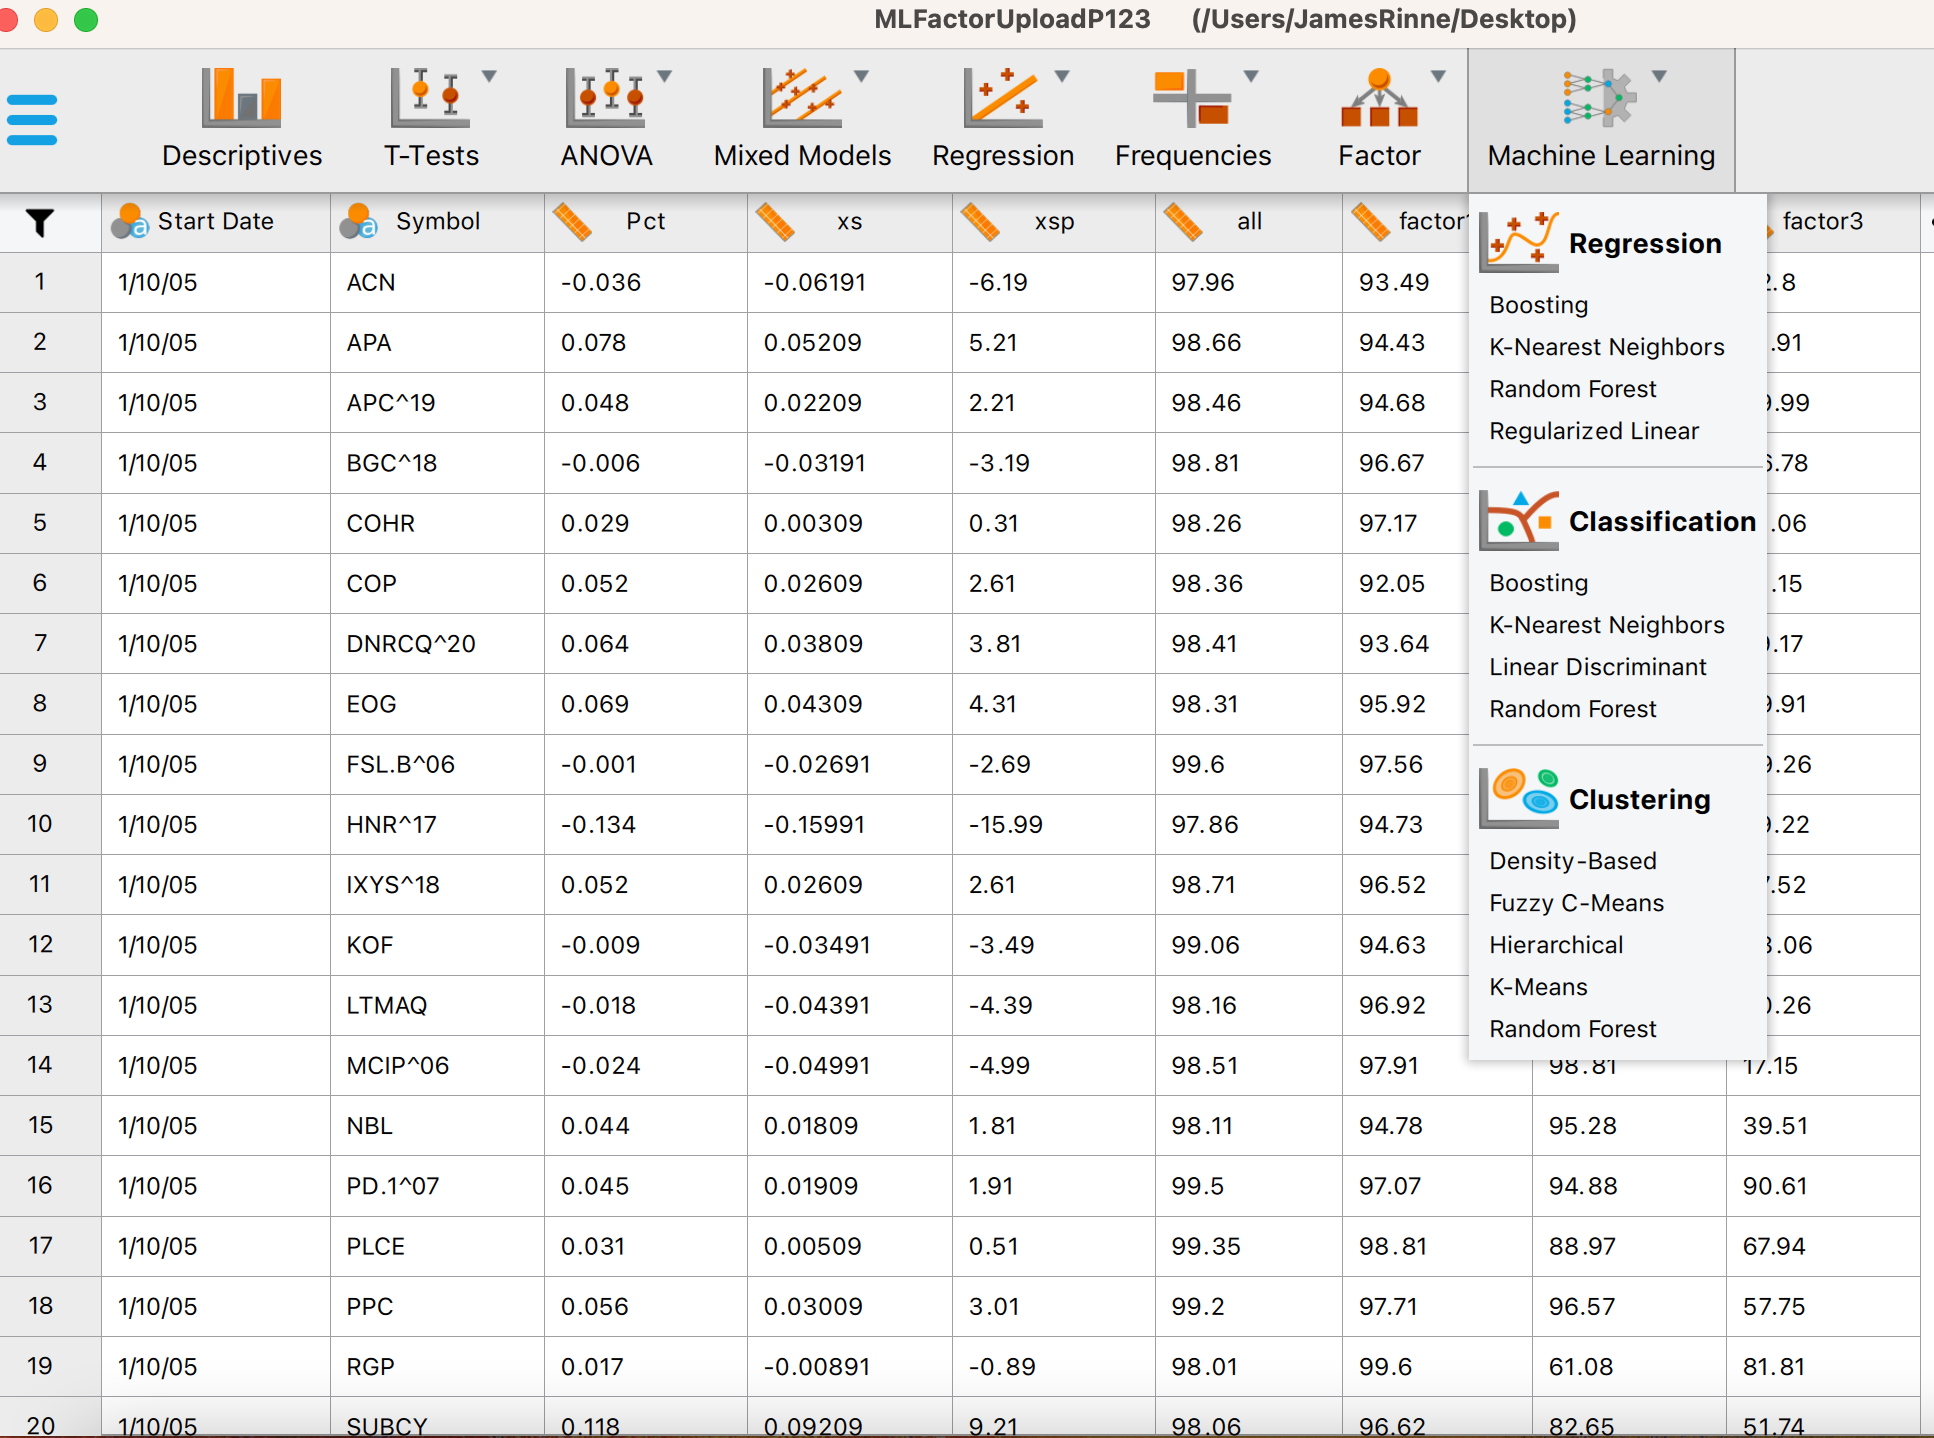
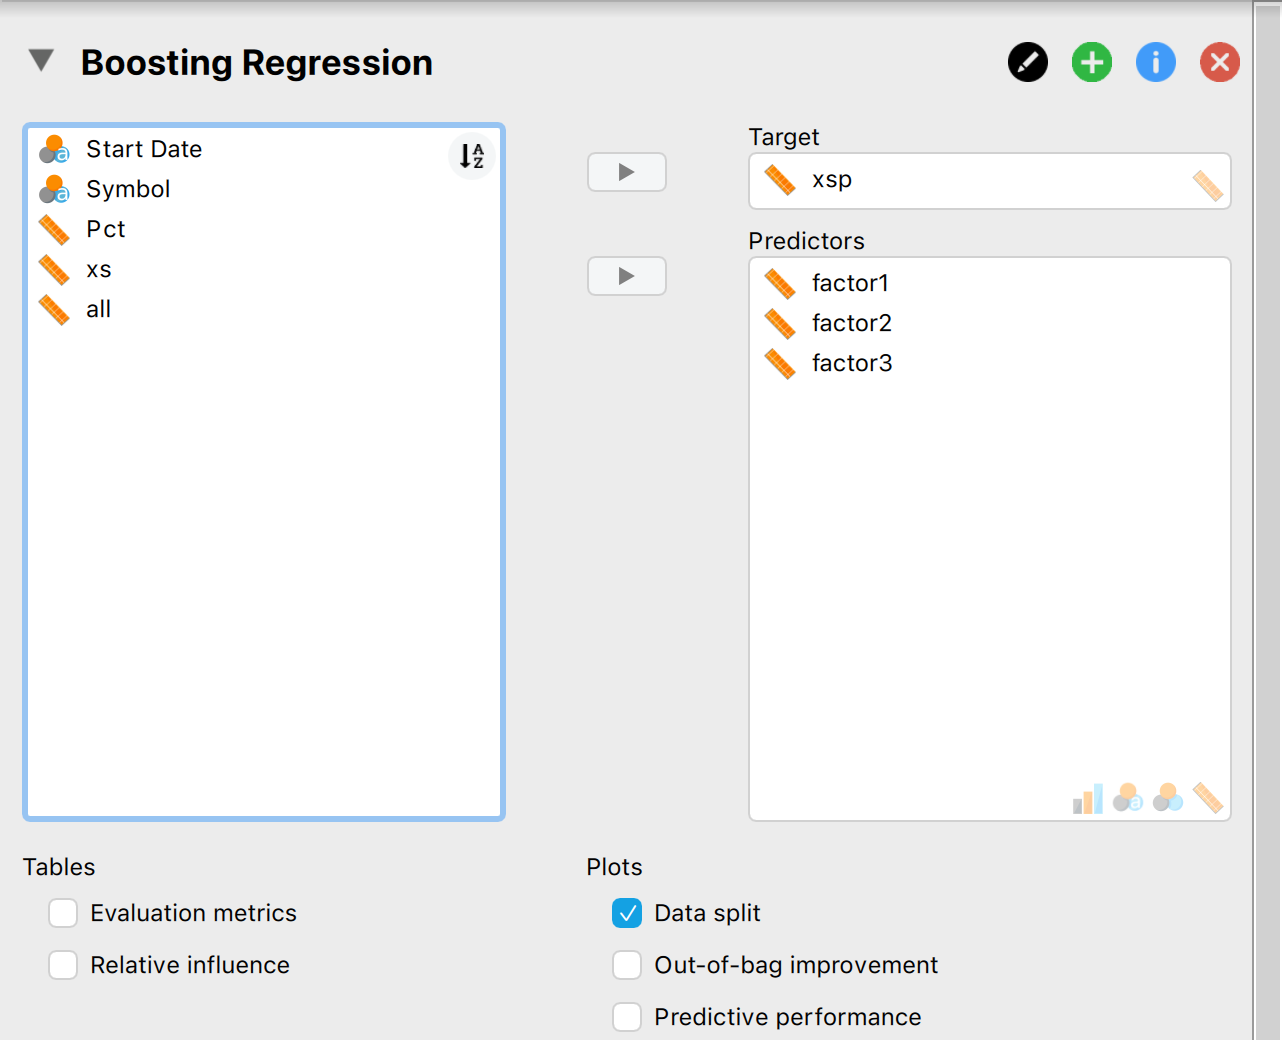
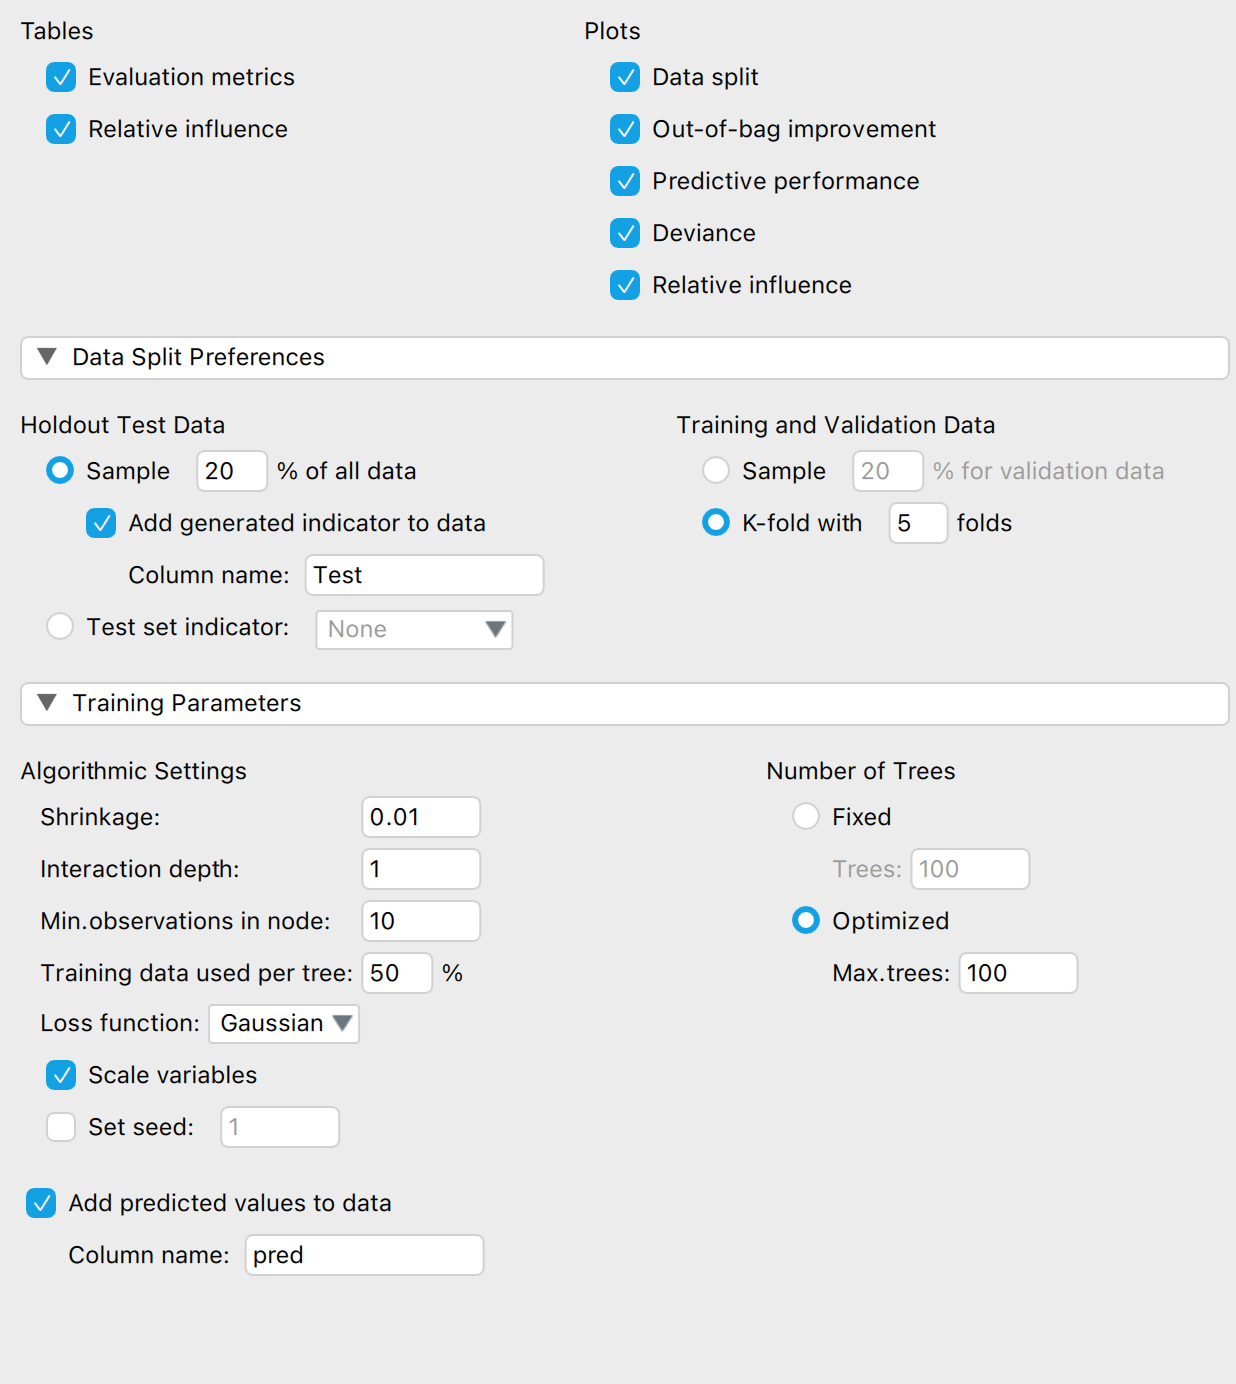
I loaded it into JASP and select Machine Learning-> Boosting (image3). Selected the input and label (Image4). Changed some of the settings (image5). JASP has train, validate and test set. JASP marks the Test data and also writes a column of predictions onto the spreadsheet. I exported this data to a spreadsheet. I sorted the Test column and removed anything not from the test set (image5).
Results:
The correlation of the predictions and the excess returns (xsp) was 0.039 p-value = 0.012
Sorting by prediction the 20% of the stocks with the best predictions had an average excess return of: 0.39%
Sorting by rank the 20% of the stocks with the highest rank had an average excess return of: 0.25%
Conclusion:
The predicted returns using Boosting were significantly correlated to the actual returns with a p-value = 0.012, n = 4100.
Boosting was a clear winner for the Bottom line. Selecting 20% of the stocks (n = 820) from this sample based on the Boosting predictions gave an average weekly return of 0.39% compared to 0.25% for the same number of stocks selected on the basis of rank. This if an over 50% greater excess return.
Discussion: I think that last supports the idea that a closer look at this may be warranted.
I will be interested in what other’s find.
Jim