do you guys still think you have an edge?

Hi henkie, best of luck in building your models.

I’m just a retail individual investor - so no pro credential - but here’s just some thoughts and learnings I’d share based on my 2+ years on the platform so far.

  • imho - build models around ideas that you believe in and are core to how you believe the market works. I’ve come to feel it’s better to have a model in alignment with my beliefs in this regard than a model built on factors that seem to work well, but maybe lead you to stocks that you just don’t have as much confidence in. I think sometimes models will inevitably pick some stocks that you might not understand - I doubt there’s a good way around it because its difficult to mentally weigh so many factors at once - but thematically there should be lots of picks that make sense and fit the kinds of companies you want to invest in. During periods of drawdown it’s important to have this gut level belief in the system in order to stick with it. I feel this part is important and I have modified my models over time to better reflect my personal preferences.
  • imho - I’d suggest also that in addition to purchasing a stream of future cashflows - also perhaps consider that the market also reflects changes in investor expectations and mood for a company. I guess we could argue those are the same thing, but I like to think about it directly as variance from expectations. I came to p123 with a Buffett-oriented longer term focus, but researching the data has led me to see that short term surprises and disappointments can drive prices to a large degree and can be a valuable component of models. I mention this because while I use a mix of longer term and shorter term data, I’ve found longer term data to generally be less valuable than shorter term data. My hypothesis is the market is more likely to accurately price longer term data and maybe it’s the deviation of recent data from past historicals and expectations that’s more important - but it’s just a hypothesis.
  • I guess I’d also just suggest going through the factors you expect to be core to your model, and finding what works and what doesn’t. When I started I discovered that some things that I believed to be important just weren’t. (For example, I found my emphasis on ROE and book value growth just wasn’t as important as I thought it would be - or perhaps the approach is too popular. Anyhow it’s an idea I ultimately abandoned in favor of others).

Again, I’m no pro - but hope some of this might be helpful. Best wishes with your modeling.

This post has gotten me thinking about evidence.

First: do……you have an edge? This is really a question that comes from the Kelly Criterion. And this got me thinking about a quote form “Fortune’s Formula” by William Poundstone:

"In the long run, “bet your beliefs” will earn you the maximum possible compound return—provided that your assessment of the odds is more accurate than the public’s.

Source: Poundstone, William. Fortune’s Formula: The Untold Story of the Scientific Betting System That Beat the Casinos and Wall Street (p. 71). Farrar, Straus and Giroux. Kindle Edition.

My “evidence” may not be convincing to someone else. But perhaps, I have some objective evidence to form the basis of a posterior “belief” or “assessment of my odds.”

Just one way to asses my odds objectively:

The images below show a Bayesian Single Sample t-test (from JASP) giving the odds that a sim is better than the benchmark (the odds are 1.43:1 in favor of the sim).

Hmmm, if I were to fund this sim maybe I would bet my OBJECTIVE belief (belief about the odds). Maybe I would fund in the ratio 1.43 to 1 (or less). Or put at most 59% into this sim. This would be down from where the odds were in the past, 3:1 (see sequential analysis).

As far as evidence, that is the best objective evidence I have—assuming that my prior belief that the market is not fully efficient is correct.

This is just a sim (out-of-sample from the creation of the sim). But I will be adjusting the weights of my ports—according to the odds—today.

I know Marc might disagree with the way I come to this belief about this sim. But based on his “belief” he might not want to put all of his money into this sim either. I am sure we agree on that much.

-Jim


Don’t forget that you have a much better chance of beating the market using ETF. That is your edge. P123 is great for managing it. I posted this in Feb 2016. 3.5 years later my Hypothesis is right and I am still invested in the Nasdaq. In fact if you had a designer model with this simple formula you would be in the top 10. I have evolved my investing to be Long QQQ and hedging with TLT and GLD. I alternate the percentage invested in each by the month. Here’s another even more simple Book. What are the odds that this simple book over the next 10 years outperforms the Nasdaq? It’s 20 year simulation would place it in the top 1% of all mutual funds. I think there is a culture that you have to use stocks to beat the market and that is simply not true. The evidence I think favors ETF and uncorrelated assets. Especially if you thinking 10 or 20 years and only want to beat the market by a little.

https://www.portfolio123.com/port_summary.jsp?portid=1510587

My post from Feb 2016:


There is another way to look at beating the market it’s boring and not fun but it works and it is rarely talked about which surprises me a lot since we are all here to make money. Well that is why I am here.
You don’t need a ranking system to beat the market. My best performing investment since 2009 is QLD. There is no ranking system it was just me betting that Nasdaq will outperform the S&P for many years to come. If the technology does not outperform other sectors than I don’t think the US economy will grow. Here are the reasons I choose it and how I continue to use it.

  1. 80% of fund managers cannot beat an index during a ten year period. If you don’t think you can then you should pick an ETF. Based on what I have seen over the last 2 years of Smart Alpha not many models are beating QLD. Since 2009 QLD returned almost 40% annually. Yes it had a 34% drawdown which makes it hard to hold.
  2. Very little effort and time is required to invest in ETF. I’v tried the day trading and I still do it but I have a niche that very few people play in. I prefer my ETF I sleep better at night.
  3. I have not been pure QLD I use it with Market timing and have lost money versus buy and hold.
  4. 8 years into a bull market I have reduced my exposure to QLD to no more than 25% of my investments and 0% right now.
  5. I use TLT and EUM along with QLD in a book to reduce my drawdowns. Again I will not make as much as just pure QLD but 8 years into a bull market means there will be a crash. After the next crash I will increase my expose to QLD.
  6. I know in 2008 If you buy and hold QLD you lose 83% and this is why you have to use market timing.

I will leave you with one thought:
What are the odds that this simple little formula performs well over the next ten years? If it was a Smart Alpha model would it be in the top 20%? I am going to bet it will outperform the S&P and it will beat 80% of mutual fund managers.
Eval(close(0,#spepscy)>ema(20,0,#spepscy) or (close(0,#bench)>ema(75,0,#bench)),Ticker(“QLD,TLT”),Ticker(“TLT,IEF”))

Cheers,
Mark V.

While simplicity is always an asset, I bet that 95% of all potential investors will abandon the model because of its 60% drawdown. Potentially losing 60% of your capital is just not acceptable. A good model must not only be profitable over time. The ability to trade it psychologically is of equal importance.

Agree Werner that’s why you have to have market timing I believe with any strategy stocks or ETF. That’s the edge start with something that wins over the long term and add some hedging and market timing so you don’t give up. The example was to illustrate the point that if you have a good hypothesis, uncorrelated assets and market timing you can beat the market with ETF over the long term. Below is a simple market timer. Members of P123 have much better ones but a simple moving average on price or earnings should save you half the drawdown. Like everything else the key is not to curve fit it to much. Georg has a simple model “Best(SPY-SH) Gains for Up & Down Markets” launched in 2013. It is just keeping pace with the market. I’m going to bet next recession it does well. Time will tell and time is everyone’s enemy.

https://www.portfolio123.com/port_summary.jsp?portid=1477114

Regards,
Mark V.

Mark. V

asset allocation is successful investment for long term. I should cultivate the discipline and mindset to stay for 5 to 10 years.

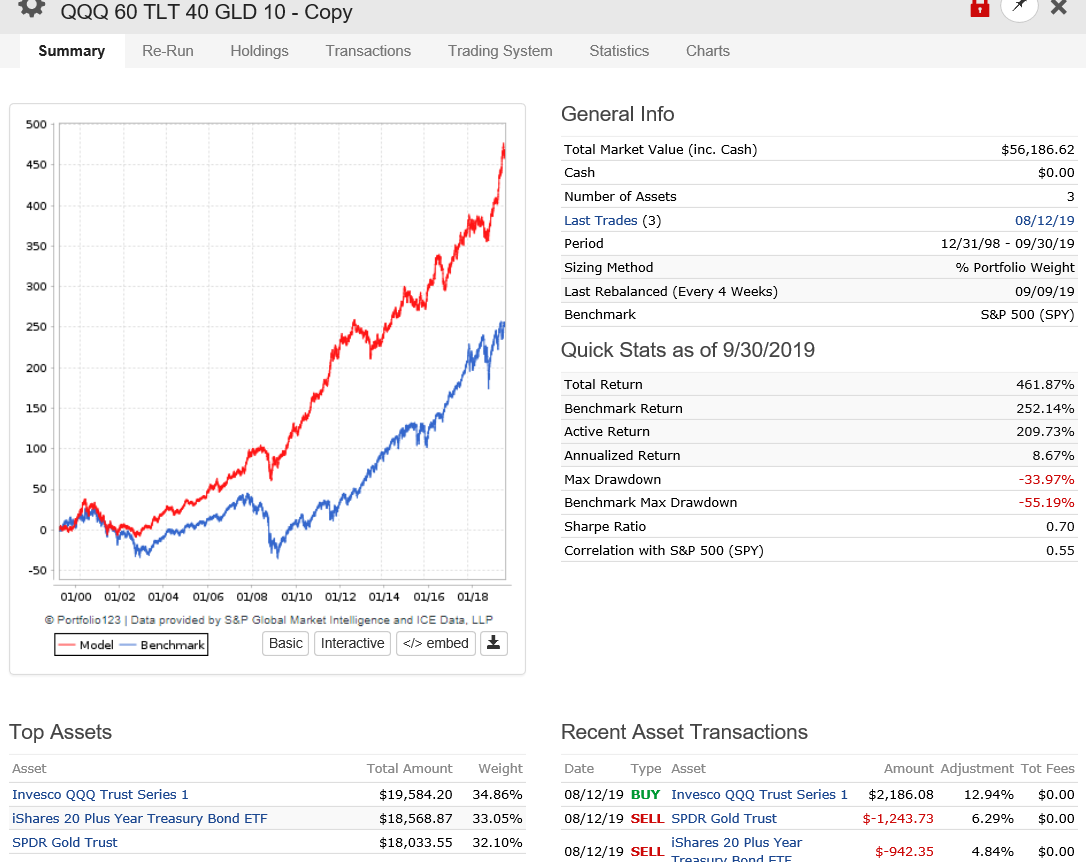
here, equiweight strategy for QQQ, TLT and GLD. these ETFs are non-corelated performance. should standout all the market cycles.

Thanks for sharing personnel investment strategy.

Please, suggest any books for asset allocation and long term investing; like multi year holding., so i can get knowledge in same lines.

Thank you for your generous helps.
Kumar :sunglasses:


P123 has the tools to give you an edge!!

For stock models the following provides good results:

It is not productive to design a universe to select stocks from. Rather use the expertise of professional fund managers and use the holdings of good funds as your universe. (https://www.portfolio123.com/mvnforum/viewthread_thread,10552#58434)

For example, Vanguard Dividend Growth Fund VDIGX does not change its holdings very often, so this is a suitable universe for us. The advisor, Wellington Management Company LLP, invests in a diversified array of stable, well-managed companies that have a history of or a potential for growing dividends over time. Does anybody in the P123 community really think they can select better stocks than the Wellington people?

The edge we have at P123 is to use a ranking systems to periodically extract from the VDIGX universe (about 45 stocks) the best 10 stocks, or so. (The fund manager cannot do this when the fund’s assets are $38.6B.) That has been working for me for over 5 years now, live. This model does not out-perform SPY every week, but over the long run anybody should be happy with a 16% annualized return.

out-of-sample performance 7/1/2014 -9/30/2019:
Best10(VDIGX)-Trader: CAGR= 16.28%, max D/D= -14.0%
Vangurd Fund VDIGX: CAGR= 11.32%, max D/D= -14.9%
S&P500 ETF SPY: CAGR= 10.37%, max D/D= -19.3%


Yes. But over whom?

Over Quantopian?

Yes, definitely I think. Move to Quantopian for the opportunity to start from scratch and try to duplicate what Marco does for us. And good luck with that!!!

Over someone who can fully integrate FactSet data with Python?

Maybe but it depends on how well they are using Python. I believe some of these people (mostly institutions) have an edge over us. No doubt in my mind.

Over everyone combined (average retail investor, Quantopian and Institutions)?

I do not know and things can (will) change.

Are we already seeing a change?

Something changed, right? Maybe it will change back.

I GET THAT MICROCAPS STILL WORK

-Jim

I think it’s increasingly going to be difficult (note, difficult …not impossible) to invest in micro and small caps until we get a full on recession and the market resets. At this point of a almost decade long bull market if you’re still in the micro or small cap space, and either haven’t graduated up to mid-cap and/or bought out, maybe you’re just not a good company. If you’re looking to catch the next generation of good small cap young companies on the way up, you’re chosing from a lot that the the VC boom of the last 5 years didn’t snatch up first. Right now I see a lot of SPACs and a lot of fallen angels hoping for a desperation turn around story that might get a temporary YoY bump on a recent earnings report because the previous comparison year was abysmal.

I created a custom series that shows the number of mid caps in the “All Fundamentals” universe that were microcaps five years earlier. Nothing has changed. Very very few microcaps ever go on to become mid caps.


1 Like

Cary,

I like this a lot. I like that it is simple and gives me hope that we may be able to look back and say it all made sense. Maybe after a recession what worked before will start working again.

The other thing you probably thought about and did not put in your short post is M&A

These companies essentially disappear. You will not find them as Mid-cap stocks now and be able to look back and see them as small-caps.

Anecdotally, when was the last time you had an M&A for one of the stocks in your Ports? This could be looked at objectively too, thru a custom series, and it may not be a factor. I have not looked at this in an objective manner.

Anyway, whatever is going on, I like your idea and wonder if the inversion of the yield curve might still be a reliable signal with your main point holding: hard for small-caps to do well until the reset of a recession. I do not really know and only time will tell but thank you for your post and your main point would probably be my bet for now.

-Jim

P123 gives you an edge. As mentioned on page 7 of this view-thread I like to use as universe stocks from ETFs or mutual funds selected by capable managers. I particularly like the Vanguard Dividend Growth Fund VDIGX for which I have periodically downloaded holdings since 2014.

I have now constructed a model that uses the historic holdings for the backtest, using portbars to define the appropriate list of stocks to be used as the universes over time. I have launched this as a designer model so that we can watch performance. You can read the description here:
https://www.portfolio123.com/app/r2g/summary?id=1587460

Performance chart since 2013 is attached. Because VDIGX’s holdings do not change much over time the 2013-2014 performance should not be much affected by survivorship bias; from late 2014 onward the model uses a dynamic VDIGX universe which is updated every three months.


Hi Georg,

I agree we still probably have an edge.

Do you think something cyclical has been going on recently? If so, what do you think it is? I do think it has been pretty significant and generalized (whatever it is) as many on the designer models would suggest. (Mean of the 2 year excess returns: -17%)

You said the inversion of the yield curve probably would not cause a recession before June 2020 (if I remember correctly). Any update on this signal?

Actually, I would be interested in any impressions you have (or any signals).

Thanks!

-Jim

Edit for below. Thanks! Got it bookmarked.

Jim,
It is tough to make money in the current stock market environment. I have no evidence of anything cyclical going on, but I would stay out of small- and micro-cap stocks.

As to recession probability:
We publish weekly the iM-Business Cycle Index on our website and on Seeking Alpha.
Here is the perma-link to to the latest update, it never changes:
https://imarketsignals.com/bci/

When the BCIp and/or BCIg goes into the danger zone then it would be prudent to lighten up on stocks because a recession is then imminent.

The yield curve has been inverted and a recession could be on the horizon. We also, among other recession models, monitor the Unemployment Model which would now warn of recession if the Unemployment Rate becomes 3.9%.
https://seekingalpha.com/article/4295037-unemployment-rate-signal-recession-update-october-4-2019

“The great sag?” I am not sure I even know what that means. And honestly, if he is right I hope history comes up with a better name.

Still, the track record of Ray Dalio (who controls largest hedge fund that you cannot invest in) is second to none. He seems to be one of the few who makes useful macro predictions.

So here it is: THE GREAT SAG

Note: He says we have already entered into “The Great Sag” so technically this would not be a prediction. But that would be consistent with already having an average -17% 2-year excess return on our Designer Models.

These are the stats on the models currently available. I personally look for positive 1 and 2 year periods. There’s a handful of models that are positive from inception but when you look at the last couple of years, it’s trailing the market by quite a bit.

Has it ever looked this poorly in the past?

Positive alpha 3 m: 81/186 = 44%
Positive alpha 1 year: 35/186 = 18%
Positive alpha 2 year: 20/186 = 10%
Positive alpha 3m+1y: 20/186 = 10%
***Positive alpha 1y+2y: 19/186 = 10%
Positive in all 3 periods: 11/186 = 6%

Hi, everyone. In my view, the public market is very efficient nowadays.
It is extremely hard to make any stable alpha long term on it:

  1. Market timing doesn’t work for sure. See Hull’s poor performance HTUS ETF (the best team in this field).
  2. Factor timing is the same as beta timing (market timing) - no chance.
  3. Constant (no timing) smart beta/factors and all this stuff produce poor results now as well (decreasing alpha to several percents due to the market efficiency). An interesting site about factor performance https://interactive.researchaffiliates.com/smart-beta#!/strategies/compare?selected=value-concentrated-value
  4. All huge numbers even “long time” shown is just cherry-picking bias. Statistically, few from hundreds inevitably will get good results even long term (but not more than let’s say 5 years).
  5. An opportunity to make alpha not by chance lies into some competitive advantages/not crowded markets: non-public info, value creation itself (active investors with big shares), tech advantages (in few hedge funds for example eaten by their fees), private equity deals (not so efficient markets) etc. Making ranks, models, whatever else won’t create enough to produce visible after all expenses alpha at least in commonly used ways (short strategies, for example, are not crowded yet - but again borrowing costs may eat a huge amount of alpha, P2P lending into capital lacking markets etc).

Here at Portfolio123, we’re trying to make it easier to get alpha. Try out the Core: Combination ranking system (https://www.portfolio123.com/app/ranking-system/354585 ). Do some bucket tests on various universes. You’ll see: alpha is still there, even using pretty generic and traditional factors. The secret is a simple one: avoid stocks that are overvalued, overhyped, poorly managed, low growth, or highly volatile. Look at the low end of the bucket tests and you’ll see what I mean. And yes, it’s been hard to make alpha lately, but it hasn’t been very hard to make money. Maybe, just maybe, the harder it gets to make money, the easier it’ll be to make alpha.

1 Like

I used pretty much the same ranking with hundred factors in some variations https://www.portfolio123.com/app/ranking-system/335897
Real-life alpha for 5 years is very small or negative (not considering aka 5-10 tickers lucky outlier ports). Short ports make alpha but the average borrowing costs in IB for my 20 tickers port is 15% which halves potential performance (some stocks cost 50-100% annual interest).

Google Demonstrates 'Quantum Supremacy."

Granted, Google probably is not using quantum computers for investing YET. But de Prado is planning for the future and has a chapter about it in his book: “Advances in Financial Machine Learning.”

Realistically, where are the institutions now? Somewhere beyond the spreadsheet I would say. And some claim the market was efficient before the spreadsheet was developed.

The Designer Models lost a little ground last week—as did the percentage of my investments in individual stocks or ports.

-Jim