I like all of this including Yuval’s link to this (troubling and hilarious) idea in Josh’s article:
“Here’s the perfect business idea for this environment: Open a Hundred Dollar Bill Store™. You sell hundred dollar bills for ninety dollars each. You’ll lose ten dollars per transaction but you’ll do a trillion in revenues in year one. Maybe you show an ad to everyone who walks into the store and you break even. User growth with be on the order of 1000% per month. A billion users. You’ll be the biggest IPO of all time when Goldman’s underwriters get wind of that growth rate. Go public and let someone else worry about a competitor selling hundred dollar bills for eighty-five.”
If it is like 1999 will we see March 10, 2000? That was the peak of the NASDAQ back then, I think.
Is this time different? As Yuval says, we will see. But it could be useful to see how similar things really are.
Yuval’s post got me wondering how the FANGs play into all of this, for example Are the FANGs different than the tech companies in 1999? Do they have more market capitalization for example? Will that make a difference, even if they do? Will even more money flow away from the FANGs?
Are the FANGs even relevant to this conversation? Maybe I should be thinking of the Ubers-- that are not showing a profit yet–to be consistent with the 1999 analogy.
In 1999 the Shiller CAPE ratio was over 40 (now about 29). Figure-1
The CAPE MA35 ratio (CAPE / 35-yr mov. avg. of CAPE) was about 2.5 (now about 1.2). Figure-2. Estimated 10-yr real forward return in 1999 was -6.0%. Now +6.0%.
The S&P500-real level in 1999 exceeded the upper prediction band, now just above the long-term trend.
Therefore the US stock market is only marginally overvalued.
Regarding the FANG stocks, I think Apple, Facebook, and Google are all fairly priced while Netflix is absurdly overpriced. The twenty stocks with the most absurd overvaluations today (not including health care or financials), in my opinion, are Liberty Broadband, PagSeguro, Snap, First Solar, MongoDB, Zoom Video, Elastic, Smartsheet, Anaplan, Netflix, PagerDuty, Okta, Roku, Twilio, Pinterest, Zscaler, Avalara, Uber, Alteryx, and Coupa. These are the companies I’d compare to the tech and telecom stocks of 1999. If (and it’s a big if–I’m not making any predictions here) more than half of them go down significantly in price, that’s not necessarily going to cause a market collapse like we saw in 2001. But it might help value stocks, because that money would, I hope, go into more sensible investments.
Sounds good. By the time I had finished my post and read Geog’s post that was what I was thinking too. I realized that the FANGs (except Netflix) were not the issue (as you had already realized).
Georg made me think that the market-cap of the pertinent companies was not enough to cause a market collapse.
You add the names of companies more to the point than most of the FANGs.
I guess we will see if the money goes into more sensible investments but I think they might (also).
“…the level of the small-cap benchmark earlier this month at about 51.8% of the level of the bigger gauge, or the lowest level since March 2009. That figure stood above 60% around a year ago.”
Note that March 2009 was a good time to be in small-caps. Good now if the “divergence” signals a reversal?
That does not mean we might not see a little “correction” of the overall market first—even if this does mean anything.
I’d like to resurface this thread as a prompt for P123 to add more sources of edge. Overall, the designer models show negative alpha. So collectively on average, we are out both time and money. However, I think we all consider M Gerstein both knowledgeable and experienced in this domain. So, let’s focus on his public out of sample performance: and almost any way you slice it, the evidence is not consistent with outperformance.
I’m not saying this to criticize but to simply point out that if Marc is having trouble since 2013 beating a passive market (excluding taxes!), maybe we need to acknowledge potential areas of improvement in the research platform? And please, let’s keep this discussion based on evidence. Having one or two users outperform isn’t distinguishable from picking out a few of us who flipped heads 10 times in a row.
As an individual investor; we have lot of edge.
to identify the edge and believe that is the edge it will take decades of observing market and write journals about own behaviour, trading plan and investorself.
Feb 2016 and Dec 2018 market went to multi year low. it is great buying opportunity if you know you are sitting in the edge.
what to buy that is another question to novice.
suggestions novice to novice;
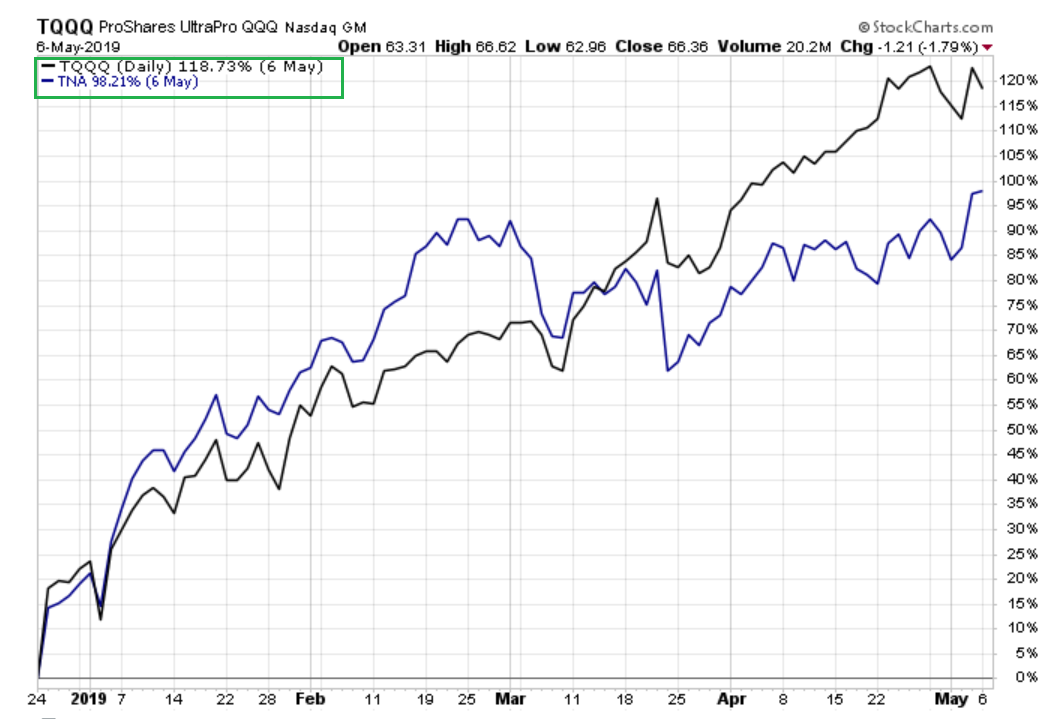
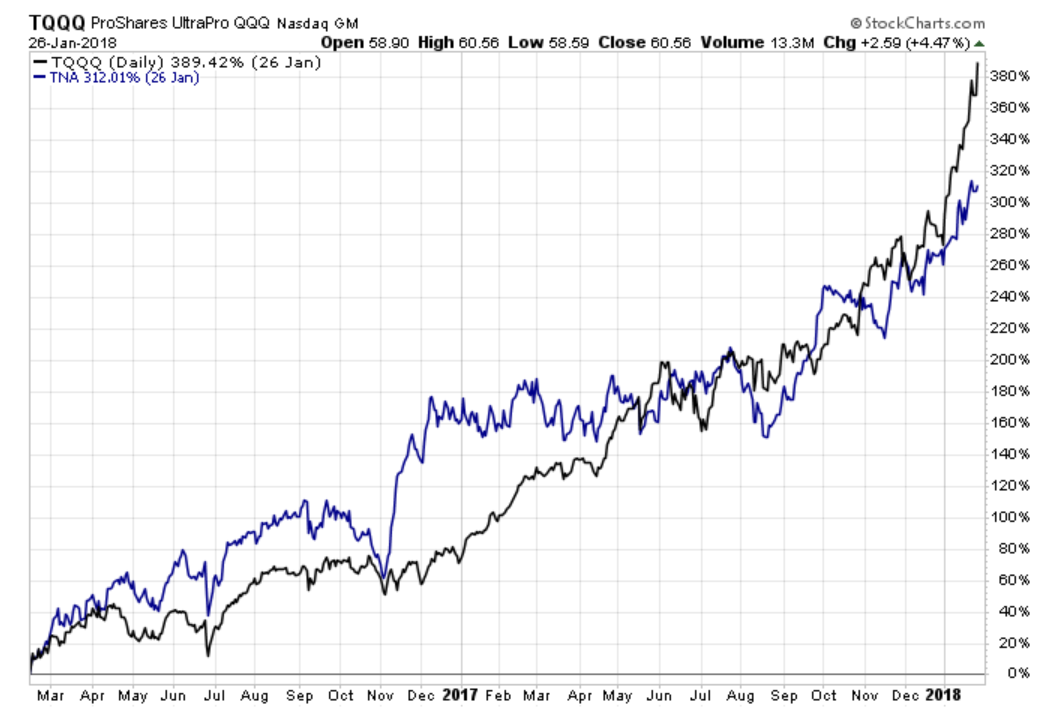
a. if bought TQQQ, TNA at Feb 2016 it returned 300+% Jan 2018.
b. if bought TQQQ, TNA at Dec 2018 it returned 100% May 2019.
All the news in ibd and financial press, question to google.
The economy is not good expecting recession in few months; the draw down and market will be worst than 2001 and 2018 crisis.
NEED TO FILTER NEWS; FOLLOW WRITTEN TRADING PLAN.
I am very greedy; in simulation market was 50% down in 2001 and 2018, Feb 2019. Thought of that is great edge and ignored the opportunity sits in front.
10% to 20% correction can expects once in 2 to 3 years. It is a edge.
40% to 50% corrections are once in a life time. waiting for this draw down is not worth;
FOLLOW WRITTEN TRADING PLAN, don’t miss the opportunity when market come down to multi year low.
i don’t know, p123 is flexible to implement all technical analysis using weekly and monthly data points as www.stockcharts.com does.
I am comfortable to holding stocks for 6 months to 1 year period. fundamental will not change every week or every month.
Here, i am giving my edge. the questions remain whether can i follow my own edge if the opportunity presents next time ?
We are attempting to do so. We will be rolling out the import-your-own-factors feature very shortly. We have just made new, improved core ranking systems (which you can see here https://www.portfolio123.com/app/opener/RNK?cat=33143 ) and will very soon introduce new, improved P123 screens and simulations. A number of the feature requests are in development. And if our negotiations with data providers prove fruitful, we expect to be rolling out some major changes to our data that will also enhance your edge.
The way to get an edge over the market, in my own opinion (which not everybody at P123 shares), is to minimize risk by looking at the stocks and ETFs you buy from as many angles as possible and to rely on factors that work but are seldom used. This involves lots of research and hard work.
But one can invest very successfully using P123 without having “an edge.” If you’re looking for safe, steady investments, we have plenty of them.
They show negative alpha compared to what? SPY? The large majority of ETFs and other investment products show a negative alpha compared to SPY right now. SPY happens to be trouncing everything in sight, but historically, that has not always been the case. You need to compare each product to its own benchmark.
If indeed they show negative alpha, there are, in my own opinion, two reasons for this. 1. Many of those models were overfit and then untended. 2. We have been in a peculiar market for the last twelve to eighteen months in which large caps have strongly outperformed small caps, and since most of these models have been small cap models, they’ve suffered as a result.
I’ll let Marc address this, but I don’t believe that disparaging someone’s “public out of sample performance” is a good thing to do.
If someone who trades a lot outperforms consistently, it’s usually not luck at work. The excess returns that a number of P123 users have gotten over the years are, in my opinion, a result of hard work, not luck. If performance is indistinguishable from luck, then there’s no point in looking for an edge.
And if you’re looking for evidence, how would you obtain it? Do you want to have users brag about their performance? Some of them (myself included) do so occasionally on these forums, but is that what you’re looking for? What kind of evidence would be ideal to convince you that using P123 can give you an edge?
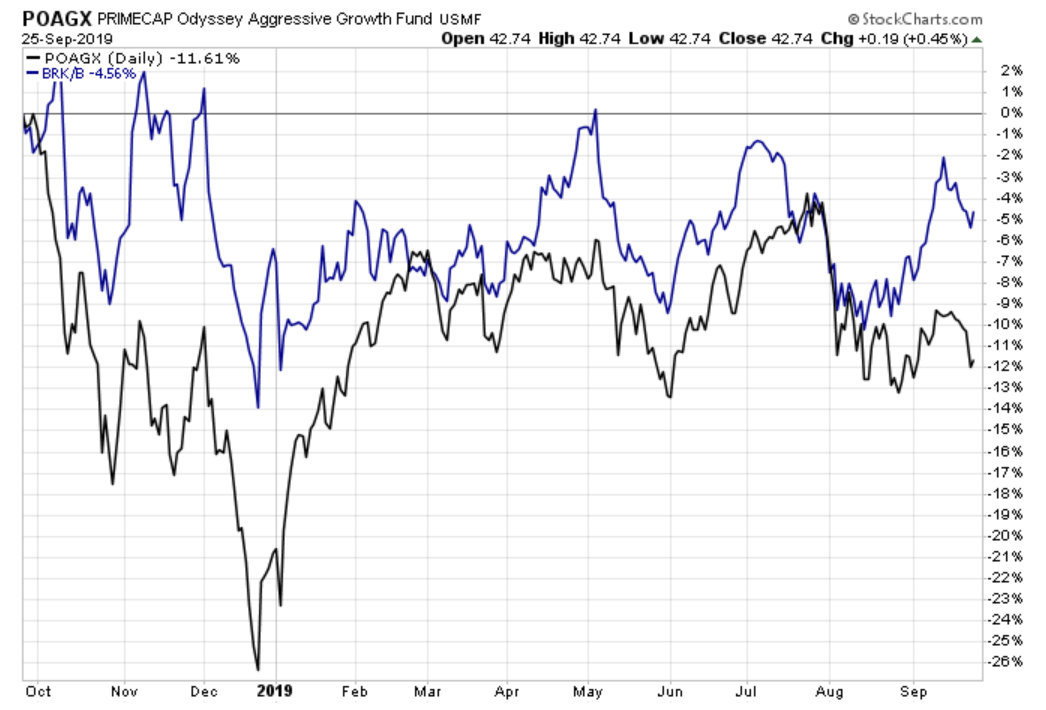
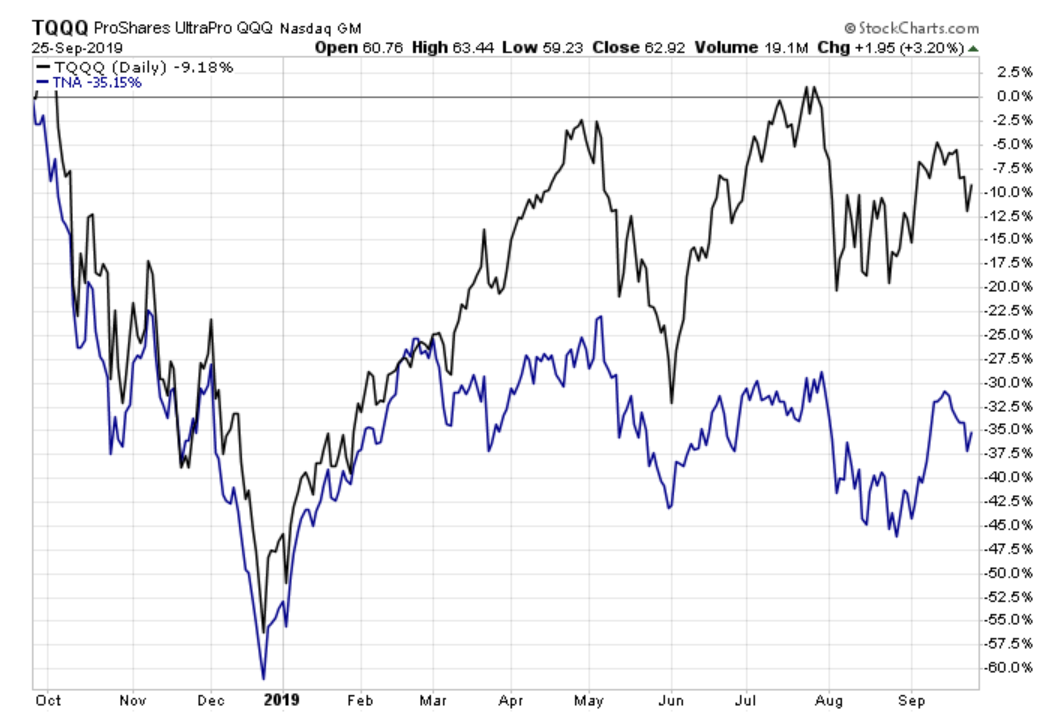
Here, 1 year peformance of Berkshire Hathway, TQQQ and TNA.
So, most of the p123 designer model performed similar way. It is not all over the world green. p123 is in red.
I agreed.
Believe, you are from news magazine background. you will accept all opinions.
Fundamentalist believe - financial statements matters , don’t want to see single chart.
Technical analysis believe - Charts price has everything. don’t want see financial statement and any ratio, income, profit, etc.,
Quantitative analysis believe - everything in past simulation. don’t see chart and financial.
all of the 3 analysis have blind spot. why we can’t see in all 3 angles using eyes and find best stock quarterly once and yearly once.
Why we can’t have additional branch in parrallel to designing models. to pick 10 to 20 stocks manually tradable universe strictly SP500 universe.
getting 20% annual return is dream for many investor; if we get thru manual stock picking why it is not acceptable ?
same as designing model; the past real time performance will be accumulated; if the model is worth; there will be subscriber.
For this case, I will not blame my model or p123 for performance. I will blame myself and i can apply all of my skills to improve my model;
I believe i have edge by screening stocks in p123 and apply fundamental and technical and market conditions,
but i am not 100% i can implement my ideas as it is in dm. i will be out of market first week of Oct 2018 to until last week of dec 2018 if i have manual market timing provision.
here, i am attaching the yearly stock pick strategy in p123 performance. decades of knowledge from successful retired experts, less effort in trading and more profits. all of my stocks picks are trad-able and more liquid.
Expect p123 should manual stock picking model and manual market timing in addition/parallel to existing dm model.
To understand market is cycle, it took me 10 years.
Market is not complex and not efficient if you trading in long term. And expects 20 pct returns per annum. It is achievable just using market cycles with long term trading plan.
First one should have plan what he is doing, then implement the plan using p123 tool is good.
I agree, It is not overnight success. With help of p123 community I keep following market with interest.
Agree, the market is cyclical, but it is not hard work to out-perform the S&P500.
Here is a link to a tax-efficient ETF model which uses the cyclical effect and only switches one position at the end of April and end of October each year after having held the position for 18 months. That amounts to 10 minutes of work each year.
For the approximately 18.5 year period from end of Apr-2000 to Sep-2019 the backtest showed an annualized return of 12.3% with a maximum drawdown of -24%. https://imarketsignals.com/2019/im-tax-efficient-seasonal-etf-switching-strategy/
Apologies for any misunderstanding. I tried to be clear that it’s not a criticism but a way to show that a smart, knowledgeable, and skilled investor (and one who purports on the satisfactory state of affairs at P123) is not outperforming. The remark was intended to complimentary toward Marc.
Agree about the frequency of bets. Empirically for example, we could see a non-random number of designer models outperforming. Designer models presumably are ex-ante models that users believe outperform. If we assume everyone has no-skill, half would outperform (this is not the case). Anecdotally, we could see additional features being rolled out that show how existing strategies, utilizing either new data or technology, are improved. Note this is separate from changing factors after periods of under performance.
Interesting thread… read it all the way. I have no past experience with investing in stock markets. My background is entrepreneurship and I am an engineer by education. The last few months I have been educating myself in long term investing in the stock markets by reading the books and blogs of successful long term investors. And I am considering setting up my own stock strategy. My current thinking about whether one (or myself) can have an edge is as follows… I am sure it is flawed/incomplete in many ways and I welcome all feedback!
So this is my thinking:
The past years performance of buying stocks based on fundamentals which (used to) indicate a favourable price has been poor. This could be because information, strategies and ranking platforms are more widely available. Some people here believe that. I tend to believe more that with a strategy based on fundamentals (instead of a random set of signals which works well the past years) in the end you will prevail when the market swings back to ratio. But judging from what I read here and see in the data that can take excruciatingly long.
In the end all you are buying are future cash flows at a discount. I don’t see anyway around that without becoming a speculator. There are two things that did fundamentally change I think: 1) Interest is low and that makes future growth more valuable today due to a lower wacc, 2) Not valuing intangible assets (that actually do generate cash) does not seem smart today (while it was smart in the past when most businesses needed way more tangible assets and that way you could create a good margin of safety by buying below book value). Even if it is correct that these two things have fundamentally changed, that still does not mean that one should pay for anything else than reasonably expectable cash flows. And of course you want to pay way less…
If what I am thinking is true, then I need some strategy based on ranking on fundamentals which proxy NPV while taking into account some other basics (interest rates, financial strength etc). And then just wait until the market turns around. Until another insane proposition like wework goes to market and bursts the bubble in that part of the market.
Anyway, I don’t have a concrete strategy for this yet. My financial skills are modest at best. But I’ll try and create something. I also have the feeling that if I create something that it will perform very poorly in a backtest (at least in the past 5-10 years, perhaps results 10-20 years back are good).
All thoughts and comments on whether this line of thought has any edge and how to set up such a strategy are very welcome,
In order to write this article, I had to create a system on Portfolio123 that would estimate NPV. The only way I could do so was by using custom formulae. For instance, I created a custom formula for WACC in which I referred to other custom formulae for cost of equity and cost of debt (which vary by industry), and my custom formula for intrinsic value then relied on that custom formula for WACC. It was a tremendous amount of work (though very enjoyable). There are a lot of clues in the “Solutions to DCF Problems” part of my article as to how I did so, and I’d be happy to answer questions should you face obstacles. But I do think most people who estimate NPV end up creating their own solutions.
It was a very valuable exercise for me. Some analysts and many investors have stopped using NPV calculation and instead rely on the usual value ratios to get their margin of safety. Personally, I have not yet switched from the value ratios to NPV, but perhaps I will gradually do so.
I also think that if a strategy worked a while ago but not in the last ten years, it’s less likely to work in the next few years than a strategy that has worked in the last ten years. There is some mean reversion in how well factors work, of course, but there’s also a fair bit of persistence. I can’t really answer which is better: using a complicated NPV strategy or simply relying on traditional ratios. But keep in mind that valuation has to be paired with some analysis of quality and growth. As Buffett said, “It’s far better to buy a wonderful company at a fair price than a fair company at a wonderful price.” For me, value has to take a back seat to quality (though, of course, if you can use a lot of quality considerations in coming up with your NPV, you’ve done your work).
Thank you Yuval. I will read your articles. I was thinking btw of using (value) ratios as a way to proxy the npv. So I will need to find value ratios that at least incorporate growth. Maybe something like the peg ratio I understood. Anyway, I will study your material. That will surely help the thinking. And I will not forget to include quality. Thanks again
What’s the return if you had just purchased and held all of those ETFs vs SPY?I feel that your comparison should be those ETFs combined, rather than SPY because you’re trying to makea case for rotating the ETFs.