Granted, Google probably is not using quantum computers for investing YET. But de Prado is planning for the future and has a chapter about it in his book: “Advances in Financial Machine Learning.”
Realistically, where are the institutions now? Somewhere beyond the spreadsheet I would say. And some claim the market was efficient before the spreadsheet was developed.
The Designer Models lost a little ground last week—as did the percentage of my investments in individual stocks or ports.
In the late stages of bull markets, comments like these are always prevalent. However, markets are cyclical, and mean-reversion is the most powerful force in investing. You should keep in mind the phrase, “this too shall pass” at all times (because it will).
If you continue to try to use the same old factors that academics (most of whom have never invested a dime of their own in their lives) proposed decades ago – of course, you’re going to have problems! It’s akin to hooking up a team of horses to your new Tesla. However, if you think uniquely and outside-the-box, you can still attain exceptional performance during any phase of the market.
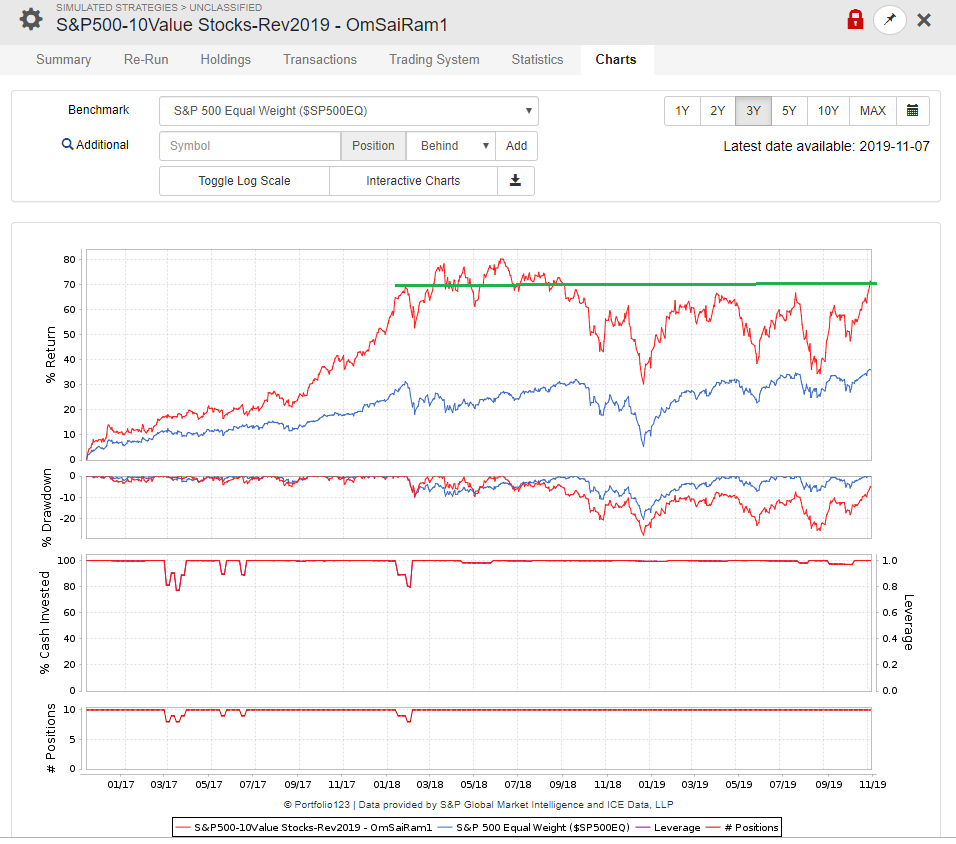
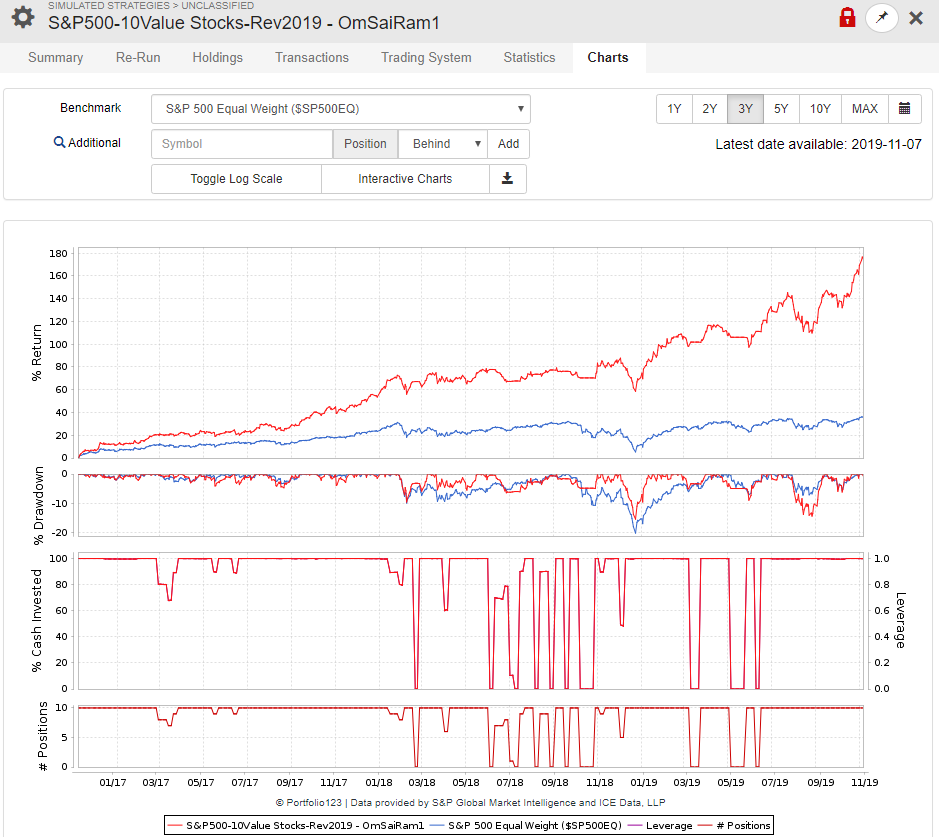
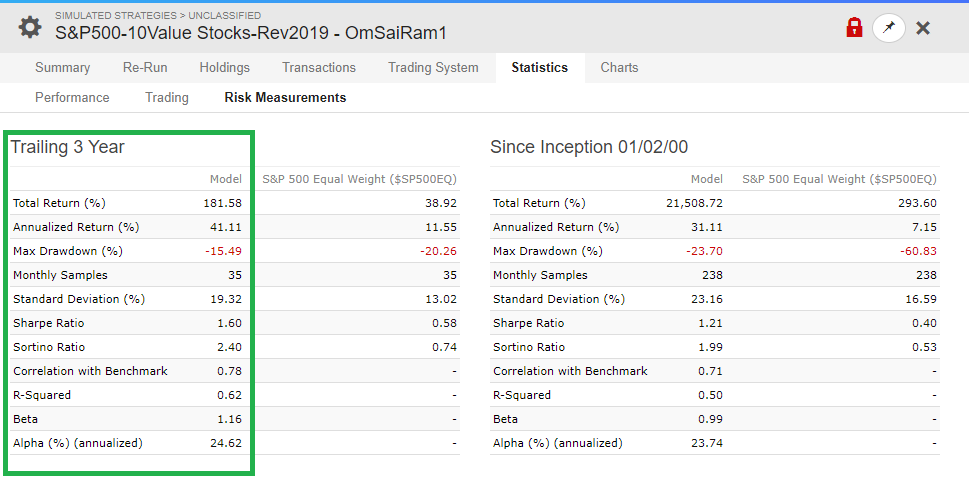
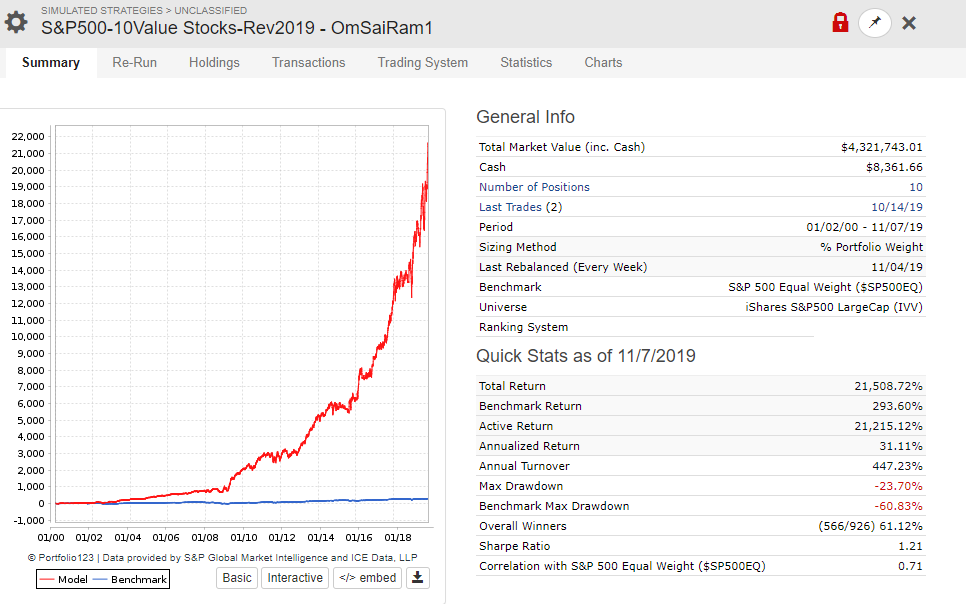
The strategy stats displayed below, from a model I dubbed the “Adaptive Equity+ (2-ETF) Strategy,” has an annualized return of 69% for 2019 with a max drawdown of just -7%:
Since inception before the Financial Crisis, this strategy produces an annual return of 39% with an MDD of -23% (compared to -56% for the benchmark). It was launched in 2006 because that’s when enough higher-performance, 2x leveraged ETFs became available, which this model infrequently uses (only when conditions are exceptionally bullish and stable). The long-term performance since inception would be much higher than 39% had today’s ETF universe been available since the beginning. Nevertheless, this start date does show that it performed great throughout the Financial Crisis; i.e., lost nothing during the downturn, and gained 324% while the S&P 500 spent five years working back to break-even.
In the last two years, the return is 64%, so its performance has been improving in recent years, going against many of the negative themes in this thread. Moreover, the risk is declining, with a Sortino since inception at 2.30 and in the last three years at 3.47.
To get these kinds of returns, you have to take an Outside-the-Box approach: The strategy uses a Universe of 1,637 ETFs selected by Merrill Lynch (Merrill Edge Select™ ETFs) based on an ample volume in the underlying stock holdings, stability, and viability for fund continuity. Market timing and ETF-selection is based on a sophisticated composite employing as many as 38 different data sets with a cross-section of macroeconomic, fundamental, sentiment, and technical indicators.
The model uses seasonality measures that can trigger a switch to more conservative universes and more conservative timing signals during the historically volatile and dangerous summer months and October. A long-only strategy, the model uses no inverse ETFs and when conditions are adverse, it holds two cash-proxy ETFs (BIL and SHY). The average hold time is 33 days or about 1.6 months, requiring only two ETFs to provide ample diversification, so it’s nearly effortless to manage.
Declaring that “nothing works today” is a self-fulfilling prophecy, when in fact, perhaps you only need to look in different places or in different ways.
The investment markets are vast, and as Cramer used to say (is he still on TV?), “There’s always a bull market somewhere!” Today, I’m working on several other unique approaches, such as a ‘Low-Volatility Leveraged Fixed Income Strategy’ that has a return of about 40% and a Sortino of 3.89, a unique Asset Allocation Strategy, a ‘Sector Magic Strategy,’ a ‘Country Rotation Strategy’ and a 15-Technical Indicator composite RS that delivers the signals for a super-aggressive (yet low-risk) S&P 500-based ETF model with an 80% AR, -12% MDD, and a Sharpe since 1999 of 2.54. There are far more unique ideas for effective investment strategies today than there is time to configure and test them!
Think uniquely and stay determined! If you do, you’ll find ways to work around the cyclical premia deterioration issues in classic investment factors like value and momentum (which I don’t use at all). To avoid the problem of factor deterioration, also focus on maximizing robustness and avoid overfitting.
You might also want to test your factor set on an annual or quarterly schedule to determine if there has been deterioration and manually adjust the weightings in your ranking systems accordingly – or build an automated assessment system. Innovate – and get away from the idea that you can build a system once and forget about it forever. The market is a dynamic, evolving organism, and investors must evolve along with it.
P123 gives you all the tools you need to build models that can be successful today, tomorrow, and far into the future, regardless of what the market is doing. But you must be innovative and remain determined!
“Since inception” and “this strategy produces” and “It was launched” imply that you actually created this strategy prior to 2006 and have been using it since. I’m reasonably certain that that is not the case. When posting things like this it’s important to distinguish between backtested (optimized) results and real-money real-time investment results, and words like those are misleading. It would be better to write, “I began the backtest before the Financial Crisis, and this strategy would have produced . . . I began the backtest in 2006 because that’s when enough . . .” It’s better to use the conditional tense rather than the present tense for backtested results.
You do have an edge. Your average one-year excess returns are 2.6% and your 2-year excess returns are 1% (excluding fees). For all of your models that has one or two year excess returns.
Better than any developer I have looked at recently. I am not sure I would spend hundreds of hours to get that, however.
I take the opportunity to mention your results because it is a chance to highlight positive results.
I don’t know why you would say that, Yuval. I have been operating quantitative stock-based strategies since about 1993 if I recall correctly. My first very rudimentary ETF-based strategies were introduced to the public in 1998 when a new website was launched, and more have been added regularly ever since. Obviously, this work pre-dates 2004, when P123 first got off the ground (and when I joined the site). ETFOptimize is a change of monikers that was prompted by a 100% focus on ETFs and giving up on stocks.
Until relatively recently, a lot of this work had to be done off P123, largely using data from other providers, such as CapitalIQ and FRED. I really look forward to the introduction of the API that will allow us to import and use our own data, which Marco announced some time ago. Is there any estimate of when that capability might be introduced? Thanks.
They raise transaction costs and undermine short-term reversals. This means that trading frequency needs to be reduced.
It's a problem, but it's always been there.
In fact, the vast majority of hedge funds are not as good at picking stocks as CORE COMBINATION models.
Thanks to COVID, retail investors are now back in the market. They're not actually much smarter than they were in 2020, but they think they're smarter, and that makes things better. Even though I don't own shares, I hope NVDA reaches a market cap of ten trillion or more. I can't imagine how much money factor investors would make if there could have another 1990s mania.
I recently saw a video by Tom Lee (Not the Drummer), speculating that AI could capture the income of displaced workers and that NVDA could reach $1T in sales. That would make them a $20T company.
If they can be a $100T company, I would be happier because that would make factors much more efficient than what they were in 2010s. The AI bubble would be bigger than the dotcom bubble in 1990s and that's a paradise for factor investors.