Jim,
You have no response to my challenge to present a strategy that the uses volatility-drag to somehow outperform SPY.
All you can do is to pivot into personally attacking me.
Other than the one you already posted here, these are the other 2 iterations you’ve plugged:
Ticker(“XLY XLI XLB XLv”) vs
Ticker(“XLP XLK XLU QQQ”)
Ticker(“XLY XLI XLB XLK VBR”) vs
Ticker(“XLP XLV XLU VIG IEI”) )
Note the XLK being swapped and playing a defensive role in one iteration and an aggresive role in the other.
Thank you all for your contributions, albeit I see the argument has gotten somewhat out of hand.
Thank you for linking to the models, Georg, but I, too, am afraid of overfitting, especially in models where I don’t know all of the criteria. Having said that, the seasonal effect (Halloween) on sectors is a well-documented phenomena. So, while I agree that it is not overfitting, you also have some other etf that is unknown to use in a seasonal cycle.
By the way, I’m extremely impressed with your timing model results, and I’ve attempted to understand it. I’m still not sure if it will work out of the backtestperiod. When was this model created?
Jrinne, I agree that a backtest does not always offer much, but it can provide some hints on models that might work. Do you have a link to someone you believe can work and who can be tested on P123?
mv388158, Yes, I attempted to create some of the models in p123. I don’t always get the same results, but I keep on trying.
I don’t want to trade frequently; once a month is about right, and Im not looking for some extreme returns. Its even enough to have the same as the market but but less drawdown. However, I want to use p123 for an asset class rotation portfolio with a specific hedge function for my stock portfolio. So I’m interested in all of the systems offered on p123 that anyone can recommend. Then its possible to altso test them.
For the time being, I’m looking at these models:
https://allocatesmartly.com/livingstons-muscular-portfolios/
https://allocatesmartly.com/financial-mentors-optimum3-strategy/
https://allocatesmartly.com/taa-strategy-accelerating-dual-momentum/
https://www.cxoadvisory.com/momentum-strategy/
A simple take (start) on theese models:
Papabear:
Buy the top tree
Ticker("VWO VNQ EFA VTV VUG IJT DBC IAU TLT ") // papa
ShowVar(@PAPASCORE,ROC(63)+ROC(126)+ROC(252))
CXO Momentum:
Buy the top tree
Ticker(“SHY, TLT, vglt,VNQ, IWM, SPY, GLD, EFA, EEM, DBC voo”) // CXO
ShowVar(@CXO,Roc(84))
Dual Momentum:
Buy the one with highest momentum
Ticker(“scz,voo,sptl,tip”)
ShowVar(@DM,ROC(21)+ROC(63)+ROC(126))
In this model VOO and SCZ has to bee in positive terrain to be bought. If not buy TIP or SPLT with the highest one month momentum
Optimum 3:
Buy 3 of the top 6 based on momentum, but choose the tree that is least correlated
Ticker(“SPY, QQQ, VNQ, REM, IEF, TLT, TIP, VGK, EWJ, SCZ, EEM, RWX, GLD, DBC, BWX”) // O3
My take on the momentum is the same as PAPABear:
ShowVar(@O3,ROC(63)+ROC(126)+ROC(252))
I have no idea how to program the pick of the least correlated tree og the top 6.
PAPA: PAPABear
DUAL: DUAL
Georg,
I was asleep and have not read all of your posts. Not sure that I will. My apologies if I am not responsive to a good question.
This is not a competition.
It is possible that you might be able to recall that Marchus made the point that strategies with more ETFs do better.
I have agreed with this for a while. Going fully into SPY then to TLT then back fully to SPY simply does not work out-of-sample. Nor do other strategies like that (with too-few ETFs) work out-of-sample.
I simply posted that I agreed and gave 2 reasons why that is true: diversification and reduced volatility-drag which are not really separate reasons. You have better reasons I guess?
XLP, XLV, and XLU just took me literally 15 seconds to find as an example of volatility-drag. This actually occurs pretty commonly even within individual sector ETFs and elsewhere. I stated at the time this is not anything I would use as a strategy to invest in. I specifically used this example because it has nothing to do with any of my models and I assumed people would be able to recognize that.
I also said this at the time:
I am not going to start a backtest competition now because you double-dared me. That would be less than meaningless as Marc has pointed out. I think that it is actually unethical–as did Marc–if you are trying to sell a backtested strategy here on P123. Back in the day P123 would have asked you to stop.
Ethical issues aside, one just needs to go to your designer models to see the problem with overfitted backtests. Debating it in this thread will do nothing to change what anyone can find there on their own. What other evidence could one possibly need?
I guess we could pretend that this time is different. Please be my guest everyone. It is fun pretending that you would have known what strategy would have worked best years ago and imagine how rich you would be now.
The real question is why did putting together XLP, XLV and XLU (fixed in equal amounts) after 15 seconds testing–as an example showing that volatility-drag can affect returns–set you off?
Are you okay?
I might see if there are any questions that address the problems that rotation strategies with too-few holdings have later. My appologies if anyone asked a pertinent question of me that I did not answer.
Jim
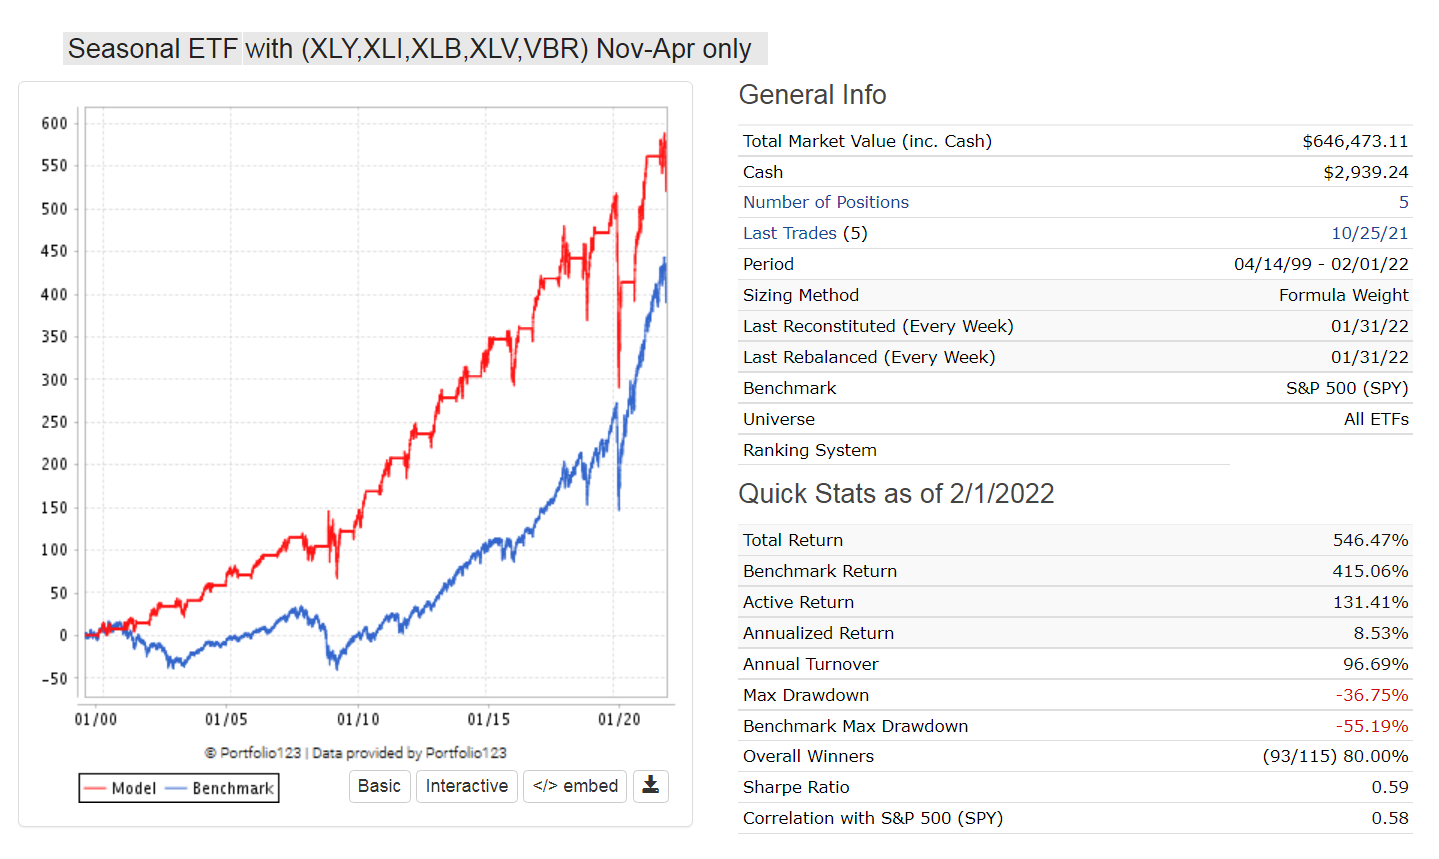
With seasonal timing, slippage of 0.1%, and selecting 2 ETFs with P123 ranking system “ETF Rotation - Basic” and backtest period from mid April 1999:
The first set shows an annualized return of 12.2% with a max D/D= -40%.
The second set shows an annualized return of 13.9% with a max D/D= -35%.
The original set as posted earlier in this thread shows an annualized return of 14.9% with a max D/D= -35%.
Over the same period SPY produced an annualized return of 7.6% with a max D/D= -55%.
What is there not to be liked of the Seasonal Timing strategy, AND WHERE IS THE CHERRY PICKING?
So this is my reply to the question of the thread, and I trust that some members may find this of interest.
Hey there. It’s pretty easy to program this stuff into Portfolio123. Although…without a top level membership I don’t think you’re going to be able to easily select the maximum diverse port or weight the ETFs in a risk parity weighting. You might try Portfoliovisualizer. I pay them also and follow a Accel Dual Momo strategy with their software. It also eats mutual fund tickers, so you can backtest into the 1980’s with VFINX and FOSFX. I replace VINEX with FISMX since I run this system in Fidelity. You can also program the GTAA3 from Meb Faber very easily with Portfolio123.
The term “cherry picking” refers to selection bias. When pharmaceutical firms only publish the results of successful trials and not unsuccessful ones, that’s selection bias, or cherry picking.
In this case, if you choose a handful of ETFs with full knowledge of their performance in certain months and another handful of ETFs with full knowledge of their performance in other months, and then publish that performance as if it could have been foreseen from the outset (1999), you’re clearly cherry picking. On the other hand, if you chose those two handfuls of ETFs based on a neutral rule implemented at the very beginning of your study with no forward testing and then showed that they outperformed, then that wouldn’t be cherry picking.
Thank you, scrichley. I use that system as well, but have you looked at any others that would be of interest?
In addition to TLT, I have included an extra ETF to the system, TIP. Since there is now plenty to imply that there will be high inflation for a long period.
And yes, I do not have access to the backtest simulator. The biggest problem with the screen back test is the forced monthly rebalancing, but beyond that the strategies are so simple that they should be easy to use in p123.
Yuval,
Thank you. Exactly right. You give a medical example.
In medicine the people who do this are often called “optimistic” doctors giving them the benefit of the doubt. That is really what we call them as we try to understand how they could believe in what they are doing.
When you see it in real life it is more like someone tries a drug for a disease on 100 people and all but 3 die. The drug does not seem to work so well. Maybe it made things worse. It is not like this drug will ever get FDA approval but you can give it some continued off-label life.
What do you do? You publish a case report about about how well the 3 people who recovered are doing. We see this type of thing with some drugs that don’t actually have any effect on Covid. That is cherry-picking.
But it is not called cherry-picking in some circles. Rather it is called standard operating procedure or “how to earn a buck.” If you are not in the inner circle there can be a debate as to whether it is purposeful or not.
RK, a terrible procedure, had a bunch of “optimistic” doctors promoting it for a very long time. RK was done with a scalpel and surgeons successfully avoided FDA oversight because a scalpel is already an FDA approved device. Or more accurately it has never gone through the FDA approval process but no one is going to pull scalpels off the market.
I worked with (for) Dr. Waring at Emory University who was a very optimistic and upbeat guy who did a ton of RK surgeries and presented his series and case reports in the literature and when he was invited to lecture. And did their corneal transplants when the procedure failed. He was seen doing RK surgery on CNN and he married the local (young) TV weather forecaster. He is also the author who ended RK surgery with a study showing the negative side effects. But not before he was up and running with his LASIK procedures.
WAIT! Uh…when did he know? When DID he know about RK surgery? He did know; he was the lead author on the study that ended RK…
The point is too many people went blind or generally had an unacceptable level of complications before the definitive study on RK was published and the cherry-picking ended. RK was never a good procedure and those debating how someone could be so “optimistic” already knew not to have RK surgery.
Now with regard to whether one should select an “optimistic” investment advisor with some impressive “case studies”…
Jim
1 Like
Yuval, your comment shows that you have not looked at the seasonal effect in equities.
The seasonality of the S&P 500 is easily verified by backtesting with historic data. The S&P 500 with dividends from 1960 onward returned on average 1.92% for the yearly six-month periods May through October, the “bad-period”. For the other six months, the yearly “good-period”, from November through April, the average return was 8.47%.
In evidence-based medicine, likelihood ratios are used to assess the reliability of a diagnostic test. In finance, likelihood ratios can quantify the reliability of a financial test as well. For example, one can determine the probability of equities performing better over a particular period in the year depending on the outcome of a relevant diagnostic test.
The test period, from January 1960 to April 2019, held 59 cyclical good-periods and 59 cyclical bad-periods for stocks, totaling 118 six-month periods, and showed an average return of 5.20% for all periods.
The positive likelihood ratio is 1.86 with a 95% confidence interval of 1.26 to 2.74; a value greater than 1 produces a post-test probability which is higher than the pre-test probability (pre-test probability is that there is no difference in performance between the two 6-mo periods).
The diagnostic test provides a 65% probability for the S&P 500 to perform better than average from November to April, and a similar probability to perform worse than average from May to October each year, indicating causation, namely that stock market returns increase or decrease due to seasonal effects.
So you want to invest in defensive type of ETFs from May to October, and more aggressive types from November to April. This is not cherry picking because the chosen investment type is based on a rational argument.
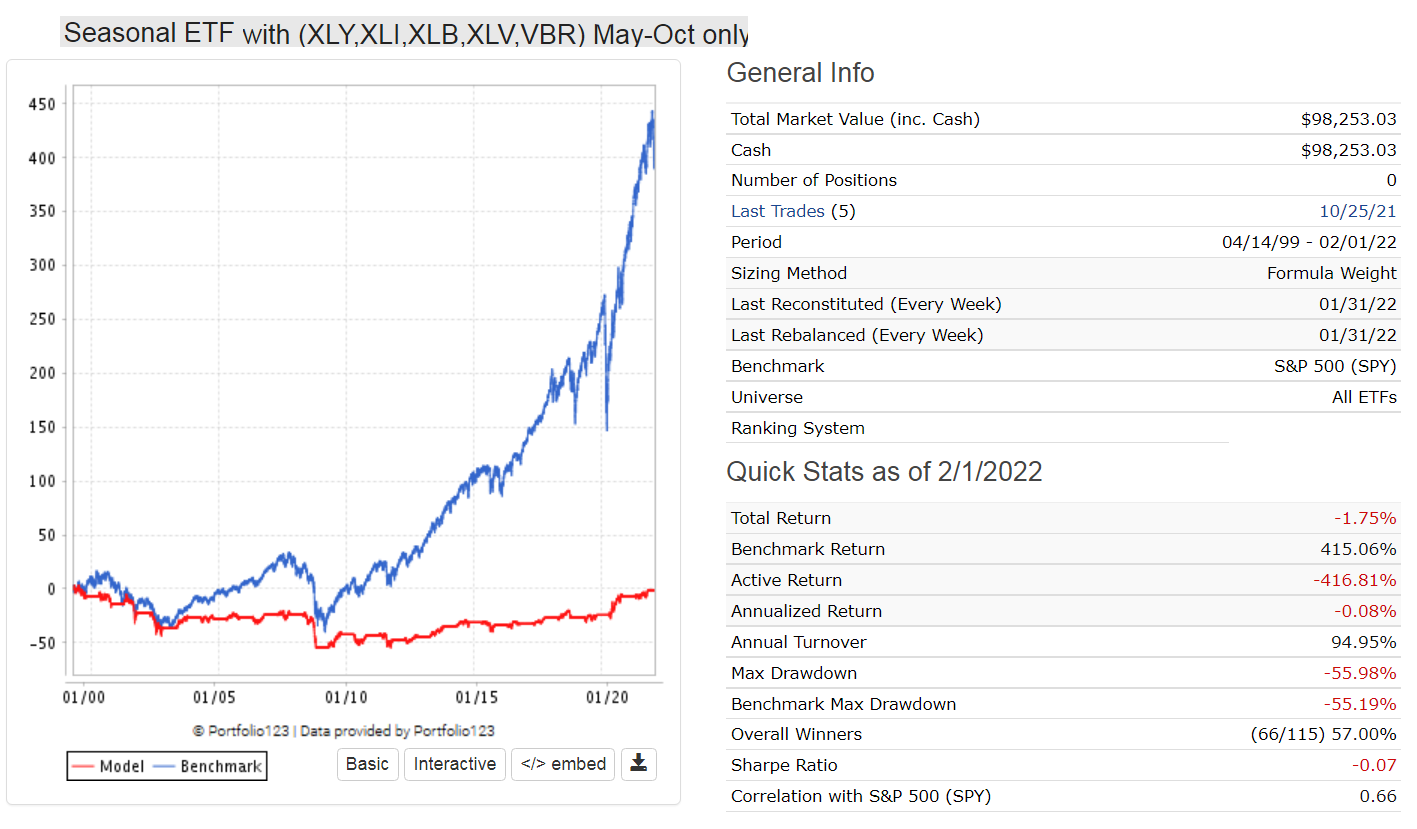
The performance of the same group of ETFs from May to Oct is shown in the second chart below. Over these 6-mo periods it produced a negative return. So it would be foolish not to switch to a more defensive asset allocation during those periods.
You can read more about this here:
Hi Marchus,
The allocate smartly website doesn’t distinguish out of sample from back tested performance which makes it hard to determine how well these ideas work. These strategies will have worse out of sample performance compared to in sample performance due to back test over fitting and/or to the market changing. Consider using a few of these strategies on a portion of your portfolio to minimize timing errors. Jim’s suggestion of holding more ETFs will also minimize an allocation error. There used to be web sites that tracked out of sample performance of tactical allocation strategies but I couldn’t find any with a google search. Can you find any?
Scott
Georg, the point is that you have picked those ETFs specifically because they have that behaviour. My beef is that in various iterations you’ve had XLK in different baskets nullifying this hypothesis. There are other sectors that should in theory behave the same way. What do the backtests look like for them?
Marko, there is a statistical basis for investing in defensive type of ETFs from May to October, and more aggressive types from November to April as I and others have shown.
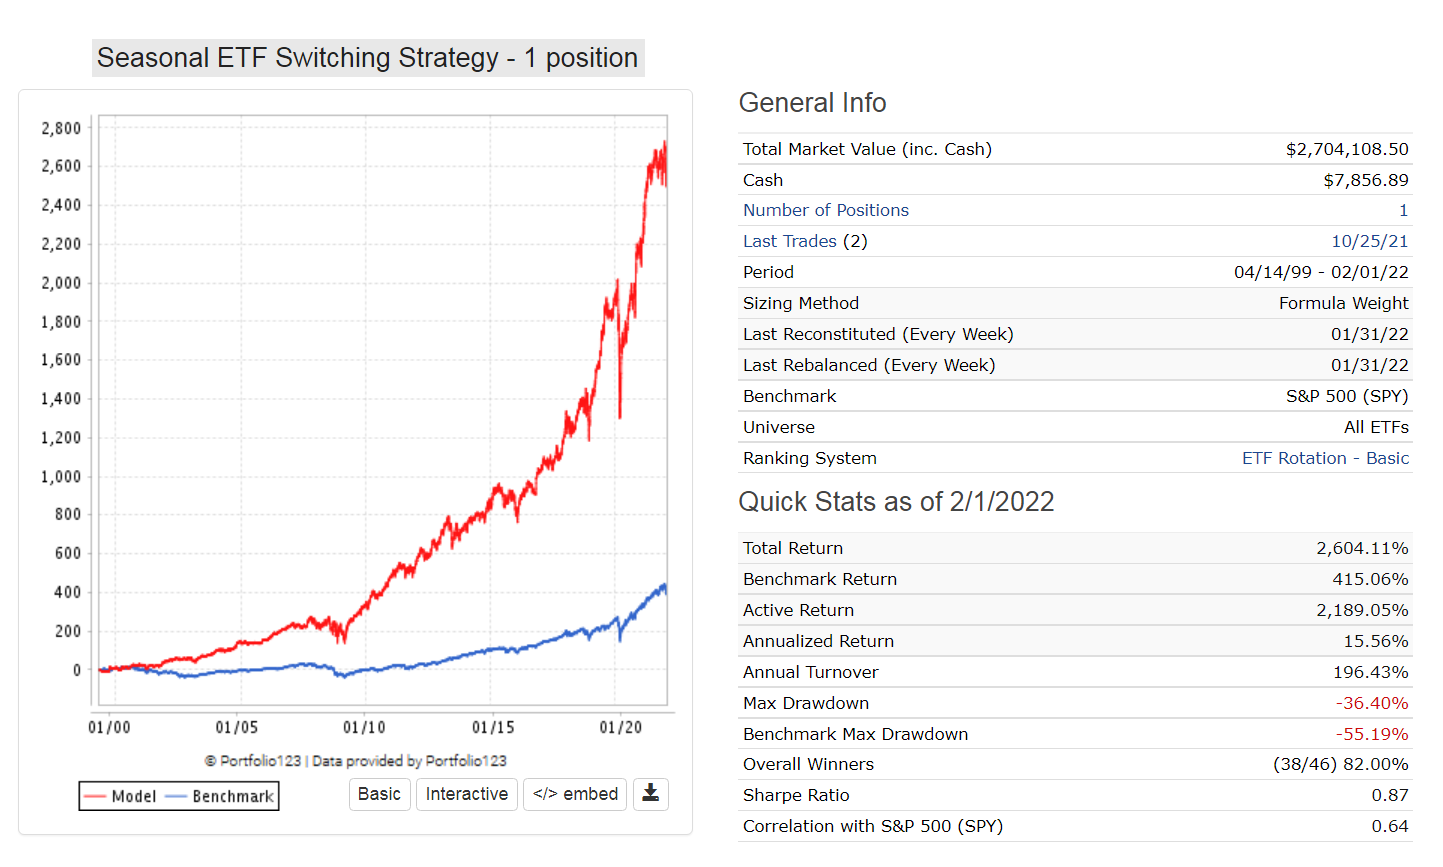
So let’s pick 6 ETFs which we can hopefully all agree on whether they are defensive or more aggressive:
Defensive: TICKER(“XLP,VIG,GLD”)
Aggressive: TICKER(“RSP,XLY,XLI”)
(You can google for aggressive and defensive ETFs and use others if you like.)
Using the ranking system to select only one of them over the 6-mo periods gives you an annualized return of 15.6% with a max D/D of -36% over the backtest period from 1999 as shown in the performance chart below. You can easily verify this yourself.
Marco and Yuval,
Some members give their first name and some login name hiding that they are pros. Probably you do not charge them as pros. Maybe you do not ask maybe they do not tell.
Quite a different story if a pro comes into P123, insults a member because the member has not presented a cherry-picked and overfit backtest himself and while the pro demands that the member do so and the pro links to his professional web site in the discussion (above).
All in order to market a strategy that with absolute certainty could not be called “peer-reviewed.” By someone who will never admit to understanding what cherry-picked, overfitted, or the more general problem–the multiple comparison problem–mean. I think Georg will never get it no matter how hard you might try.
One reason none of this could be called peer review is that the reviewers would force the authors to put the limitations of the study into the paper and in the process the authors have to admit they understand the limitations of the study (e.g., the multiple comparison problem). Otherwise, the reviewers would not allow the article in their journal. Simple as that.
But surely no one can say Georg did not tell us he is a pro. You must be charging him as a pro under your FactSet contract. Georg has made the fact that he is a pro extremely public. It would not be your fault if you were forced to charge him as a pro (assuming you have not done so already).
Marc had solved this I thought.
Jim
1 Like
Cherry picking is almost always based on a rational argument, Georg. That doesn’t make it “not cherry picking.” It’s cherry picking if you’re selecting ETFs AFTER you know their performance.
If you had tested this “seasonal effect” from 1960 to 1998 ONLY and concluded that certain kinds of stocks would outperform in certain months and certain kinds of stocks would outperform in others, you could have then set up a strategy that proved that this effect continued in the 1999 to 2021 period. But that’s not what you did. You looked at the entire period from 1960 to 2019, and then cherry picked ETFs that would prove what you already knew. And then you went back and picked OTHER ETFs in your most recent post, also knowing their post-1999 performance.
Jim is also correct that this forum should NOT be used as a vehicle to advertise your subscription services. I would appreciate it if you would remove links to imarketsignals.com from the forum.
I do appreciate the fact that you have helped a lot of users through the forum and that many of your posts contain extremely valuable information. I do not want to discourage you from posting on the forum. I really appreciate your dedication to the P123 community and to its staff as well. You’ve been enormously helpful to all of us.
But when you post models that rely on post-facto evidence and then advertise your subscription services, you’re altering the forum into something it was never intended to be: a marketplace.
Yuval, thank you for your comments and kind words. I have removed the link to my website and replaced it with the link to Seeking Alpha where the same article was published about 3 years ago. I trust that this is OK. I was not aware that linking to one’s own website was not allowed by P123 and had no intention to advertise my subscription service on P123, it wont happen again.
Regarding the seasonal effect I encourage you to take any of your trading models and run them for each of the 6-mo periods. You will find that the periods Nov to Apr will provide much higher returns than the periods May to Oct.
Also I want to thank you for posting your ranking system “Yuval’s large-cap system”. I remember at the time that Marc Gerstein had lots of negative comments about it. I have found it extremely efficient on the Russell 3000 universe. In my opinion there is no better P123 ranking system.
Yuval, to facilitate testing the seasonal effect on the performance of sims you can use my exposure list “winter_out” and “summer_out”, in cash from Nov-April or from May-Oct, respectively. The lists are good from 1999 to 2030. Please let us know the results of your test.
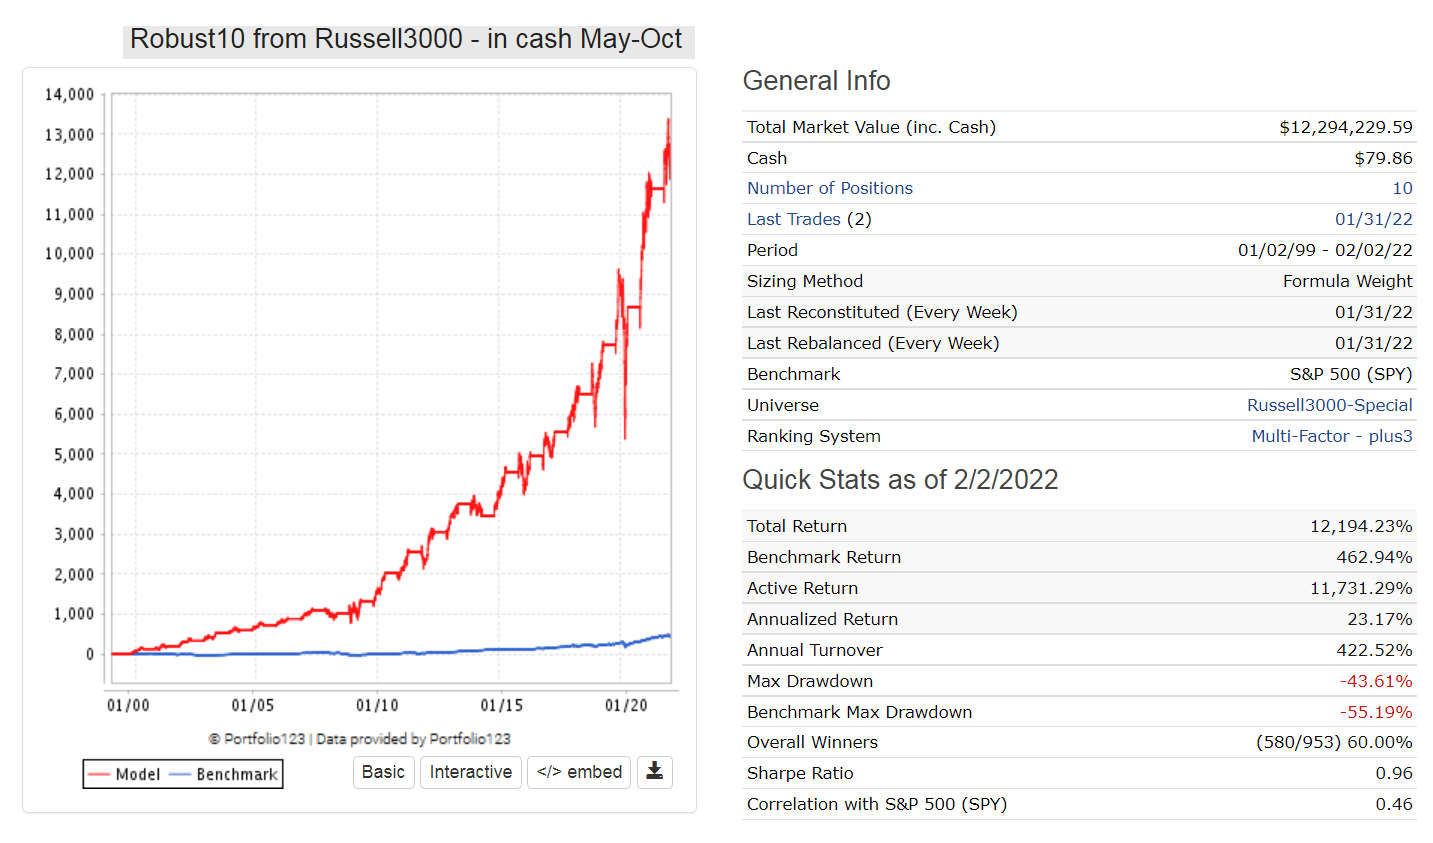
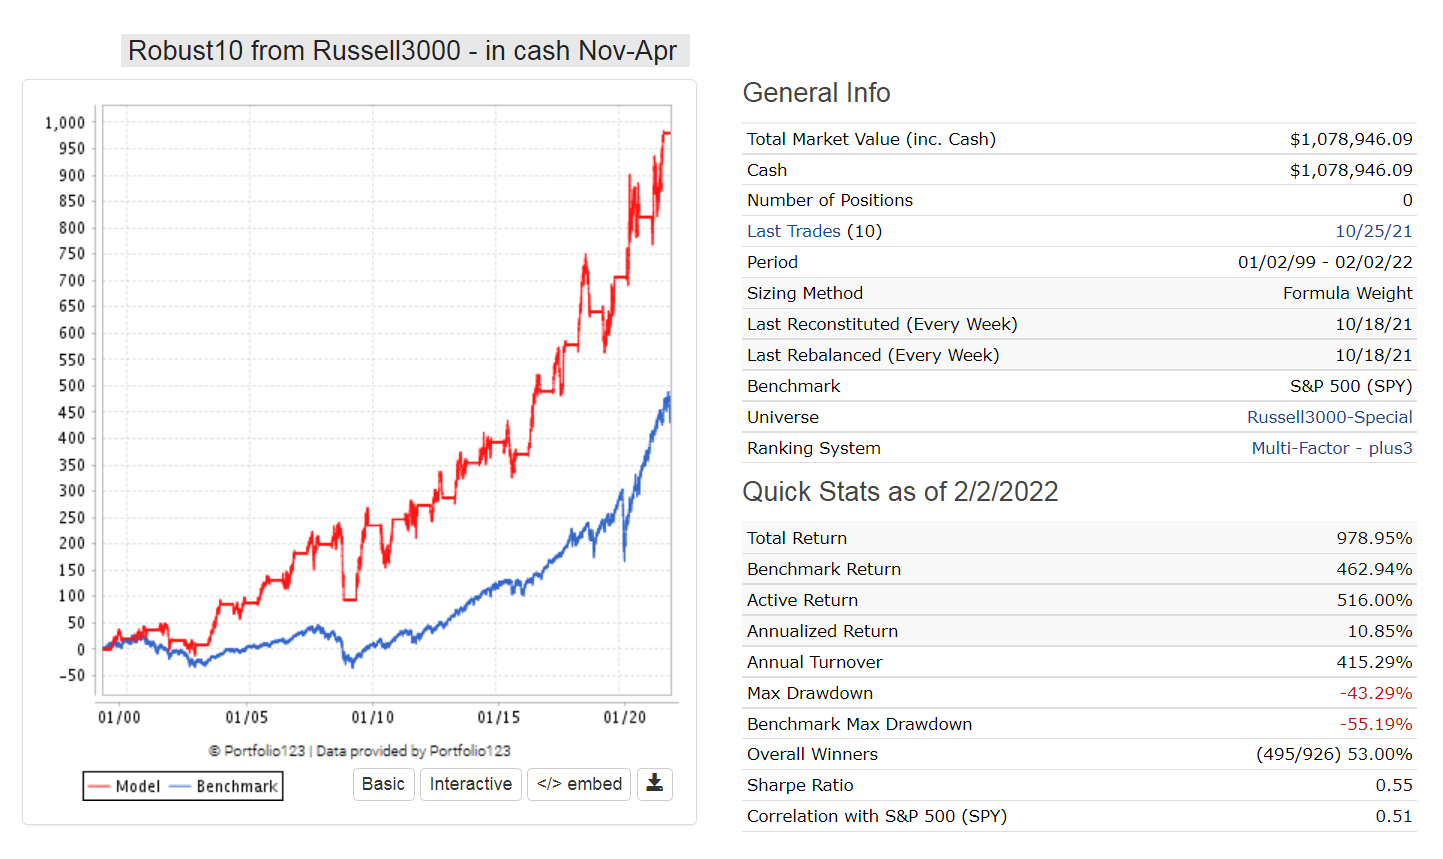
Attached are seasonal performances for the same model Robust10 from Russell3000 (no cherry picking here) which confirm that the winter period Nov-April outperforms by far the summer period May-Oct.
“winter_out”
01/04/99 04/25/99
10/25/99 04/23/00
10/30/00 04/29/01
10/29/01 04/28/02
10/28/02 04/27/03
10/27/03 04/25/04
10/25/04 04/24/05
10/24/05 04/23/06
10/30/06 04/29/07
10/29/07 04/27/08
10/27/08 04/26/09
10/26/09 04/25/10
10/25/10 04/24/11
10/24/11 04/29/12
10/29/12 04/28/13
10/28/13 04/27/14
10/27/14 04/26/15
10/26/15 04/24/16
10/24/16 04/23/17
10/30/17 04/29/18
10/29/18 04/28/19
10/28/19 04/26/20
10/26/20 04/25/21
10/25/21 04/24/22
10/24/22 04/23/23
10/30/23 04/28/24
10/28/24 04/27/25
10/27/25 04/26/26
10/26/26 04/25/27
10/25/27 04/23/28
10/30/28 04/29/29
10/29/29 04/28/30
“summer_out”
04/26/99 10/24/99
04/24/00 10/29/00
04/30/01 10/28/01
04/29/02 10/27/02
04/28/03 10/26/03
04/26/04 10/24/04
04/25/05 10/23/05
04/24/06 10/29/06
04/30/07 10/28/07
04/28/08 10/26/08
04/27/09 10/25/09
04/26/10 10/24/10
04/25/11 10/23/11
04/30/12 10/28/12
04/29/13 10/27/13
04/28/14 10/26/14
04/27/15 10/25/15
04/25/16 10/23/16
04/24/17 10/29/17
04/30/18 10/28/18
04/29/19 10/27/19
04/27/20 10/25/20
04/26/21 10/24/21
04/25/22 10/23/22
04/24/23 10/29/23
04/29/24 10/27/24
04/28/25 10/26/25
04/27/26 10/25/26
04/26/27 10/24/27
04/24/28 10/29/28
04/30/29 10/28/29
04/29/30 10/27/30
Hmm. Not much difference. I’ve been using ranking systems for investing since November 2015. If I’d stayed in cash May through October I’d have made 22% annually. If I’d stayed in cash November through April I’d have made 20% annually. By never going to cash I made 46% annually.
Yuval, interesting. So there is just a small difference, but still the 6-mo winter period produced the higher return.
Obviously you can add the two 6-mo returns 20% + 22% = 42% for an approximate annual return, close to the 46%.
BTW 46% is a very impressive annualized return from Nov-2015 to Jan-2022. I don’t think there is anybody else here at P123 who can match this.
Regarding seasonality in stock markets, here is all the data anyone could ever ask for. If any of you come to any conclusions from it, I’d be curious to know what they are. https://papers.ssrn.com/sol3/papers.cfm?abstract_id=3974178