Do you have more than 60% In your simulator?!

I’ve been working on my own rating system for a while, but haven’t dared to start trading with it yet.
I get the impression that most people here who have a few years of experience achieve from 60-80% annual return in simulator, and in live trading gain 50% to 30% of this. Is that correct? I must have made hundreds of adjustments to my system, but have no chance of achieving such returns in the simulator.

Is there anyone who will publish screenshots of their own simulator result and tell what they expect to achieve in live trading with their system?

Below is mine:

  1. 25 stocks or more
  2. Trying to keep turnover below 350%
  3. As a rule for sale, I have nothing but: Rank<98 and StaleStmt = 0
  4. To make sure the stock can be traded, I use: Mediandailytot(120)>( 70*1000) and StaleStmt = 0
  5. 150 nodes with exactly equal weighting divided into the following factor: 28.23%GROWTH 19.36%VALUE 11.41%QUALITY 11.41% MOMENTUM 13.25%SENTIMENT 4.49%VOLATILITY 11.84%SIZE
  6. Universe is Easy to trade US
  7. Heavy focus on smallcap and lower volume stocks

image

When I do a screen here https://www.portfolio123.com/app/opener/PTF/search with days > 1500 Annual returns > 60%, my stocks > 10, max Turnover < 500, there are very many with good returns, but when I test 150 of them again, with latest dates, almost no one achieves anywhere near what they originally achieved:

image

2 Likes

vary the start and end dates, relax the sell criteria and see what you get. Impressive. do you keep NA - neutral?

Thanks! Im not to sure that it is that “impressive” because I get the impression that many of those who have been here for some time have simulations of 60-80%. ?:slight_smile:

No I have used NA-Negative, but attach a test with ranking on neutral.

Yes, I have tested with different universes and different periods and used " FOrder(“Random”,#Previous) <= x" and “random>.x” without it giving very divergent results, so it may imply that the system is not overoptimized.

But I’m still interested to see what others achieve in their simulations on systems that they’ve ultimately dared to trade live. :slight_smile:

1 Like

In my analysis, most https://www.portfolio123.com/app/opener/PTF/search models had unrealistic Annual Turnover, which was obvious once applying VARIABLE SLIPPAGE and NEXT AVERAGE OF HI AND LOW for price of transactions reduced their return significantly.

Good thread. My two main strategies backtest with a CAGR of roughly 60 & 40% respectively, since 1999. I generally look for outperformance in all years since 1999 (except 2008). Not too interested in max drawdown, but rather positive performance.

I went live with them in early 2020 (about 1 month before COVID!), the live returns to date have been in-line with the sims. That said, the second strategy has been floundering, particularly the last 6 months or so; the next year will be a good test to see how live performance compares with the sims since 1999.

One way to “get your feet wet” is to run your sims live, but on paper only. P123 will select the positions, and if you set rebalance to automatic, it will do so, and you can track how the strategy does live, but without any capital. Getting into a new strat just as it’s in a downswing can be discouraging.

As for the historical list of sims you showed, many of these are/were optimized for the market 2002-2007, or some other bull period. During that time, many more conventional factors did quite well, whereas today they may struggle. For those with 10 or less positions, they would be even further optimized. Several also include timing rules that worked well to avoid the 2008 crisis, but not necessarily to “normal” market volatility. As others pointed out, these also may have no slippage applied, or very illiquid stocks. I too went through the exercise of testing many of these over the full period 1999-today, and found very few held up.

Hope that helps.

Cheers,
Ryan

And if you look at the performance of other factor shops like Alpha Architect or even AQR it looks like it’s generally been “factor winter” for the last ~10 years where big, expensive, non-profitable companies have over performed, and this isn’t uniquely a P123 model problem. It’s difficult to me to conclude if these previous models were indeed over-optimized or if the last regime was truly historically “weird”. (Although, obviously the performances of Yuval and other P123 users show many factor based approaches did work during this time)

It’s really hard for me to provide any real uncompromised out of sample model that I’ve traded with real money over a long time line, because my live models are constantly evolving, adapting and changing over time. I recently scrapped my longest running model and moved the money into a new North Atlantic based model when P123 released European data. Likewise, I would anticipate models being a living thing that evolves over time going forward rather than a controlled statistical experiment. My current longest running model simulates at about ~60% return with variable slippage on the Next Open with weekly rebalance dating back to 1999, and it has outperformed the benchmark (SPY) by ~30% year to date live using real money. In many ways I consider this my most successfull year on P123, even better than years where I’ve had crazy returns, because I always had doubts in the back of my mind what would happen to the model in an inflationary/rising interest rate regime because there was little previous sample to test against since 1999 under those conditions. At least now that has been put to rest (for now).

I have little control over my total return, because those are largely based on larger economic conditions and market headwinds (or tailwinds). However, to periodically check against over fitting out of sample, twice a year and I confirm the previous 6 month performance of the ranking system and see if it’s still maintaining a staircase/dose response structure over 10-20 buckets.

Thanks for the reply! :blush: It helps to hear how the rest of you are doing. I see that in my simulation, "Mediandailytot(120)>( 701000)" reduced my annual return by almost 10% rather than when I used AvgDailyTot(120) >( 70 1000)

What volume rule do you use? And how many nodes do you use in your ranking system?

I ask you the same as rtelford above, what volume rule do you use? And how many nodes do you use in your ranking system? :blush:
You said “my live models are constantly evolving, adapting and changing over time” I was wondering a bit more about your process.

  1. How often do you change your model?
  2. What is it that makes you start changing the model? Is it because it doesn’t generate profits or are there other issues?

For backtesting purposes, quick and dirty, I’ll generally say that 15% average daily stock total should be more than my anticipated average portfolio position. So if my average port position is going to be $20k…

(MedianDailyTot(120) * .15) > 20000.

I’m actually able to trade with less liquidity than this in the real world without effecting slippage too much.

I have rarely scrapped a model for outright losing money. A few times, mainly because I had a thesis that I built a model around and the thesis was wrong, it really had nothing to do with over fitting the model, per se. Or maybe more accurately it wasn’t wrong, I just grew frustrated with it or wanted to put my money into something better. One example is I built an entire ranking around Sin/Vice stocks like tobacco/gambling/booze under the conventional wisdom they would make good defensive hedges against my high flying microcap model. Well, turns out my main microcap multifactor model actually performed even better in the downturns than my “defensive stock” model once you start putting things in like industry momentum. If you have a lot of factors cash flow growth, industry momentum, low accruals the model will just kind of naturally move to whatever industries the economic regime is moving into. I have chased performance trying to build models around high flying themes of the moment, like a cloud industry model. I didn’t stay with it, but it most certainly would have blown up … not because the model was “over fit” but because the entire concept would have blown up. These concepts would also not work if I were buying industry based ETFs or actively researching and picking stocks under the same premise.

The main changes I make are because new P123 keeps releasing new features, factors, markets, etc. that I play around with and want to add. The P123 community keeps sharing new findings. I keep finding better testing approaches. Sometimes I realize those approaches might not be best and take a step back. Like if you’re constantly seeing how successfully you can trade a certain liquidity of stock , you might keep pushing the boundaries of liquidity lower until you’ve realized you’ve gone too far and it’s hard to get out of positions or blowing up the price on the buy. Then you got to back up. Lowering turnover has been a constant theme as I’ve morphed from someone who originally didn’t mind high turnover in order to achieve maximum alpha, to now trying to minimize transaction costs and trading as much as possible. Sentiment factors and price action momentum (and valuations) can really drive turnover. It’s all trial and error, even with live money, and getting to know your temperament as an investor and/or trader.

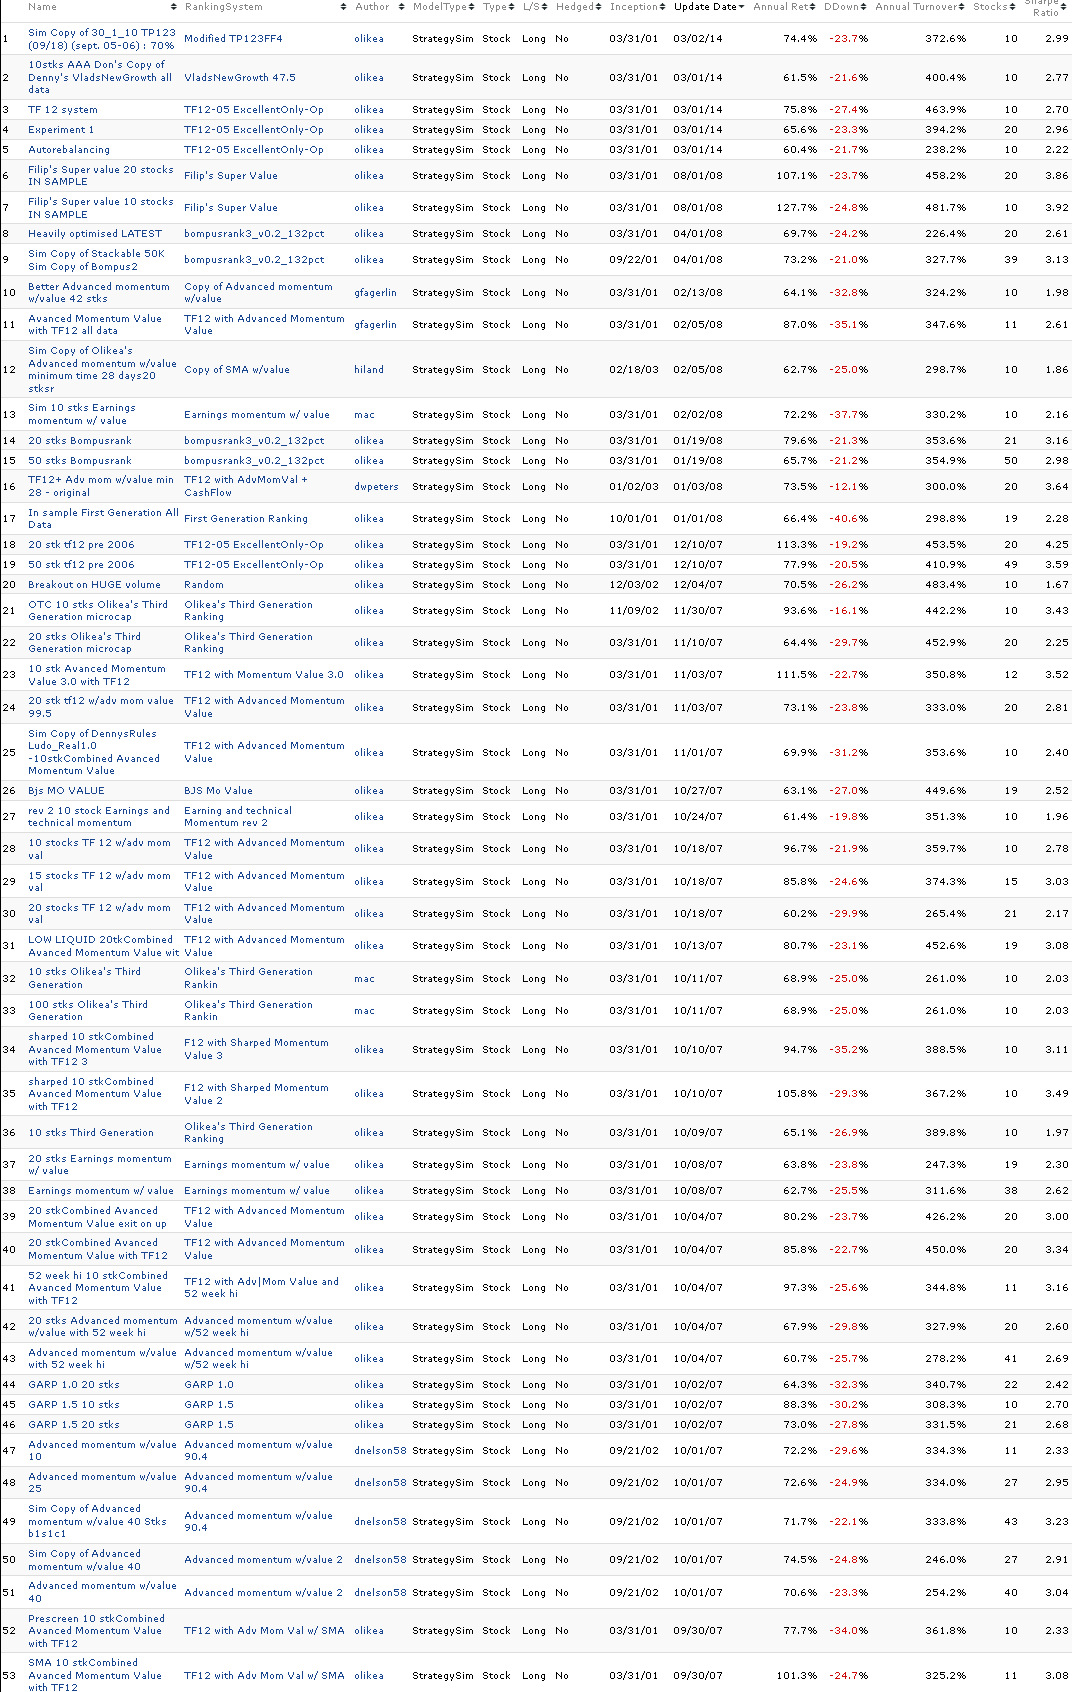
I started out with the same public available ranking systems everyone else starts out at and built my way up. Generally what has cost me money is not overfitting models. It has been poor execution on trades. It has been poor attempts at market timing (both “panic selling” and systemic market timing). It has been not fully exploring and utilizing whatever tax advantage possibilities I had available to me. The compounding effects of slippage and taxes definitely eat away.

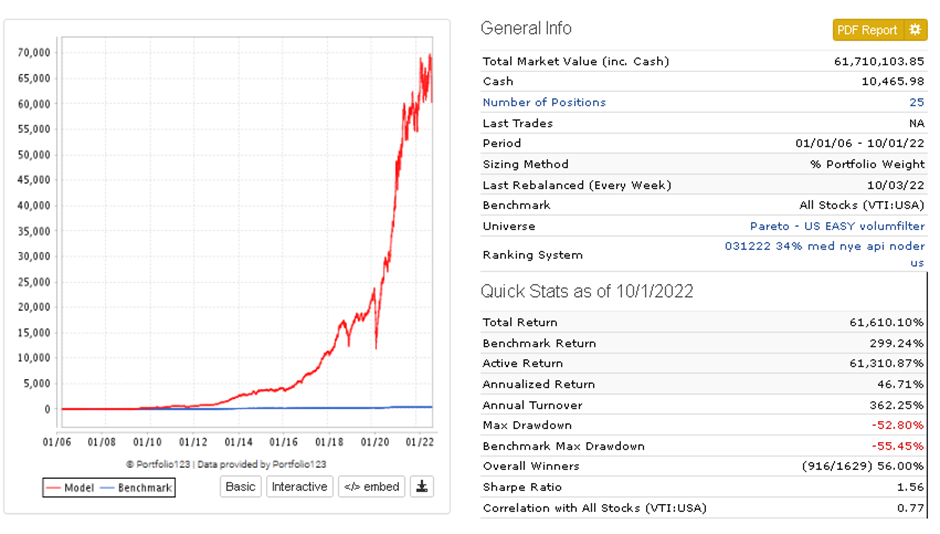
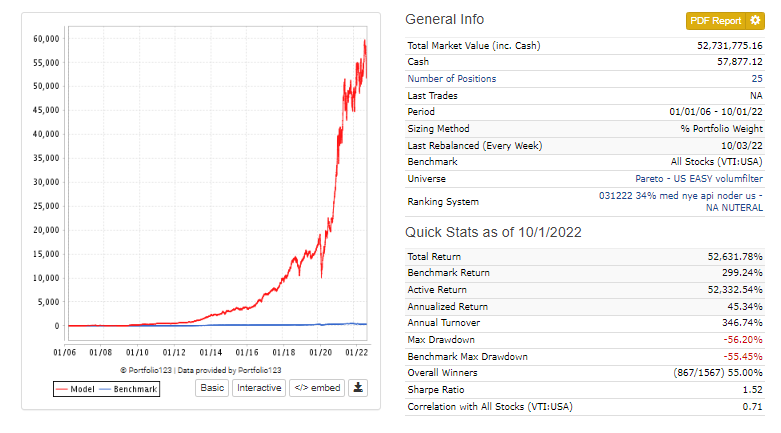
My main ranking system has 3 previous successful ranking systems that I’ve used in real life that I’ve successfully traded all sandwiched together. Each ranking system has about 35-60 factors. I equal weight the three together to give me an average, attempting to get a signal from the noise of what makes a good business. I’m pretty much at the node limit of what P123 allows. If we ever expand node limits, I would like to do more industry specific rankings within the same ranking system. There is a lot of overlap in the factors. Many of the factors are in all 3 rankings, but just grouped in a different way or in composite factors. I’m sure if an actual statistician looked at it their head would explode with all the correlations. But I’m not running an academic exercise or training an ML model off it. I’m just picking good businesses, just like Warren Buffett, I just like my ranking system save me time by going through the fundamentals of thousands and thousands of companies in a few seconds to pick them for me in a systematic rules based way. And I’m extremely satisfied with the results for several years and several different regimes.

I don’t think the annual return means as much as other metrics like profit per trade or what Denny posted " My Buy and Sell Rules"

As many have said Out of sample is all that matters. You could have a great SIM but OS it bombs. Even the best Designer models have horrible years and large drawdowns. Some of the best designer models that are more than 5 years old did horrible during 2018-2020 and now they are doing great. If your model is horrible for 2 years it will be hard to stick with. The problem is you will not know unless you trade it with real money. Start trading it and you will also see what type of slippage you get. If your profit per trade is 2% and your slippage is 1% your real returns are much lower. Someone already mentioned it but the market changes and your system may not work well over the next 2 years.
There might be a recession next year and High Beta stocks will get crushed even more. That does not mean you have a bad system but your timing was off to start using it. So many things to consider I don’t think there is a perfect answer.

Cheers,
MV

1 Like

Fair point. In many cases, performance of these models completely drop off say 2009-today, suggesting overoptimization. For those still chugging, managing at least some return, perhaps not suited to the regime and could bounce back, time will tell.

Agree wholeheartedly that markets are constantly changing. I review my live models often to see what specific factors are still working or not, or if there’s something that should be added to improve. That said, said changes need to have a material impact in sims; I have not changed my live models since early 2020, but have created new live strategies that I believe are suited to the regime at the time, which are more intended for the short term (some very short term, almost day/swing trading only).

I keep volume buy rules fairly straight forward, looking at median daily total over the last 20 days > $50k or $100k. In some strategies microcap strategies, I use a volume based sell rule, at which point where there could be too much volume, signalling most of the alpha is gone from the stock and time to move on to others.

The ranking system of my first main live model uses 50+ nodes, no buy rules, 1 rankpos sell rule. My second main model about 25 nodes, but more buy rules, 2-3 sell rules.

Cheers,
Ryan