ETF Weight Scaling?

Steve, I have used this many times. I am not using a ranking system to generate weights for ETFs. The formula works perfectly well when the weights are specified in the weight formula. The weights don’t come out exactly as specified, especially when rebalancing infrequently, but weekly rebalancing keeps the weights fairly close to what is specified.

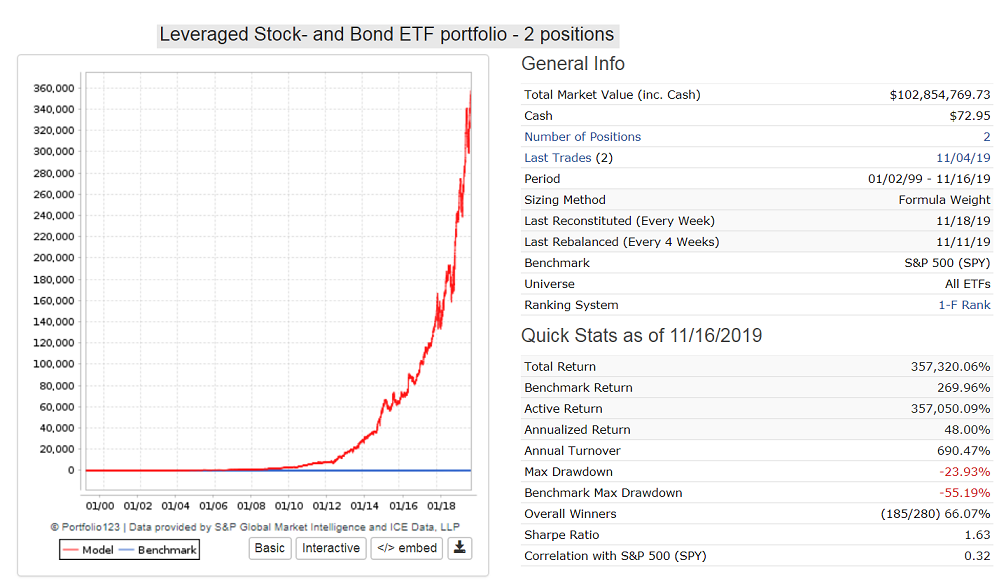
The Eval-function can also be in the buy rules if the ETFs for the various market conditions are not the same. For example, for the ETF sim with an annualized return of 48% I posted in this view-thread https://www.portfolio123.com/mvnforum/viewthread_thread,11966_offset,20
the weight formula is:
3ticker(“SSO”) +8ticker(“SVXY”) +3ticker(“UPRO”)+20ticker(“QLD”) +15ticker(“DDM”)+3ticker(“UBT”)+3*ticker(“UST”)

The conditions are in the buy rule which uses 3 proprietary market indicators ($antivix, $upmarket, $portsum) :
EVAL($antivix,Eval(Close(0,GetSeries(“SVXY”))=NA,Ticker(“SSO,UPRO”),Ticker(“SVXY,UPRO,”)),TICKER(“DDM,QLD”)&($upmarket & $portsum>=5) | TICKER(“UST,UBT”))

The first part of the formula substitutes SSO for SVXY before SVXY became available in the P123 database.

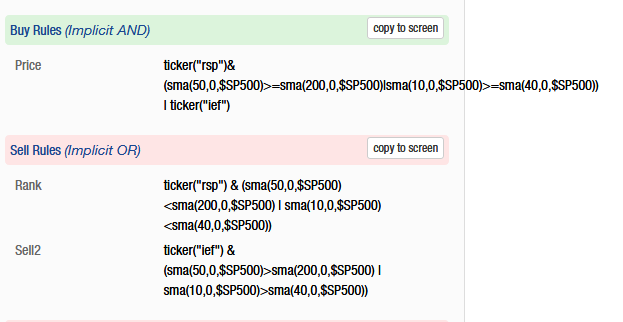
You also need conditional sell rules as well, otherwise the sim does not know when to sell any of those ETFs


OK thanks Georg.

Here is the problem report for future reference.

https://www.portfolio123.com/mvnforum/viewthread_thread,11386#!#65319

It looks as if the ranks passed to the sizing algorithm are “adjusted” from what the RS generated. It can be somewhat subtle and you need to scrutinize every individual weight to make sure it is correct. You are an engineer Georg so i am pretty sure you have done that!

Steve, in the weight formula use “rank”. This will assign higher weights to the higher ranked stocks or ETFs. This improves return a lot and makes sense. Should one not assign more weight to the higher ranked positions?

One of the selling features for this approach was that one could use a ranking system to generate the assigned weightings. But I would expect that the algorithm would use the ranks exactly as generated except of course they should be scaled to add up to 100% if necessary.

Now if the ranking system assigns ETF_A a rank of 5 and ETF_B a rank of 95, would you not expect the weights to be 5% and 95%? Instead, the weights are reprocessed. Yes ETF_B would still be weighted higher than ETF_A, but not 95% and 5%. It might be 66% and 33% or something else.

This is the problem that I have.

Steve, I have never used rank weighting with ETFs. I don’t know the algorithm P123 uses to convert rank to weights. Perhaps P123 can let us know?

Just tested it, rank and weight are perfectly correlated. So there is no problem. See below.


Maybe I’ll revisit this issue. It is always possible that I was having finger troubles. If I can reproduce the problem I’ll republish it.

*** EDIT *** I am just reviewing your most previous post. The problem lies in the fact that if you go to the ranking system module and look at the assigned ranks with the same universe as you are using in your sim, then you get ranks that don’t match the sim. The sim ranks match the weights and that is what you are showing. That is not the issue. The issue is that the sim ranks (and ETF weights) do not match the ranks generated by the Ranking System module. Now it is still possible that I was having finger problems so I will go back and repeat the exercise.

OK - I just went back and tested the original problem and it works correctly now. So the problem was probably addressed sometime in the last year. but was not mentioned on the post for the reported error.

Sorry for the confusion. The world is as it should be.

SteveA

Georg:[quote]
In my opinion, market timing formulas are in principle similar to ranking system for stocks. Evaluating the economic environment with numerous measures is not much different to evaluating the likelihood of a stock performing well with various factors. That is why I don’t share the opinion of many that market timing does not work.
[/quote]
I heartily concur!

The one major difference is the odds. The odds that a stock will increase in price is a little under 50%. The odds that the market as a whole will go up over the next month is over 60% (63%, to be precise). So if you get your stock-ranking factors all wrong, you still have an almost even chance of doing just as well as the market as a whole. But if you get your market-timing factors all wrong, your chance of underperforming buy-and-hold is over 60%. As C. Thomas Howard writes, “since there is a 63% chance next month’s return will be positive, you must correctly forecast at least 63% of the months in order to increase your return relative to buying and holding. Research shows such accuracy in forecasting is very difficult to achieve.” (From his book Behavioral Portfolio Management)

I certainly won’t say that market timing is a fool’s errand or impossible. It’s just that it’s hard to do well, and, in my opinion, riskier than stock-picking.

I also don’t want to say that you’re doing anything wrong, Georg! I’m impressed with your work, and I know that a) you’re doing more than market-timing with your ETF selections and b) the goals of market-timing may be to decrease variability rather than to increase returns. I for one certainly have a lot to learn about market timing. But I did want to point out the difference in odds.

This is all my opinion, and not the opinion of P123. We are committed to helping both stock pickers and market timers here.

Yuval, the odds you quote are correct.

But for people who are not too greedy they can follow a simple S&P500 momentum strategy with equity (RSP) and fixed income (IEF). Nothing spectacular or unknown here. Everybody is familiar with the 50-200 golden cross, and I have added a shorter term 10-40 momentum as well.

Buy1: ticker(“rsp”)&(sma(50,0,$SP500)>=sma(200,0,$SP500)|sma(10,0,$SP500)>=sma(40,0,$SP500)) | ticker(“ief”)

Sell1: ticker(“rsp”) & (sma(50,0,$SP500)<sma(200,0,$SP500) | sma(10,0,$SP500)<sma(40,0,$SP500))
Sell2: ticker(“ief”) & (sma(50,0,$SP500)>sma(200,0,$SP500) | sma(10,0,$SP500)>sma(40,0,$SP500))

P123 ranking system: ETF Rotation - Conservative
Variable slippage
reconstitution and rebalancing weekly
Weight formula = 1

From Jan-99 to Nov-2019 this model shows an annualized return of 14.70% with a max D/D= -19.0% and Sharpe= 1.41.
Standard Deviation 8.73% vs 14.40% for SPY.

It would never have had a loss over any of the 20 calendar years. If one ran a fund based on this simple model you would have made a lot of money, because I don’t know of any fund manager doing better than this. Also there were only a total of 155 realized trades in this 20-year period.

That is why I don’t share the opinion of many that market timing does not work. You can add this model to your Portfolio123 Models lineup, if you wish - it will not disappoint, a lot less riskier than stock-picking.

year … return %
1999 … 6.27
2000 … 14.39
2001 … 11.26
2002 … 14.62
2003 … 39.39
2004 … 12.16
2005 … 17.94
2006 … 15.82
2007 … 10.61
2008 … 24.90
2009 … 16.65
2010 … 13.52
2011 … 3.46
2012 … 11.79
2013 … 33.48
2014 … 8.26
2015 … 11.34
2016 … 8.84
2017 … 15.36
2018 … 11.62
2019 … 11.04


Georg -

I tried to replicate this but got crap. See below. What am I doing wrong?

  • Yuval

Screenshot_2019-11-22 Simulated Strategy Trading System - Portfolio123.png


Yuval,
I made visibility public. No need to hide it - I have much better models than this in my lineup.
Also, I reduced number of trades by holding RSP for at least 3 weeks because of the odds you mentioned.

https://www.portfolio123.com/port_summary.jsp?portid=1590919

Thanks, Georg! I see my error now: I had “Allow Immediate Buyback” set to “No” instead of to “Yes.” Silly me!

Happens to me as well. Then one wonders why one gets nonsense.

BTW, look at my 5 pos small-med cap sim (MktCap > 130 and <1,800 and Price > 2). It uses some modified buy rules from your Small Cap Winner screen rules, which you recently posted. Uses, apart from the main ranking system, three other P123 ranking systems, two of which require the buy rank to be higher when my “$comp” market timer signals down-markets for stocks. Perhaps, this is another way to use market timing successfully.

Eval($comp<50,Rating (“Core: Sentiment”) > 75 ,Rating (“Core: Sentiment”) > 35)
Eval($comp<50,Rating (“Core: Quality”) > 65 ,Rating (“Core: Quality”) > 50)

This model shows an annualized return of almost 70%, max D/D= -32% (with Andreas’ market timer), and reasonable turnover of 490%. From Jan-2004 to Nov-2019 the initial investment of $10,000 goes to $43.6-million, with variable slippage.
I will launch it soon as a DM so we can watch it.


Hi Geov,

Thanks for providing an example.

What does " | " mean in your rules (it’s not listed in the P123 syntax)?

Thank you

Scott

Hi Scott,

I am sure someone will correct me if I am wrong. But it seem to mean the same thing as it does in python. It means “or” (actually the “bitwise or”) and it will give you the union. Just like “&” is the bitwise “and” that gives the intersection.

-Jim

“|” stands for “or”. It is useful when a rule is very long - one can then shorten it with “|” and “&” symbols.

For reference the Small Cap Winners screen is here; https://www.portfolio123.com/app/screen/summary/232655

Good that you posted it again.
BTW all the ranking systems used in my Small Cap Winners sim are public or have been posted in the forum. I changed nothing in them.
Attached are trading stats.
Note that Total Trading Cost / Ending Market Value = 8.5% which comes from variable slippage.


Georg, I appreciate your posting these ETF models. I have not used market price trends for timing but the results you show, with the elimination of online commissions allowing greater turnover, makes me take notice.

In duplicating your RSP versus IEF model using crossover timing, I rewrote your buy rule in a way that should be equivalent but the results are not nearly the same. Can you, or someone else, point out why these rules are not equivalent?

Your buy rule:
ticker(“rsp”)&(sma(50,0,$SP500)>=sma(200,0,$SP500)|sma(10,0,$SP500)>=sma(40,0,$SP500)) | ticker(“ief”)

My rule that is meant to be equivalent:
Eval((sma(50,0,$SP500)>=sma(200,0,$SP500))|(sma(10,0,$SP500)>=sma(40,0,$SP500)),ticker(“rsp”),ticker(“ief”))

I equate your buy rule to a generalized statement like:
ticker(x) AND (truth OR truth) OR ticker(y)

and I equate mine to a generalized statement like:
Eval((truth) OR (truth), ticker(x),ticker(y))

To me, both forms should be equivalent but the resulting transaction dates are very different. Please, what am I overlooking?