=MAX(PORT1:PORT13)/ABS(MIN(PORT1:PORT13)) and compared to =MAX(BENCH1:BENCH13)/ABS(MIN(BENCH1:BENCH13))
For 52 week returns in excel, I used:
=PERCENTILE(PORT1:PORT52,0.97)/ABS(PERCENTILE(PORT1:PORT52,0.03)) and compared to =PERCENTILE(BENCH1:BENCH52,0.97)/ABS(PERCENTILE(BENCH1:BENCH52,0.03))
For 3Y returns in excel, I used:
=PERCENTILE(PORT1:PORT156,0.94)/ABS(PERCENTILE(PORT1:PORT156,0.06)) and compared to =PERCENTILE(BENCH1:BENCH156,0.94)/ABS(PERCENTILE(BENCH1:BENCH156,0.06))
This is great. But rather than prescribe metrics which are “predictive of OOS performance”, I think it may helpful to elicit your intuitions regarding what sorts of things shouldNOT work.
I’m asking you all to frame your ideas in terms of refutation because while we can never statistically be certain that any given system will work in the future much like it would have worked in the past, we can easily estimate the likelihood that is not working as intended. I.e., Science.
Thus:
[]At what point should we admit something is not working?
[]What are the indicators that something is not working?
[*]What are some things we expect and/or know not to work? (…and how can that be used to hone in on what is actually going on?)
Here is some Haiku for a few of my core intuitions about performance indicators:
While all data counts
Recent data matters more
Don’t ignore the tails
Fair results in sample
Exceed even eye-popping backtests
When the story fits
Factors are fickle
Are they trending or reverting?
Which ones are in style?
Discount statistics
Except when they result in
Unique Information
Logic fundamentals:
Statistics can prove nothing
Refutation is key
Valuation models
Built from first princples
Are likely robust
Yes Primus - I use backtesting to look at what a sim might have done in the past and will reject the backtest if it doesn’t look or smell right. I believe there is some factor persistence that can rub off into the future. But choosing a system based on backtest results is an art, not a science. We should therefore not get worked up over which rearview indicator is the best as none has dibs on future performance.
Interesting paper, Miro.! The results of the study are noteworthy but keep in mind this was done over a relatively short period of time ~5 years in pretty much a bull market.
I certainly will be looking at the Omega Ratio more closely.
I see from your link that you may have developed some of my aversion to OLS linear regressions based on your use of Kendall’s Tau and Spearman’s rank correlation. If so, I definitely understand. All I can recommend is take it one day at a time and as a fellow previous addict please feel free to call any time;-) But, in truth, slipping off of the wagon and using a linear regression on something that is non-linear may not be as much of a problem as I once thought.
The above is an example where I am now less interested in whether it is statistically correct but instead just want to know if it works as a stock picking method (as a machine learning tool). I think this general method is likely to work well. It should have the robustness of a “Decision Jungle” I would think. I have not looked much at the specifics of what you are doing with this.
Using machine learning might even extend to selection for ranks and factors. People in machine learning loosen some of the statistical assumptions. For example, they might use a linear regression knowing the “target function” is not linear. In fact, at times they know that TRYING TO FIND THE SHAPE OF THE TARGET FUNCTION IN-SAMPLE WILL LEAD TO OVERFITTING. Using a simple regression: linear, or a nonparametric regression is accepted even knowing things are not linear. Indeed, with 100% certainty using too many polynomials to get the perfect fit will lead to overfitting and poor out-of-sample performance. Hence the end of my days with the statistics police.
I do tend to want to get the statistics right when I finally test what I have done. I do this separately and for me personally it is KISS. But for the machine learning process anything that works can be used as far as I am concerned. And for machine learning the only thing that is certain is that it will never be perfect. Working for the machine learning police is much less demanding.
This is interesting. But I don’t understand the main concept behind it. At first glance, it seems like a strange idea. If you had two strategies that got the same return, you’d choose the one with a higher standard deviation. Following this idea, the bigger the tails, the better. I like my returns smooth and steady. Don’t you? Doesn’t following this strategy privilege the system with the most outliers? The system that’s least predictable?
I must be fundamentally misunderstanding this. Please help.
On further examination, I don’t find the results of the study particularly meaningful as there is no discussion of benchmark, a factor that should be integral to both the in-sample and out-of-sample data. If one is to compare systems, then either the benchmark for both systems must be identical, or the performance measurement must be relative to the benchmark. As I stated in an earlier post, the only meaningful benchmark (in my opinion) is one created from the custom universe from which the stock picks are drawn from. I haven’t used the Quantopian platform but I suspect the benchmark(s) do not conform to my requirements.
On the positive side, the study does hint at testing for property transference from IS to OOS. In other words, if your performance measure is risk-adjusted return, then one should be looking for an improved risk-adjusted return in the OOS versus the benchmark, and nothing else. Here at P123 we have a tendency to judge various performance measures (Sharpe, Sortino, Calmar, etc) against each one another. But what are the criteria for judging the best measure on OOS data? For example, it wouldn’t make sense to judge risk-adjusted return IS based on the OOS criteria of total return or vice versa. So I think we need to change our mindset, and instead of asking the question “Which is the best performance score”, turn it around and ask “is there some level of transference of properties from IS to OOS and to what extent? And how much persistence can we rely on, assuming a decay over time?” If it turns out that there is some level of transference from IS to OOS then the designer can decide what properties he/she is designing for. i.e. improved risk-adjusted return, low beta, etc.
Nonparametric statistics do not assume normality and reduce the effects of skew and outliers among other benefits (and potential problems). The Friedman test, used in my post above, is an example of a nonparametric statistic. So I use (and misuse) nonparametric statistics at times.
I like the Omega ratio too. But it is the opposite with regard to skew and outliers. The full impact of the outliers is in the Omega ratio statistic. That is one of its most highly advertised characteristics. It does not assume normality, however, and is like nonparametric statistics in this regard.
Yuval introduced me to the Omega ratio and to “An Introduction to Omega” by Con Keating and William F Shadwick: From this article: “It therefore omits none of the information in the distribution ….” None of the information including the skew and the effect of the outliers (as well as kurtosis).
Maybe you do not like outliers or their effect in you analysis. You might use medians, nonparametric statistics, or more generally, robust statistics. Maybe you use something else.
If you do want to understand the full effect of the outliers and of any skew then the Omega ratio might be considered as one statistic to look at. And it may tell you things the nonparametric statistics do not reveal.
For those who invest in OTC stocks or microcaps where a few stocks can have extreme upside-returns the Omega ratio might show the true benefit of those ports. Something that could be missed by looking at the median or nonparametric statistics alone.
Which statistic/method is best may depend on the situation. The statics may even reveal a different story at times.
I think there are two ways to compare IS and OOS performance measures. One is to compare the same performance measure between IS and OOS periods. One might find, for example, a low correlation of Sharpe ratio, an even lower correlation of Calmar, and a higher correlation of information ratio, all on the same data and same periods. The other way is to compare to “actual performance,” or CAGR. You say this doesn’t make any sense, but it does for me. What I am hunting for is the risk-adjusted performance measure that will best correlate with (i.e. predict) actual OOS performance, because actual OOS performance is what I’m shooting for. I don’t care about the standard deviation of my returns if it doesn’t correlate to my total returns. (If it does, though, I do care.)
So the question is - why would you score based on risk-adjusted return (or any of the variants) in an attempt to achieve the best total return OOS?
What would be palatable for me is to theorize the following:
(1) the risk-adjusted return demonstrates some propagation from IS to OOS (taking benchmark into consideration)
(2) risk-adjusted return in OOS translates statistically into higher long-term absolute returns (not adjusted for risk).
I won’t try to tackle number (2)… perhaps it is a statistically sound postulate, but not being a statistics expert, I won’t speculate on that.
What is important however is (1)… Does the risk-adjusted return propagate from IS to OOS to some extent? If it doesn’t propagate then (2) is irrelevant. This argument holds whether we are talking about Sharpe, Sortino, Calmar, Information Ratio, etc.
What we don’t know is to what extent factors and performance scores propagate fro IS to OOS and how long that propagation will last. Nothing can be proven mathematically and empirically would take one hell of a study sample size.
However, all this being said, even the study refers to “machine learning” outperforms other measures. Thus we can conclude that:
(a) there is likely some propagation from IS to OOS but to what extent we don’t know
(b) there is likely some decay in performance over time hence the need for machine learning
(3) this entire activity of creating a forward-looking score is not a “science” but an “art”. If it were a science then there would be a definitive solution which immediately dissipates due to overuse/market efficiency. The alternative is to believe that due to IS–>OOS propagation, the art of forward-looking score is open to the possibility of combining factors and optimizing strategies. No one can prove mathematically either way
How well any of this will work depends on how many good models there are out there.
If most of the Designer Models are good then a t-stat of 2 is likely to find you a good model. We know this because throwing a dart is likely to find a good model if most of the models are good.
If there are only a few good models a t-test of 2 is likely to find you a model with no value at all. There will be about 12 false positives out of 259 models setting the t-stat at this level. And some of the good models will have a bad start and be showing a t-stat less than 2 early on. The majority of the models with a t-stat of 2 will be poor models when good models are rare.
So, as far as short paragraphs to sum it up. Hmmm…… I am working on it.
The good inspector makes some valid points. Here is my perspective, though perhaps I’m using flawed logic.
There is a positive correlation between in-sample and out-of-sample returns. No matter how you slice the dice, if you take fifty strategies and run them over two distinct periods, there will be some degree of correlation of the results. The strategies that perform better over one period will be more likely to perform better over the other period than the strategies that perform worse. The correlation, however, may be quite low. This is true no matter what performance measure you use, as long as that performance measure is somewhat correlated to CAGR.
There are lots of different ways to measure performance. Some of these methods have better “persistence” than others. The information ratio is more persistent than the Sharpe ratio, which is more persistent than the Calmar ratio. In other words, the correlation, in a fifty-strategy study, is going to be stronger for some performance measures than for others. The information ratio of the returns of the two periods is going to have a higher correlation than the Calmar ratio.
Most risk-adjusted performance measures adjust for outliers in one manner or another. They may do so by dividing returns by standard deviation, or discounting beta, or using median measures, or taking into account distribution of returns. In doing so, they may be MORE predictive of OOS CAGR than plain CAGR. In other words, their correlation, in a fifty-strategy study, may be higher to OOS CAGR than in-sample CAGR is. The underlying aim of a risk-adjusted performance measure is often to be more robust than a simple measure like CAGR or average returns.
Now if there’s a fundamental flaw in my logic, I would really like to know what it is. It’s a problem I’ve been puzzling over for years, and if you poke a hole in my logic, I will be very grateful.
This must be generally true, I think—without trying to identify all of the reasons this is correct. And if it is correct for many reasons: all the better.
Can you asses risk without considering probabilities?
These metrics do look at risk but they all do more than that. If you have a t-stat of 5 or higher using Parker’s method with the information ratio or the Shape ratio that is a pretty good indication that the model has something about it that makes it outperform. Being truly good, any outperformance will likely persist.
The total return should correlate too but some measures are designed to look at the probability that it is a good model directly.
I use the Sharpe ratio and information ratio as an example only because they can be easily converted to a p-value. An insight (albeit an incomplete one) into the probability that the model is good. I like the Omega ratio (and other metrics) too. In fact, the Omega ratio is a “weighted ratio of probabilities” at at certain value of return. Your odds of success are right there in that one number. I would suggest that this is one of the reasons this is a good metric. And one of its potential strengths is that it makes a full accounting of the outlier’s effect (and of skew).
One thing to consider is that many models are just white noise. You can have the best speakers in the word but if there is no signal they will not do much for you. You cannot turn static into The Rolling Stone’s Greatest Hits even with the best speakers in the world.
Finding just static on a channel may say nothing about the quality of your speakers (or the receiver).
Likewise, if a metric does not seem to be working we might consider whether there is a signal in the data. There probably is but it may be faint at times. One metric may be better at finding the signal than another but don’t expect to find Beethoven’s 5th Symphony on your road trip through Wyoming. It doesn’t matter how good the radio is.
When there is a strong signal most radios will be able to find it.
Forget OOS for a second. What’s the preferred metric for measuring a strategy’s/manager’s alpha/skill via in-sample (“historical”) performance?
Now, how does this metric fair at predicting OOS performance? If the answer is at least “decent”, then that’s the best answer.
Given many choices of indicators and timeframes, there’s close to a 0% chance that the most performant one historically will be the robust performer gong forward.
But seriously, what metric(s) do(es) the investment community most widely accept as an indicator of alpha or skill?
Typically Sharpe ratio is used. But following Morningstar, you can almost bet on the best performer in the previous year coming in last in future years It’s almost a guarantee. However there is (or may be) some predicitve power in following certain money managers (Templeton and Buffet come to mind) but how do you quantify that? P123 has the additional complication in that we are able to “harvest” models by tossing out the models that don’t perform and keeping those that do. A designer cannot be measured by viewing one model or a few selective models, but the entirety of his/her work.
One thing is clear. Of the first 3 choices IR will reduce the noise from market fluctuations. And will be helpful in making any analysis stationary.
The IR functions much like a paired t-test when used as Parker suggests and will give significant results MUCH QUICKER (paired to the benchmark).
Even without using the IR to get a t-stat (as Parker has suggested) the IR seems to be a better metric. It is one thing to have poor Sharpe ratio or CAGR Its is quite another thing when the CAGR or Sharpe ratio is poor while the market is rallying. How the market is doing is reflected in the IR.
Yuval, has some excellent posts and links to the Omega ratio. Yuval has more experience with this but it is clear that with the benchmark mean (or median) as a hurdle–or perhaps modified in other ways—it too can address the market noise problem.
I will leave it to others to discuss Jensen’s Alpha.
What am I missing? Is there mean reversion observed among Morningstar funds? References?
Jim,
The omega ratio is interesting because its like a non-parametric form of a Sharpe ratio. It says nothing, however, about an investor’s preference for any moments of the distribution. Do investors even have preferences?
I would like Yuval to jump in an discuss what he has done with the Omega ratio. If you do a Google Search his name comes up as much as the original developers it seems. And if I may sort of give my take, he has done a lot with the Ultimate Omega which is a machine learning tool for picking models/ports, I think. I will let him speak to this but as I have said above it should not be judged purely in terms of statistics.
I might even suggest that he trademark the name. And if he cannot trademark the Ultimate Omega that he might start calling it the Taylor—[blank to be filled in].
But in terms of statistics it is a “relative likelihood” according to one of the papers on this. And using my words it is a “likelihood ratio.” The likelihood of gains over the likelihood of losses.
This says little about its usefulness other than some of this can be judged in statistical terms.
Anyway, I think that if you compare 2 models OVER THE EXACT SAME PERIOD it can say lot. Comparing 2 different models over different periods—especially if one model has a longer out-of-sample period–it becomes hard to make comparisons.
More simply the ratio is useful to the extent that “the probability weighted ratio of returns above and below the partitioning” is useful. This is from one of the original papers. Perhaps this is not important for the market but I sure want to know this before placing any other kind of bet.
I think I will look at the simple Omega ratio in the future. It is easy to calculate—as Yuval makes clear in one of his papers. I am more equipped to defend the IR as I have used the IR extensively.
To further answer your original post on this: I think it is the IR in conjunction with Bayesian statistics that I find most useful (based in part on what I have used and have experience with in the past).
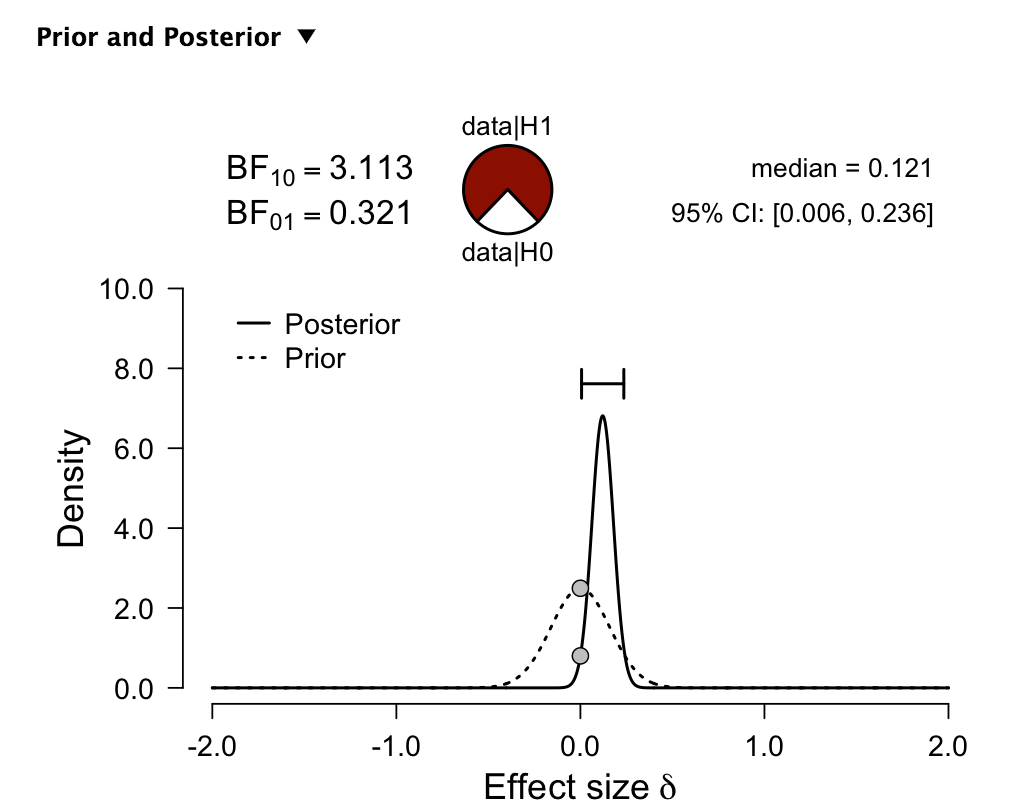
So with this model (image of output below) I use a prior centered around zero. Note that the effect size is the same as the weekly IR (not annualized) in the example. This model has a Bayes Factor of 3.11. Meaning the hypothesis that the model is different than the prior is about 3 times more likely that the hypothesis that it is the same as the prior. The prior is the dotted line and the posterior is the solid line. This can be A LOT DIFFERENT than what you get looking at a p-value alone.
This is also a type of likelihood ratio.
The p-value has many problems: I mentioned 2 above. The use of Bayesian statistics with a prior address the multiple comparison problem and many other problems.
The multiple comparison problem can be addressed classically as I did above with the “Rainbow ANOVA” above. But you would have to keep track of all of the models you have tried in the past an include them in the analysis. Something I cannot do and have no intention of attempting in future.