Interesting. I’ve been using commas and if there’s a space within the ticker field, I get an error;
2020-01-27,IBM ,1
Interesting. I’ve been using commas and if there’s a space within the ticker field, I get an error;
2020-01-27,IBM ,1
let me check that. Thanks Walter
Folks, you’re not reading the specs.
So Georg, the date format you’re using is fine because we support it, but we recommend YYYY-MM-DD. CSV files all have commas (CSV stands for comma-separated-values). If you save an Excel file as a CSV file it will show commas instead of tabs or boxes. Walter is right: 2020-01-27,IBM,1 will work fine, but if there’s a space in there, it won’t.
Also, RTNL, if you’re using Excel and putting the values in different cells, don’t put the commas in, they’re put in automatically when you convert the file from Excel to CSV.
Oh, so that’s why spaces make an error;
2020-01-27,IBM ,1 becomes 2020-01-27,IBM,1
Walter
thanks guys - spaces were the issue
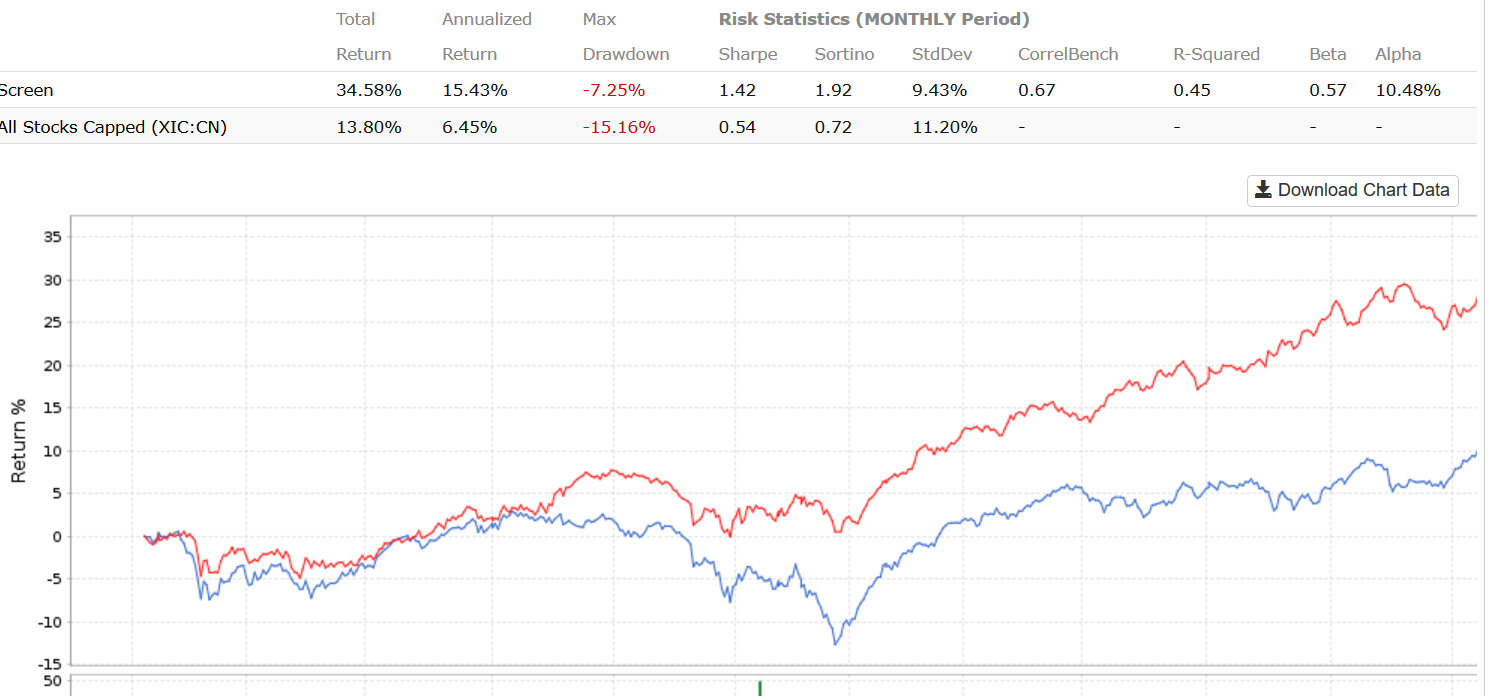
I really like this feature. This is the top quartile of a blackrock ETF using one of the stock p123 ranking systems. The annualized return of the ETF is <10%
Aaron, it does not look as if this has been implemented yet?
What works now:
Sell on weekday= 5
Buy on weekday= 6
Georg, it looks like your data set doesn’t implement Walter’s approach. The data should have inserted on Saturday and Sunday in order for the data to be observed at the same time. For the date in question, it should either be on 2012-12-29 & 2012-12-30 to be observed on 2012-12-31 or on 2013-01-05 & 2013-01-06 to be observed on 2013-01-07.
An alternative approach would be to use a single date for each holding period (e.g. 2012-12-31) and import a “0’s” spreadsheet followed by a “1’s” spreadsheet, where the second import would overwrite the 0’s for the symbols which don’t drop out with 1’s. As always, the “0’s” data derived from the “1’s” data by shifting the dates forward by one holding period (without subtracting a day this time) and replacing the 1’s with 0’s.
Aaron, thank you for looking at this.
I checked and found that using Walter’s method and your rules:
Sell on weekday= 7 (Saturday)
Buy on weekday= 1 (Sunday)
gives identical returns to:
Sell on weekday= 5 (Thursday)
Buy on weekday= 6 (Friday)
Both rules result in trading on Monday.
That is good to know because I am getting excellent results by using the “piggy-back” strategy on various base funds with the excellent Ranking Systems from P123.
Also, it would help a lot when uploading a csv-file into a stock factor that the duplicate entries are automatically deleted while parsing the data.
P123 Team,
Stock Factors are a tool to import historic holdings of an ETF or other fund into P123 and use this in stock strategies.
The problem is that P123 only recognizes ticker symbols which are current and delisted symbols which are designated as TICKER^year when they became delisted.
So when a delisted stock is in a CSV upload file without the appended “^year” one gets an error message “Security could not be mapped: TICKER”
Then one has to search for the year when this stock got delisted. I recently tried to upload a file and got over 100 such error messages. Now I have to find the ticker symbols that P123 recognizes for those stocks.
That is just too much work to make the Stock Factors useful. I suggest that P123 posts an excel file of all delisted stock symbols since 1999, together with the historic symbol under which the stock traded. This surely cannot be too difficult to do?
If we had such an excel file one could quickly do a VLOOKUP to find the correct symbol that P123 recognizes now.
Here is a list, good to Aug-06, which I found on the internet, but we need a listing to 2020.
https://web.archive.org/web/20120211024956/http://www.codehappy.net/charts/delisted_stocks.txt
Does this help? It’s a list of all delisted stocks along with their current symbols. Almost all the time the previous symbol will be in there if your lookup tool is smart enough.
You can get this list by going to https://www.portfolio123.com/stocklookup.jsp, typing ^ in the symbol box, and checking Any in the Status line.
inactive stocks.xlsx (1.21 MB)
Yuval,
Thank you, this is extremely valuable and make the piggyback task much easier.
I didn’t know it would be so easy to extract this. I have modified it a bit so one can do a VLOOKUP on columns A and B.
inactive+stocks GV.xlsx (1.71 MB)
I am combing the threads but cannot find an answer to my question. Sorry if it has already been asked.
Is there some way to reference a custom imported data series in multi-charts or macro charts? I would like to look at my time series data with a benchmark and then incorporate it in a market-timing system. I realize I can reference it in a screen and simulation using getseries function.
I’m afraid not. It’s a grand suggestion, though. I’ll see if we can’t get that done at some point.
Can you call a data series from an aggregated series? (I never tried as I do not use data series)
If you can, then you can later plot your aggregated series in the multi-chart.
So that would mean:
First, create a formula to avoid the double quote problem $MyData as Close(0,GetSeries(“your data series”))
Second, your aggregated series would be:
line 1 : UnivSubset(“IBM”) // limit iterations. Any valid ticker will do
line 2 : setvar(@myplot, univavg(“true”, " $MyData"))
Let me know if this works,
Jerome
When I run the search for delisted stocks as enunciated by Yuval, I see 22,487 companies listed! That’s list is more than 3-times the number of stocks currently tracked in the P123 database! That’s a LOT!
Is this correct???
Chris, yes, that is correct.
That’s phenomenal. With 22,487 stocks that have been delisted since 1999, that’s 1,071 stocks removed per year.
With about 8,400 stocks tracked at any given time by Portfolio123 in the ‘All Fundamentals’ Universe, that’s nearly 8% of all companies delisting every year, from mergers, acquisitions, bankruptcies, and more esoteric reasons. Of course, there would also need to be about the same number of new companies listing because the database has stayed pretty
I’m wondering, does the ‘delisted list’ include penny stocks that wouldn’t make it into the P123 database for ‘All Fundamentals’ or ‘All Stocks?’ In other words, are some (or many) of the stocks listed on that page stocks that were never included in the P123 Equity database?
Well, Chris, it’s complicated. When a company changes something fundamental about itself, it gets a new ticker symbol. So, for example, SMMT was an ADR and isn’t an ADR any more so there is now an SMMT and an SMMT.2^20. Summit Therapeutics was never actually delisted. So that count is off. The same thing can happen when a stock goes from OTC to NASDAQ or vice-versa.
But every stock there was at some point an active stock in the “All Stocks” universe.
n