Hi,
Very good discussion. When it comes to factors, what’s most important to me is what’s working now. Trying to pick a bottom in a factor trend is almost certain to be as difficult as trying to picking a market bottom. Not that there isn’t value in utilizing something that is at an historic low, but I find it simpler to just go with the flow of what’s working.
I have a few portfolio’s set up simply to monitor the performance of several ranking systems for comparison, so that I can see what is working now. Combining this idea with Filip’s, it wouldn’t be too hard to create portfolio’s to track single factor ranking systems based on each of the top 30 or more factors. Then the factors could be easily compared in the portfolio view. As a silver member I do not have the extra rankings or portfolio’s available to do this. Any gold members want to try this? I wonder how the top 5-10 factors ranked by 6 mo performance 6 months ago, would have done this year?
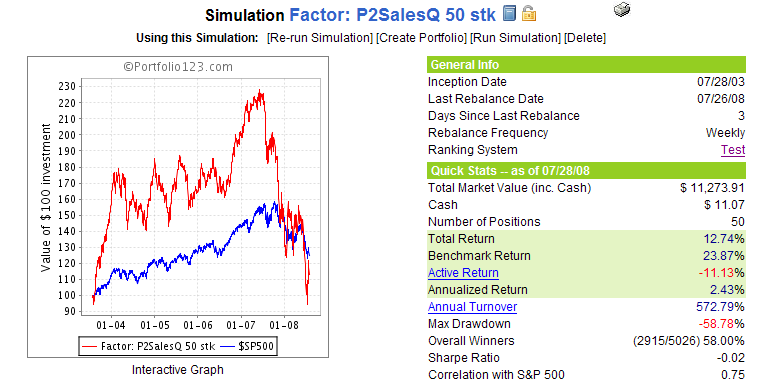
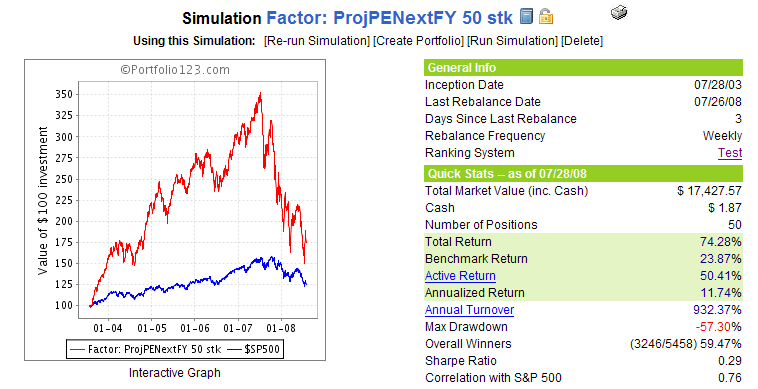
As an example, following is a sim based off a P2SalesQ ranking, and another based off ProjPENextFY, something that seemed to be working well in 2007. Apparently this factor is not working so well now either.
Both sims used weekly rebalancing, rank < 101 as a sell rule, and buy rules: AvgDailyTot(50) > 100000, mktcap > 100 & Close(0) > 1.
I had thought about using the % of stocks as well but it required just an additional iteration in excel. I always use min price>1 and liquidity above 100000, so the total universe is about 4500 stocks instead of the +8000 if you do not use the filter.
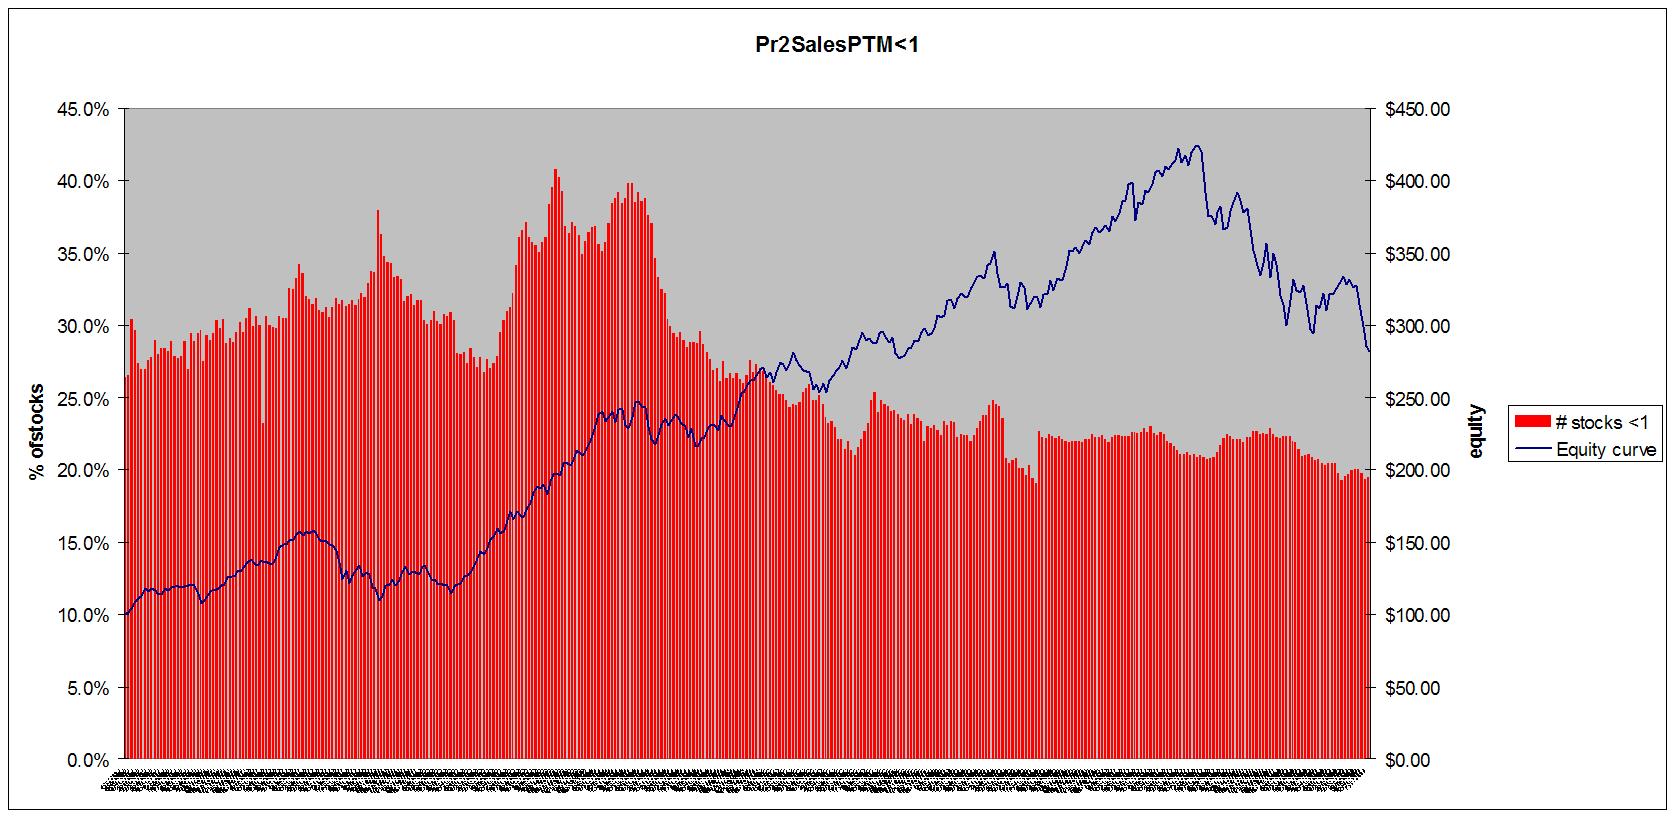
I decided to apply the same approach to another factor Pr2SalesPTM<1 which also shows big run-ups followed by deep declines. I now added the equity curve as per the screener to better identify the linkages. The graph is basically available in the screener but because the formatting is set to a small size it is difficult to really “read” it in detail.
This factor tells a different story. It shows that despite the declines the % of stocks below 1 is still very low. The lowest point was achieved on 7/31/06 at 19.1%. At 7/14/08 the % of stocks stands at 19.5%. This probably means that sales versus PTM have been declining quicker than price and therefore the value is not there. I read today the same argument for the S&P 500: The PE for the index has actually risen while the index declined as the earnings have declined faster than price.
I must admit that as we are looking at relative value within a universe, I did not follow the absolute levels. I wish Portfolio123 would offer more tools that offer readings on an aggregated level like the absolute evolution of a factor’s value for sector X or industry Y or universe Z. That way we can better evaluate the absolute “value” that is offered in additon to the relative value.
I don’t understand why you used Pr2SalesPTM instead of Pr2SalesTTM in your latest chart. If I understand the chart correctly, the value for the number of stocks whose Pr2SalesPTM <1 that is plotted at the right end of your chart is the value of Pr2Sales for 1 year ago. If you had used Pr2SalesTTM < 1, then the value at the end of the chart would be the current value. The way I would interpret the chart is that it shows the effect the equity curve has on Pr2Sales 1 year later. This seems backwards to me. Am I missing something?
You are right in that TTM would be a better choice, but I had found that the PTM version is a stronger single factor with a nice upward slope in the ranking performance graph. Can’t really understand either why that is as you would think that the TTM version would be better. Maybe for this exercise it would indeed be better to focus on current values as we are trying to evaluate the current state of valuation.
The best way to dynamically and mechnically discover factors that generate positive alpha is through regression analysis. It is time to have this function available to the user here.
Great thread. I know of a specific quant long only manager that explicitly uses factor momentum. They forecast factor returns based on R-squared of the factor (relative to expected return of a stock) and acceleration of explanatory power (momentum of factor return). There was a thread a while back where a user requested regression tools. The request as I recall was generally dismissed as it would lead to over-optimization and the data mining problem, which is a real concern. However, there is a clear application of factor momentum which should be quite easy to impliment (don’t have to turn P123 into a statistics package) which would provide basic regression (multiple regression as well), R-squared, and T-stats. One could easily envision developing a factor momentum strategy with these tools. If it is good enough for a large, multi-billion $ institutional money manager, it is good enough for us. I am going to request basic stat tools as a feature request. They can be powerful, used in the right way.
Price to Book and Price to Sales (combined with financial strength criteria) have been working well in retail. It hit a tough stretch in 2007, but has since rebounded nicely.
I would guess it’s not coincident with the top of the market. If you took all the stocks chosen by this screen in the period that it was negatively correlated, and then adjust each for volatility. I wouldn’t think there would be any indication of added alpha (after figuring in for risk for bankruptcy, etc.).
I’m guessing this to be the case because this screen picks up on largely oversold, low-priced stocks. Low priced stocks are more volatile than average, so given the trend of the market, I would suspect “factor reversal”.
You could possibly figure some of it out by looking at the distribution of price and sales… or just assume price is lognormal and then deal with sales. Then normalize both (I don’t know if this is outside the abilities of this service). this could eliminate any shifts in annual returns as a function of the distributions.
     Markets are embedded in the emergent socio-political-economic fabric. This is the "hidden variable."  It's no wonder that factors reverse and styles drift. That's built in.

    [Math talk: The data is non-stationary]

    As a trader the question is what to do about it.  One possible solution: (1)  Keep a good variety of simple, non-curve fitted systems that backtest well. (2) Determine overall market direction. [I use SMA X-over and patterns]  (3) After a major turning point whatever system is out-performing since that turning point will continue to outperform.

    [Math talk: Regime changes are marked by major turning points.]

    On a personal note:  I deeply appreciate the well thought out contibutions you'all are making, especially Denny & Olikea.

    "Live long and prosper"  -- Bill