Judgetrade - I have a custom universe of approximately 170 stocks. I started with the constituents of the SKYY ETF then added more stocks from there. I’ve been researching these stocks for about a year. They are mostly high-growth s/w stocks.
You define the custom formulas in the P123 custom formula module.
It looks like cloud-computing is starting to have a meltdown
Let’s look at what these factors are actually doing rather than judging them on “performance.”
Abs(CurFYEPSMean) / Abs (CurFYEPS4WkAgo). This would rank stocks that had an EPS estimate of -0.13 four weeks ago and an EPS estimate of -0.01 right now very low. A stock that had an EPS estimate of -0.01 four weeks ago and an EPS estimate of -0.13 right now would be ranked extremely high. Is this what you want?
Abs (NextFYEPSMean) / Abs(CurFYEPS4WkAgo). If you want to compare next year’s EPS estimate to this year’s EPS estimate, why would you compare it to what this year’s EPS estimate was four weeks ago rather than to this year’s EPS estimate today? And once again, using Abs in the numerator makes no logical sense.
It’s always important to judge factors on their logic BEFORE judging them on their performance.
As for their performance, if you run a 10-week ranking test on the PRussell 3000 excluding stocks with a price under $3, rebalancing every four weeks over the last 10 years, the top decile gets 11.1% with the formula #1, 11.0% with formula #2, and 10.2% with formula #3. It gets 12.7% with formulas #1a and #2a and only 8.3% with formula #3a. (I numbered and labeled the formulas above.)
Using top decile (or quintile) minus bottom decile (or quintile) over max period rank performance both of these are highly statistically significant with t-scores greater than 4.
You might check the last 5 years, however. But then again, you might want to check all of your factors over the last 5 years.
BTW, this is what Zacks does in their screener. I do not use Zacks but any reputation they may have is based their handling of earnings estimates.
Edit: To expand slightly if you read Modern Portfolio Theory and Investment Analysis (9th Edition) this would fall under “event driven” market changes.
This equation just ensures that there is a relatively new (a month or less) event: a recent improvement in the consensus estimates. The equation also addresses the magnitude of this change. I do not think it is about growth. It is about how efficient the market is or how quickly it adapts to the new information—with earnings being a proved market driver.
The academics still have not decided how quickly the market adapts to this new information. Nor am I prepared to make any claims about the last 5 years.
So the first question is: How are you handling N/As Are they set to neutral in the ranking system? Otherwise a top decile versus bottom decile may be a meaningless analysis.
I don’t have any experience with FactSet’s estimate data so I am going to base these comments on my experience with the previous data vendor. My comments are as follows:
historical data was not Point In Time. i.e. the estimates were spilling over into Monday morning and the data was being overwritten. Therefore, the most recent week is untrustworthy.
GIven that the most recent week is not PIT, you have to avoid the most recent week. The formulae (CurFYEPSMean - CurFYEPS4WkAgo) / Abs(CurFYEPS4WkAgo) and (NextFYEPSMean - NextFYEPS4WkAgo) / Abs(NextFYEPS4WkAgo) are not valid as PIT backtests.
You have to modify the formulae to the following: (CurFYEPS1WkAgo - CurFYEPS4WkAgo) / Abs(CurFYEPS4WkAgo) and (NextFYEPS1WkAgo - NextFYEPS4WkAgo) / Abs(NextFYEPS4WkAgo)
Backtest results:
using the original formulae on the PRussell3000, 5-Year RS performance with weekly rebalance, ignoring the fact that the results are probably not PIT… Only the bottom decile provides usable results. There is no monatonic increase in buckets. This likely means that an extreme negative change in earnings estimates may forecast lower stock prices ahead. However keep in mind that this may not be PIT and this may not be exploitable.
using the modified formula (avoiding the most recent week), there is no useful advantage.
Zacks determines which analysts give the best ratings and then they look for an increase in earnings estimates from those analysts specifically, immediately before the earnings report comes out. This info is used in the Zacks rating. We don’t have this ability using P123.
The last 5 years are interesting but I would prefer not to live in interesting times. I cannot add much to what you illustrate here.
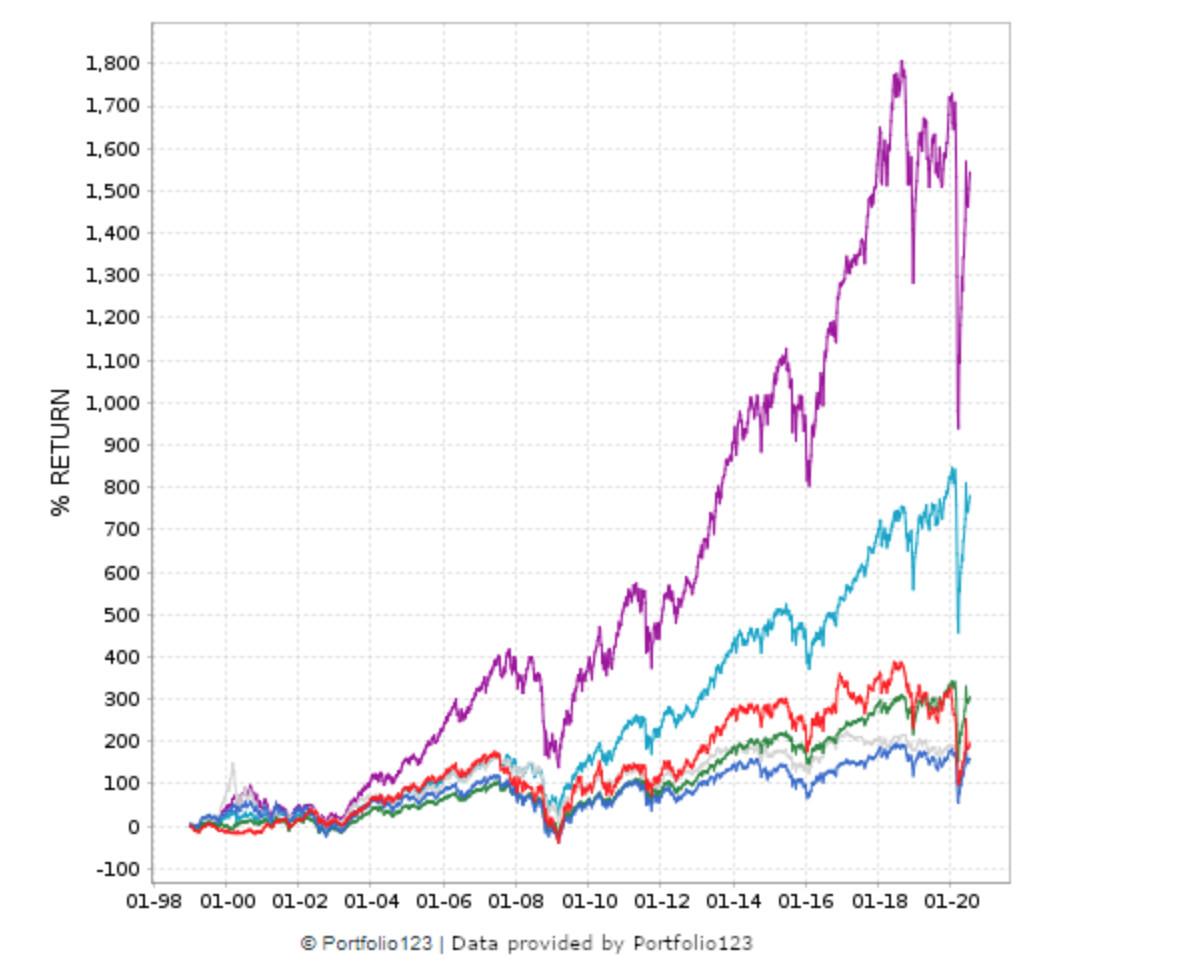
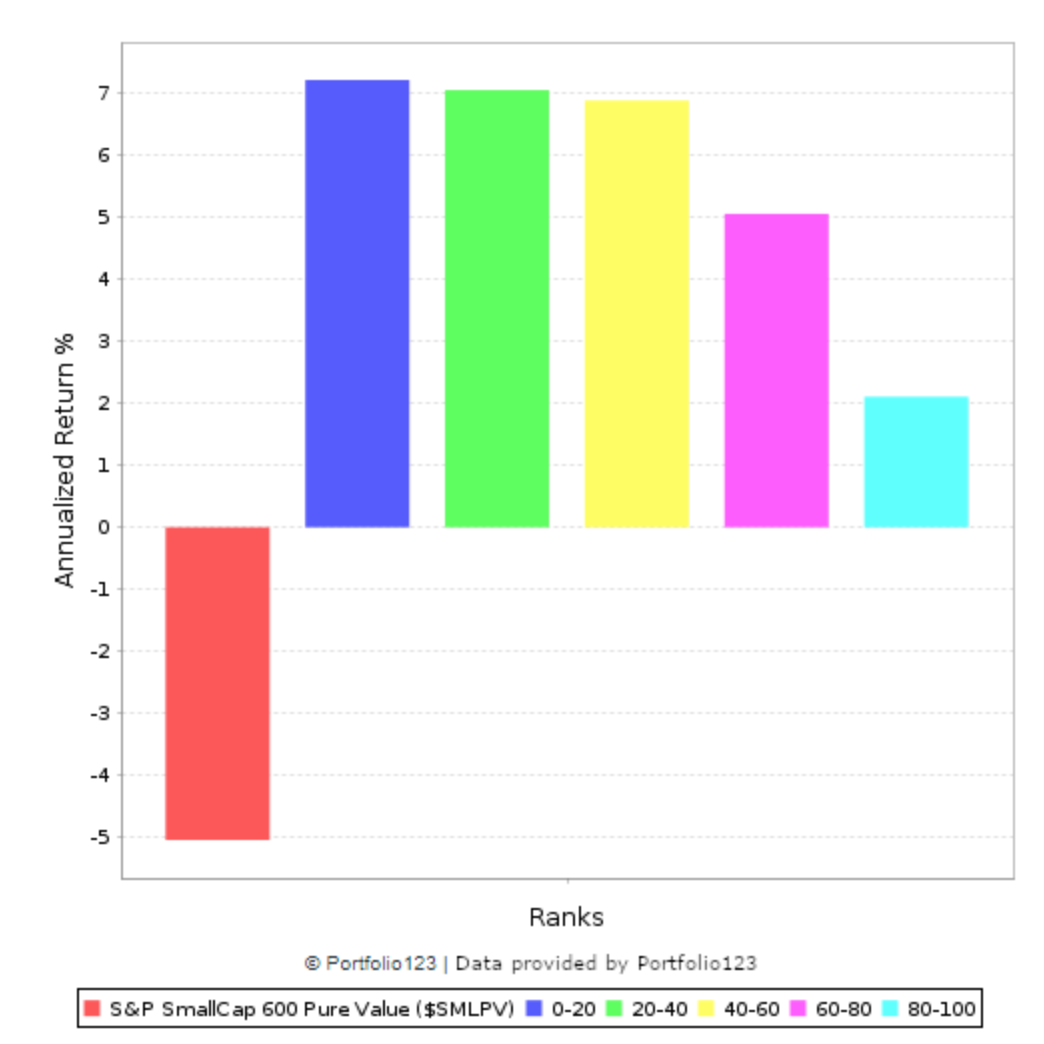
Not limited to earnings estimates however. Here is EBITDATTM/EV. This universe is the PRussell 3000 also.
Enough to make me not want to discount walk-forward methods that do not look back the entire 20 years. Something that adjusts to more recent events. Not that I have much out-of-sample data to show (either way).
If I shift the test back five years, the performance looks somewhat better. But I would get some clarification on how PIT the estimates are before getting too comfortable with it. And if the formula hasn’t worked for the last 5 years I would be questioning the usefulness going forward.
Are the earnings estimates data different than fundamentals at FactSet with regard to being PIT? I ask this not having an answer as to whether one is more PIT than the other.
If there is no difference, I think I will drop EBITDATTM/EV first (in this market).
That doc gives me a headache. The problem with the previous vendor was that they claimed that it was PIT but they didn’t freeze the data until Monday morning, too late for P123 to process. So it may have been historically correct for them but not for P123.
In any case, the earnings growth formula does not represent growth. There are actually multiple problems with the formula that has been previously mentioned. But if you are OK with that then that is all that really matters so long as you are not trying to sell others on the approach. I don’t really care what Zacks does. Lots of people misuse formulas and get away with it.
I’m also not understanding your point with regards to EBIT/EV. It is clearly not working so why even bring it up?
“Abs(CurFYEPSMean) / Abs (CurFYEPS4WkAgo). This would rank stocks that had an EPS estimate of -0.13 four weeks ago and an EPS estimate of -0.01 right now very low. A stock that had an EPS estimate of -0.01 four weeks ago and an EPS estimate of -0.13 right now would be ranked extremely high. Is this what you want?”
hmmm, I get the logic and I understand the argument.
Factors do not work on their own, they work in relation to the whole ranking system. So I might capture good earnings development, when
both are positive, and I might get a great price with when both factors are negative, since the other factors keep things (quality, value, momentum, industry momentum etc.) in check. At the end I do not know. Judging one factor is difficult, in conjunction with 20 more factors I think its
to complex to really understand and explain.
Do we really now the reason why a factor works, or is is always a thesis that was produced in hindsight after the backtest?
o.k, there are factors where the reason is clear (earnings going up, higher stock prices). On other factors like small caps and momentum,
I think the thesis came after the backtest. I read a lot justifications on why momentum works (slow adaption to secular earning trends reflected in price…), none is really convincing to me: it might be one reason for one stock and another reason for the other.
One of my other hobbies is selling and I know what works and those factors have been researched by academics with a positive confirmation. But but the “why” academics find is usually very thin. It works, so you use it (for example ancoring a sales price to the customer, so you suggest first about 20-50% (depending on the country you sell) over a the price you might sell at the end).
I have a trading system not changed since 2003, its based on momentum and it picks stocks with a very high stock price (e.g. stocks that do not split).
There is some academic research, that confirm, that high prices stocks combined with momentum outperform, but its really thin.
I do not trade it since it is into big caps, but it produced a 17% performance since 1999.
What I am saying is: sometimes you found something and it has not be rationalized (and therefore it might be a good not found edge by others), you do not know why it works and you take the risk to still use it.
Still your argument is strong and my one is weaker, I am not sure and still thinking about it…
Here is a study from the text "Modern Portfolio Theory and Investment Analysis that I think supports Steve’s ideas on the importance of growth as well as the importance of earning surprises:
"Kormendi and Lipe (1987) examined the effect of earnings information on stock returns. They introduce the notion of earnings persistence and begin to explore the notion of unexpected earnings…… This coefficient is often referred to as the earnings response coefficient, or ERC…… Kormendi and Lipe hypothesized and found that the ERC is positively correlated with earnings persistence; that is, the stock market responds more to the earnings news of firms whose earnings changes are more persistent. This indicates that the market understands the time series properties of a firm’s earnings, and stock prices adjust accordingly to earnings information.
According to the text, Steve has a point when he says that growth can be an important factor. But an earnings estimate surprise is something different. Growth is only one thing that may (or may not) indicate an earnings surprise.
There are additional factors that may be predictive of an earnings surprise (and may not be related to growth). Most writings relate the equations (CurFYEPSMean - CurFYEPS4WkAgo) / Abs(CurFYEPS4WkAgo) and (NextFYEPSMean - NextFYEPS4WkAgo) / Abs(NextFYEPS4WkAgo) to an increased chance of an earnings surprise.
But I cannot imaging that these would be the only factors related to earnings surprises–or necessarily the best. I am not going to debate what factors or equations are the better ones. Maybe you will use all of them or more than one of the good factors in a sentiment node.
Anyway, if the academic research is correct, you may want to follow Steve’s advice about growth and use whatever equations you think may be predictive of an earnings surprise as well.
That is unless you are going to use just one factor in your ranking system. Then you might want to debate the relative importance of each alone.
That’s why it’s even more important to only use factors that you really understand. If you think something works, it’s a good idea to figure out why it works, and I mean “figure out,” not “guess.” If you use a factor that you don’t understand, it will do things that you don’t want it to do. And your money is at stake.
Yes, sometimes the thesis comes after the backtest, unfortunately. That’s the academic approach: do a backtest, say that momentum or small minus big “works,” then try to come up with an explanation. It’s not a very good approach. Which is a better approach to curing a disease: testing a huge number of drugs to find one that might work or looking at all the symptoms for a root cause and then addressing that by engineering a drug that targets that cause? Both approaches are frequently taken, but one is clearly better than the other. It turns out that most factors have relatively simple explanations for why they work. Why does momentum work? Because, as I wrote recently, “Companies that outperform are more likely to continue to outperform than companies that underperform, and companies that underperform are more likely to continue to underperform than companies that outperform. Since companies that outperform tend to increase in price and companies that underperform tend to fall in price, momentum is a natural consequence of the persistence of performance.” See Why Momentum Works - Portfolio123 Blog If a factor seems to work but makes no sense, it should be discarded without further ado. Sometimes you come across a factor that seems to work but you can’t figure out why. In that case, it behooves you to dig deeply and understand it before putting it to use.
Yes. Nobody knows why certain herbs cure certain illnesses. They seem to work, and so people use them.
Personally, however, I’d prefer to understand the factors I’m using to pick stocks. And if a factor doesn’t make sense to me, I won’t use it.