Yuval,
There is no statistical basis that multi-factor ranking systems tend to be more robust than simple systems with a few factors. in fact the opposite applies.
Please refer to the Akaike information criterion (AIC):
Given a set of candidate models for the data, the preferred model is the one with the minimum AIC value. Thus, AIC rewards goodness of fit, but it also includes a penalty that is an increasing function of the number of estimated parameters. The penalty discourages overfitting, because increasing the number of parameters in the model almost always improves the goodness of the fit.
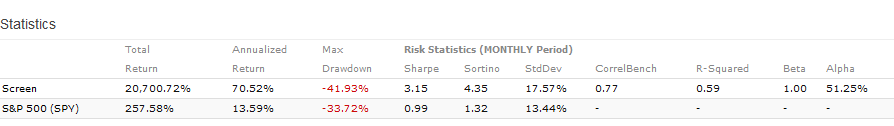
I didn’t exclude the prelims because I rely a lot on preliminaries when I buy and sell stocks. But I’ve done a new backtest on FactSet excluding prelims, and you make a very good point about why such a backtest is preferable. The result is below.
Basically, if you’re putting a lot of money in an investment, you want to look at it from as many angles as possible. That goes for houses, cars, stocks, horses—you name it. A multifactor ranking system allows you to do so more fully than a simple one.
As Far as I understand this, the difference of having multiple variables or not, is the correlation between them.
I agree with the idea of “The simpler the better”, because usually, minor variations of the paramenters in a system, provide completaly different results. For example, in a momentum system, different lookback periodos, rebalance periods, types of Moving averages, etc. show highly different results. This happens because the variables are not correlated, and there is a lot of sensivity.
On the other hand, when you include more factors in a ranking that are measuring the same thing (e.g. Value, quality, etc), the correlation between them is high, and having many factors only avoids potential errors of measurement of one factor. The sensitivity is very low.
Before starting to design a system you have to be clear with what are you looking for, what’s the edge you are trying to capture and how are the parameters you are using.
There’s no one truth about “more factors” vs “Less factors”. It dependes a lot.
And my last point: In general even if you are operating a simple system with few parameters (e.g. Dual momentum), it’s preferrable if you diversify it by using more simple systems with different parameters. Plenty of info about this topic in the blog: Fragility Case Study: Dual Momentum GEM - Flirting with Models
Essentially all statistics we learned in college assumes an I.I.D. (independent and identically distributed) distribution. But this assumption is simply not true for the stock market
Knowing that this assumption is not true many authors will make the assumption that the data is Ergodic and adequately mixing. Is this assumption true? I do not think anyone has proved this. No one has proved that this assumptions is true (or not true) for the stock market. And it probably depends on the particulars of your model.
This question of ergodicity, that seems complex, can be simplified to the question of whether one can find a good all-weather strategy that works in all market regimes. De Prado says there is no all-weather strategy but perhaps he is generalizing a bit. Perhaps you have your own answer based on your experience.
Yuval uses a method of dividing the data into different time periods and checking the correlation. I like what he does with that and I believe this can be generalized and done in different ways (all of the methods good).
I encourage people to listen to what Yuval does, read de Prado’s method and develop your own method.
I use a modification I call the CCSCV: criss-cross symmetric cross validation.
Criss-cross validation is a standard validation technique that is inherently symmetrical with equally sized test samples and validation samples. But I use it over de Prado’s method just because it is easy. It is not the best method.
Also called model averaging (and similar to stacking). Yuval has written on this too, I believe.
Ignacio,
AIC is a solid technique. As you already know, it is similar to the “Adjusted R-Square” that everyone routinely uses in the Excel regressions (and everywhere else). Very solid indeed.
Broadly speaking, Yuval and Ignacio are both right. It would be wrong to look for small points of disagreement, IMHO.
Did above the release make changes to LTGrthMean etc and other estimates? If so, would it be possible to reverse the change and use the raw data?
Thanks,
David
Preliminary statements are those that a company issues in a press release before filing them with the SEC. The statement that is filed is the final statement. FactSet replaces the financial information in the preliminary statement with that from the final statement, while Compustat doesn’t. So if you use preliminary statements and there’s a difference between the prelimary and final statements, you’re not getting real P.I.T. performance.
Yuval
Is my thinking correct to say that by using preliminary data that you may not be getting real P.I.T. performance with Factset however actual performance of a sim should still be more realistic because the market should incorporate the preliminary statements data into the the pricing of the stock?
It all depends on what fundamentals you’re using. If you’re primarily using the income statement, you’re absolutely right. However, many items may be N/A in preliminary statements. For example, take a look at CAKE’s press release from last month: https://s22.q4cdn.com/604834465/files/doc_financials/2020/q1/CAKE-1Q-2020-Earnings-Release-FINAL.pdf. It includes a rough income statement but no balance sheet or cash flow statement. Most of the Q0 numbers we have for CAKE right now are NA. It’s been a month since that press release came out and CAKE still has not filed its Q1 report with the SEC. So you have this very long lag time with tons of N/As for Q0. This is the case for a lot of companies, especially when it comes to cash flow statements. If you’re looking at FCFQ and you use FactSet preliminaries, in many cases you’re going to be using numbers that simply didn’t exist at the time.
performance again: since the cutoff day to factsheet comes soon, could you power up factsheet servers, it got a bit better, but still too slow to test to optimize to factsheet data. Thank you
Best Regards
Andreas
Some of these are not being pulled from Compustat, e.g. UST10Yr. So they will remain the same. The factors that are currently being pulled from Compustat estimate data are listed in this Trello card: Trello