These are different datasets. Yesterday morning data has with closing prices for March 10. This morning has data for March 11 close prices. Maybe you were looking at the file download date?
Yesterday morning when I downloaded the rank data it said rank data as of 03/11/26. Just now, I downloaded the rank data, and it still says rank data as of 03/11/26- yet the ranks are different. On tuesday my sim bought a Canadian Stock - as of this morning that transaction is gone. I also have 6 more trades since 2019 that were not there as of yesterday.
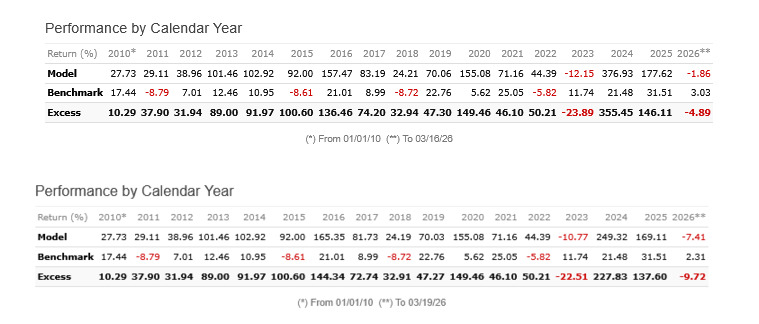
Woke up this morning and all my annual returns have changed again in my sim. Impossible at this point to design a sim when the data seems unreliable.
What universe? USA or Europe? I think they are still updating stuff from the "March 4th event". That's what they call it.
@marco North America Primary
For those of us using this site to invest real money, we are now using ‘potentially’ incorrect data.
Investing is noisy, and always will be. It's not 100% science and it's not 100% art. It's 50/50.
There will always be errors, corrections, and backfills. So a backtest is nothing more than one possible path the strategy could have picked. Your re-run is only slightly different. That's good. It handled a little permutation well. But it could still be curve-fitted.
3 Likes
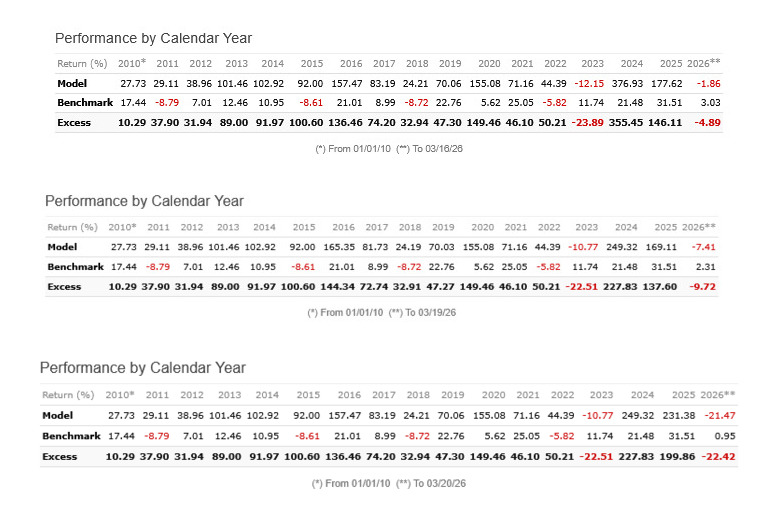
Its not that my re-run is only slighlty different, it changes day by day. My question is whether the current data is even accurate. The data changed again today. At this point I am shutting down my real money portfolio as I have no confidence in the validity of the data.
@falnu before shutting everything down, it might be worth checking whether some of the inconsistency isn't data-related at all.
I ran into the same thing recently rerunning the same backtest on different days, different results. Turned out part of it had nothing to do with FactSet.
Even with perfectly stable data, ranking systems can produce different results between runs. Two main reasons:
-
Ties in factor values. If you have factors that return the same value for many stocks - anything integer-based (like "in how many of the last N quarters did EPS grow" which outputs 0 through 6), or industry/subindustry aggregates where every stock in the group gets the same number - the sort order among tied stocks is basically coin-flip territory. Most sorting algorithms don't guarantee a stable order for equal values. That randomness cascades through the composite rank and can shuffle your final picks.
-
Floating point math. If P123 processes stocks in a different order between runs (parallelization, different server, whatever), you get tiny rounding differences - IEEE 754 means (A+B)+C doesn't always equal A+(B+C) at the 15th decimal place. Normally nobody cares, but when thousands of stocks cluster near the same factor value, that epsilon can flip who lands on which side of your buy threshold.
With only 6 holdings both of these hit harder. A 20-stock port absorbs the same ranking noise and you'd never notice.
One way to find out where the problem actually sits: break your ranking system into individual factors and backtest each one separately across a few days. Stable results = stable data. Jumping results = either the data is changing or the factor produces too many ties. Narrows things down pretty fast.
The FactSet problems are obviously real Marco's been documenting them. But some run-to-run variation is just how ranking works when you have ties and a concentrated portfolio. Worth ruling that out so you know what you're actually looking at.
5 Likes
@Babeshkin Thank you for taking the time to respond. Unfortunately, at least for my account, there are some serious data issues which have not been addressed. Given I invest real money and the cost of using this site, and all the time and effort I have invested to date, I have no choice but to stop and won’t be renewing. I don’t find the response from P123 to be satisfactory. The first set of returns were generated around 8 am today; 4 hours later, I reran the sim and the returns changed yet again - substantially. No changes were made to my sim.
Your sims look like a butterfly  effect to me of all topics discussed on the thread
1 Like
Yes, probably a good idea to quit. I can tell you without a shadow of a doubt that unless you are 100% committed to what you are investing in, it will not work for you.
1 Like
Just to repeat the point mentioned earlier: If a small update to the database changes the historical rank of a stock from 95 to 85, that is quite bad. But if the change is from 95 to 94.98, that is clearly not a problem, but it might dramatically change the result of simulation with only 6 stocks.
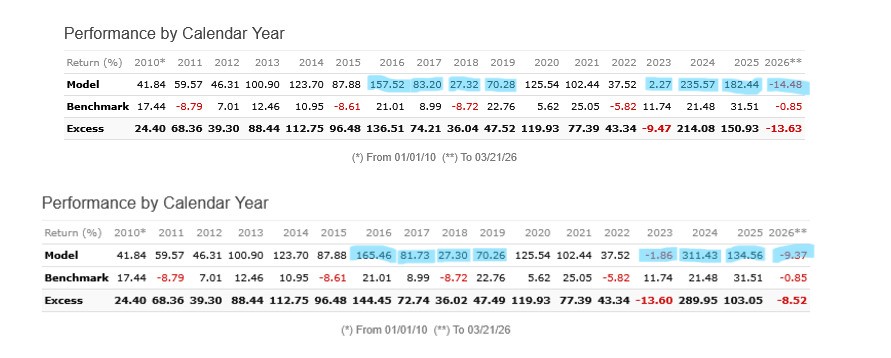
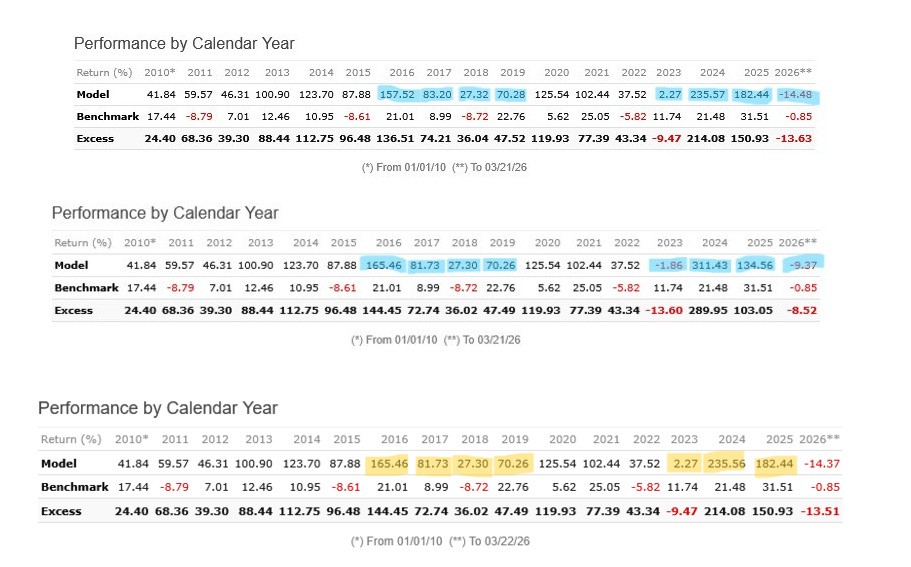
For clarification, when Marco looked at the sim it had 6 stocks, but over the years it held more stocks than that. From what I can see, the problems relate to the years 2016-2019, and 2023- present. As you can see, the returns in those years changed again this morning, and the market was not open yesterday.
1 Like
These variations are completely in line with what I’d expect if your portfolio is 10ish stocks. A rolling screener would tell you much more, or any other way to look for large changes in historical ranks.
I think the question of whether ties contribute can be answered. Ties can be broken in a deterministic way by using mod(stockID, x). With careful coding, ties should be broken the exact same way every time.
You could use something like 99.9 * frank(feature) + 0.1 * frank(mod(stockID, 100)) within each node, or make each node a composite node with a 99.9 weight for the original feature and 0.1 for the mod(StockID,100). The 'x' and the node weights may need to be adjusted empirically to get a fully deterministic model.
A quick caveat if you test this: you will likely see your simulated returns decrease a bit, as the top-ranked stocks can get reshuffled .
That could be addressed if the rank precision were higher, so that the random contribution is small enough not to shuffle any real rank changes due to the mod(). Ideally it would be small enough not to drown out actual rank changes.
The net result would be a more realistic, deterministic sim if random tie-breaking is the major cause of this.
It would be a great addition if we could have a toggle to allow seeding directly into the ranking system to break these ties during testing—similar to how regularization is used when building ML ranking systems. We frequently see these threads resurface from newer users who may not yet be familiar with the inherent noise and tie-breaking nuances found in large, real-world datasets.
1 Like
The double-sort algorithm proposed here would be the easiest method to make ranks more deterministic, perhaps: Sub sector, country and double sort in in ranking system
If P123 is moving toward a true double sort in the future, achieving a deterministic model becomes straightforward. A true double sort only applies the secondary criteria to exact ties in the primary metric. If the system allows us to designate a fixed identifier (like mod(StockID, x)) as that secondary sort key, it would guarantee perfectly stable tie-breaking without the risks of using composite weights that could reshuffle some valid ranks.
It would only take a few tweaks by P123 to make this algorithm an option in a node. Maybe a check box Make it Deterministic, for users. But we could do it ourselves also (once we get a double sort).
BTW, P123 only updates data overnight. Any changes in FactSet data will not show up in P123’s data from 8 AM until noon. This means changes in FactSet data does not explain much of this. Excluding changes in FactSet data as a cause makes random breaking of rank ties a likely explanation for much of this.
1 Like
Falnu was kind enough to let me review his simulations.
The simulation runs from January 1, 2010 through March 21, 2026, using a broad North America primary universe with no filtering, meaning all eligible stocks flow directly into a relatively complex ranking system. Around the point of divergence, the universe contains approximately 9,000 tickers. The strategy rebalances daily and generates about 900 trades over the full period. PIT Method - Prelim=Use.
When comparing the two transaction files—one generated on Saturday and the other on Sunday—the results are identical until March 15, 2023, where the first divergence appears.
At that point:
- In the Saturday run (03/21/2026, evening), the system sold TTNM:CAN on March 20, 2023.
- In the Sunday run (03/22,2026, afternoon), the same stock is sold one week later.
- In both simulation, Rank position caused the Sell.
From that point forward, the simulations increasingly diverge:
- By the end of the period, there are approximately 90 transactions unique over both files.
- Additionally, about 60 transactions are shared but differ in values.
Overall, this behavior is consistent with a butterfly effect, where a small timing difference in a single transaction propagates through subsequent rebalances, leading to significant divergence over time.
The transactions could differ b/c of rank ties or updated data facing the ranking system.
9 Likes