By rereading the blog (and based on your old formula) I understand that you already multiplied by 2.
So if I want to check expected slippage in a screener, I could add the following lines if I understand it well:
setvar(@spread,LoopMedian(“Spread(Ctr)/Close(Ctr)”,35)) // a
setvar(@dailyvolatility,LoopStdDev("(Hi(Ctr)-Low(Ctr))/Close(Ctr)",100)) // b
SetVar(@mediandailytot, MedianDailyTot(126)) // c
SetVar(@avgtradesize,5000/close(0)) // d - replace 5000 by whatever you want to invest per day in USD amount
ShowVar(@marketimpact, 0.25*@spread + 0.5*@dailyvolatility*(@avgtradesize/@mediandailytot)^0.5*(1.2-1/2)) // 0.25 × a + 0.5 × b × √ (d / c)× (1.2 – e / 2)
Also, is there a way to see the show var not only for a screen at a specific date but for a period of time so that I could check what would be the expected slippage of the stocks selected by a screen.
I am also wondering what is would be the impact of splitting the orders throughout a week.
For e.g. let's imagine that we have a strategy rebalancing every week. What would happen if we would spread it accross the week, similar to having 5 strategies: one for Monday, one for Tuesday, etc.
Obviously market impact on Monday should be lower assuming the buy amount is divided by 5. But should we expect diminishing returns for each following day as we have a small impact every day?
Market impact would definitely be lower, but not 20% lower. The standard measure of market impact, which empirically I've found to be well-founded, uses the square root of the ratio of the number of shares bought to the volume traded. So if the market impact of the entire order is X%, then the market impact of one-fifth of that order would be the square root of one-fifth times X%, or about 0.45*X%.
As you get farther from whatever signal you're using to place trades, there will, of course, be a delay cost. Whether that will outweigh the decrease in market impact is a rather difficult question, and really depends a lot on the stock's liquidity and the amount you're trading. I tend to spread most of my orders over several days, but some of them I don't.
This is based on the original formula, not your more updated one - but should apply.
Estimated profit takes into account the average trade value based on ranking.
I've also played with taking powers of this to weight more to the most profitable stocks, but it starts to skew to heavily and I'm worried about overweighting. I wondered what your thoughts were on using Rank Formula like this?
@yuvaltaylor I wondered about using variable slippage. This sounds like a good idea (to be conservative) but has a pretty significant negative impact in simulations.
In my live trading that I've been tracking, I aim to target the Open with VWAP orders. When I track my realized slippage versus the Close, it is consistently negative (i.e. "making money") on average and it seems to me possibly more realistic then just to use Close as the target and set slippage to 0%. My trading versus the Open is also very low.
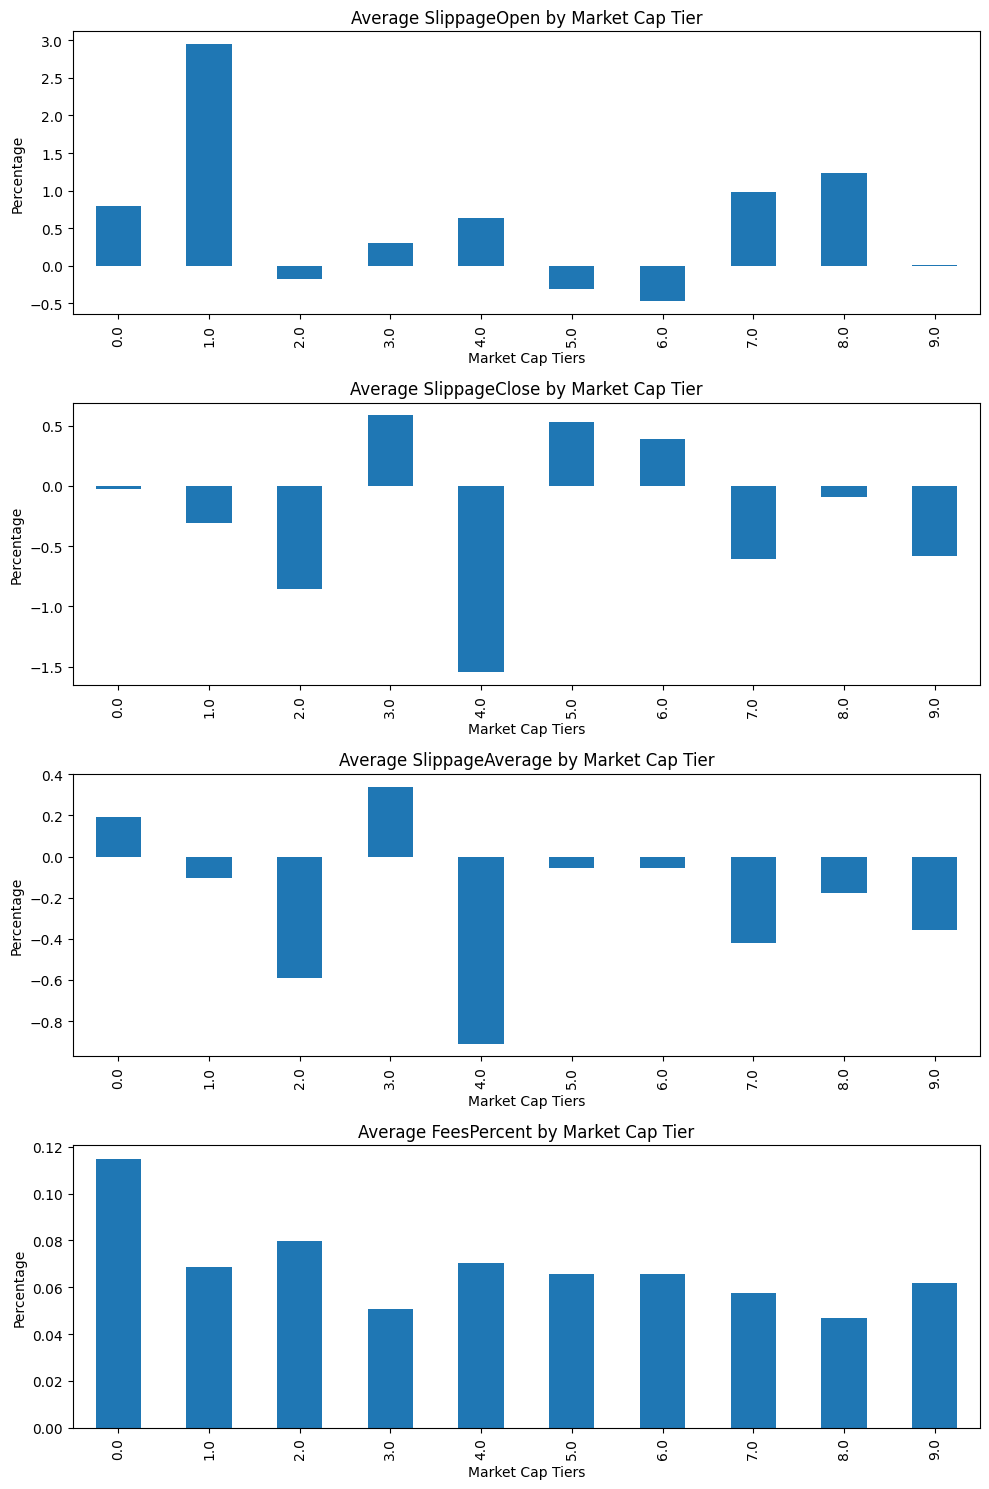
Here are my results from a year of live trading:
Total average fees as a percentage of transaction value: 0.05%
Average fees as a percentage of transaction value: 0.07%
Average slippage as a percentage against open price: 0.11%
Average slippage as a percentage against close price: -0.09%
Average slippage as a percentage against average price: -0.05%
I further plotted slippage versus marketcap and there was no clear pattern. Only fees were consistently higher at lower marketcap and lower priced stocks, which makes sense.
I do need to consider that. I'll work on collecting that data.
For my realized performance versus live book (which is using only 0.2% slippage versus Open):
Sim of Live Book YTD: 45.16%
Live Book YTD: 41.51%
Realized YTD: 37.94%.
If I rerun the sims of the live books with variable slippage YTD is predicted 38.35%
All sims are vs Open.
So there is a decent chance I was underestimating the market impact and in this case variable does look pretty accurate.
When trying to implement Yuval's suggestions here, including the new rank formula weightings with my previous low slippage estimates - the new sims looked much better!
However, switching to variable weight seemed to tank the sims. This must be because there's not a solid $ liquidity floor like I was previously using, but it tilts much more heavily towards illiquid and smaller stocks.
IMO, slippage should always be measured against the price immediately prior to placing the order. If you're placing the order before open, then it should be the previous close. But if you're placing the order after open, then it should be the open or the trading price shortly before placing the order.
Using variable slippage IMO is indeed "conservative." But if you don't use it, your simulation results will heavily favor hard-to-trade microcaps and nanocaps.
The prime source of slippage is market impact. If you're buying $3,000 worth of a stock that trades $500,000 per day, you won't see much slippage. If you're like me, though, and you sometimes buy 80% of the average daily dollar volume, slippage is going to be pretty high.
Thank you Yuval. I tried previous close with variable and the strategy looks viable still. It also helped to reduce some turnover with Max Position Drift, Max Portfolio Drift, and Min Rebalance Transaction
I am a bit hung up on Variable Slippage. Taking 5% slippage out basically makes it worthless to invest in very low liquidity stocks. Even the 1.5% at 50-100K round trip is too much of a drag.
So my simulations improve by simply setting a floor and excluding anything below 350K so the "slippage tax" is low enough.
Is that the right approach? It seemed your system was rather titled towards allowing greater investments into smaller cap stocks, and your @MarketImpact calculation seems to estimate a lot less than 5% impact when run as as screen on small caps.
With 6 figure sums, i think its a waste of potential to use variable slippage. My system tanks from 50->19% annual return with variable slippage instead of 1% fixed. I use Vol10Avg>0.01 as a buy rule.
This system was traded live successfully with ~40% annual returns over the past 4 years. Maybe with seven figures it starts to hurt more, but i think it is largely dependend on luck.
Volume is nothing you can expect to be there or to be precisely calculatable. To create volume in an illiquid stock all it takes is one big market order. Just two days ago i bought a stock in the morning and 2 hours later someone came in with one big market order and moved the stock up 50%. For that day the volume skyrocketed, but the next day it was gone. And i have seen that plenty of times. There are papers that show that illquid stocks have higher returns than liquid ones, so avoiding these situations at all is at your own detriment.
My biggest winner this year for example was a 15 million marketcap company that got taken over for 70 million. With strict liquidity rules i would have never been able to buy it.
But maybe it is just my system that handles these type of stocks better, i don't know.
Let's say you have a wide universe and you want to optimize a ranking system by running simulations. Your ranking system includes some size factors (smaller stocks better). Then you pretty much have to use variable slippage, otherwise you won't be taking into account the increase in transaction costs as those size factors get greater weights. It's really a very imperfect system. If you are as dissatisfied with variable slippage as I am, please pledge some money towards formula-based slippage: Formula-based slippage
That is interesting. I've been only running out of sample about 12 months using mostly public ranking systems on Microcaps. Pretty good returns during this time, but it looks like I am underperforming total return by 10% when compared to my very low slippage estimates based on my IBKR transaction data. I'm honestly not sure why that is and need to spend more time looking at the data.