Thanks for your answer Primus, it’s very very interesting.
Hello David.
I did all what you said, more or less, my hope is that I did it all well, but the performance just descrease a little bit. Anyway, just the question would be: Is that one the “correct” aprouch to the Greenblatt system?
Anyway, if any of you guys know or have any idea about how to improve this, just tell me, all new oppinions are wellcome. ![]()
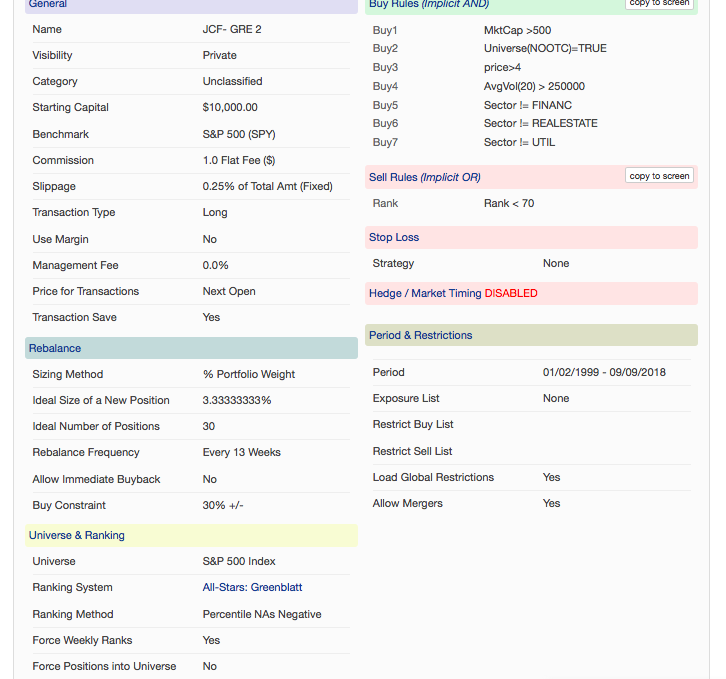
Hi Monday - Given that your stock universe is the S&P 500, your first 4 buy rules are not relevant and serve as a distraction. So I suggest that you start by deleting those buy rules.
Next observation is that you are selecting 30 stocks out of (500 - finance/real estate/utilities). Can you provide an indication of how many stocks are actually in the stock universe? It seems to me that you are selecting a reasonably significant portion of the stock universe, I’m guessing ~7%. This makes it more difficult to outperform the &P 500. Your results actually look quite good. If you drop the number of stock holdings from 30 down to 10 you should be able to achieve even better backtest results but the penalty is the higher risk going forward.
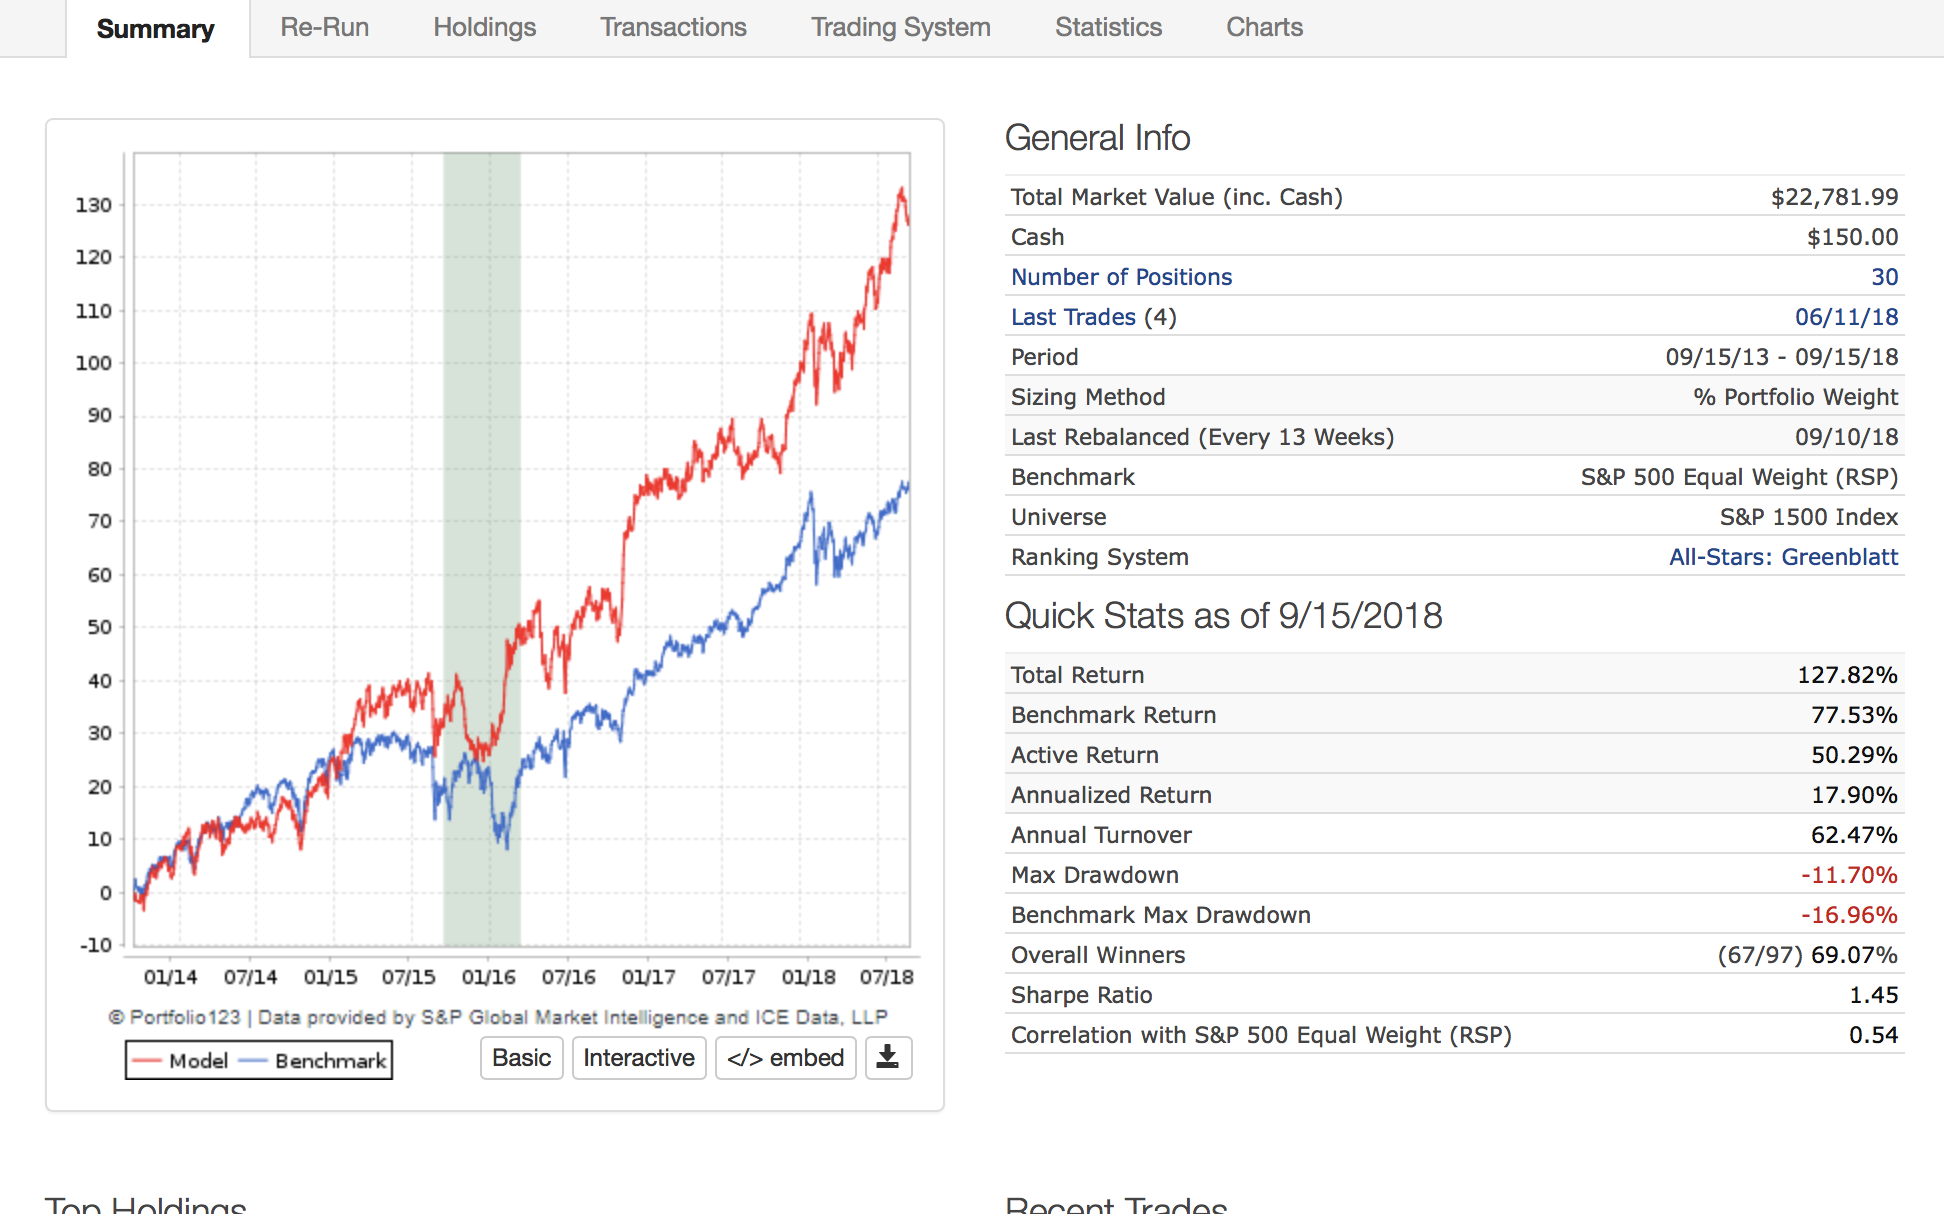
Can you run a 5-year backtest using RSP as the benchmark and post the results? If you do so, please delete the first four buy rules as these are noise.
Once the 5-year backtest is done, the results relative to the ETF RSP can be examined. THEN, you will need to run multiple backtests while staggering the start date. This is because start-up is an issue for sims/ports and can impact results of short sims (I consider 5 years to be short). Startup doesn’t follow the long-term course of events i.e. 30 stocks are bought simultaneously, not phased in as other stocks are sold…
Steve
Here are my suggestions:
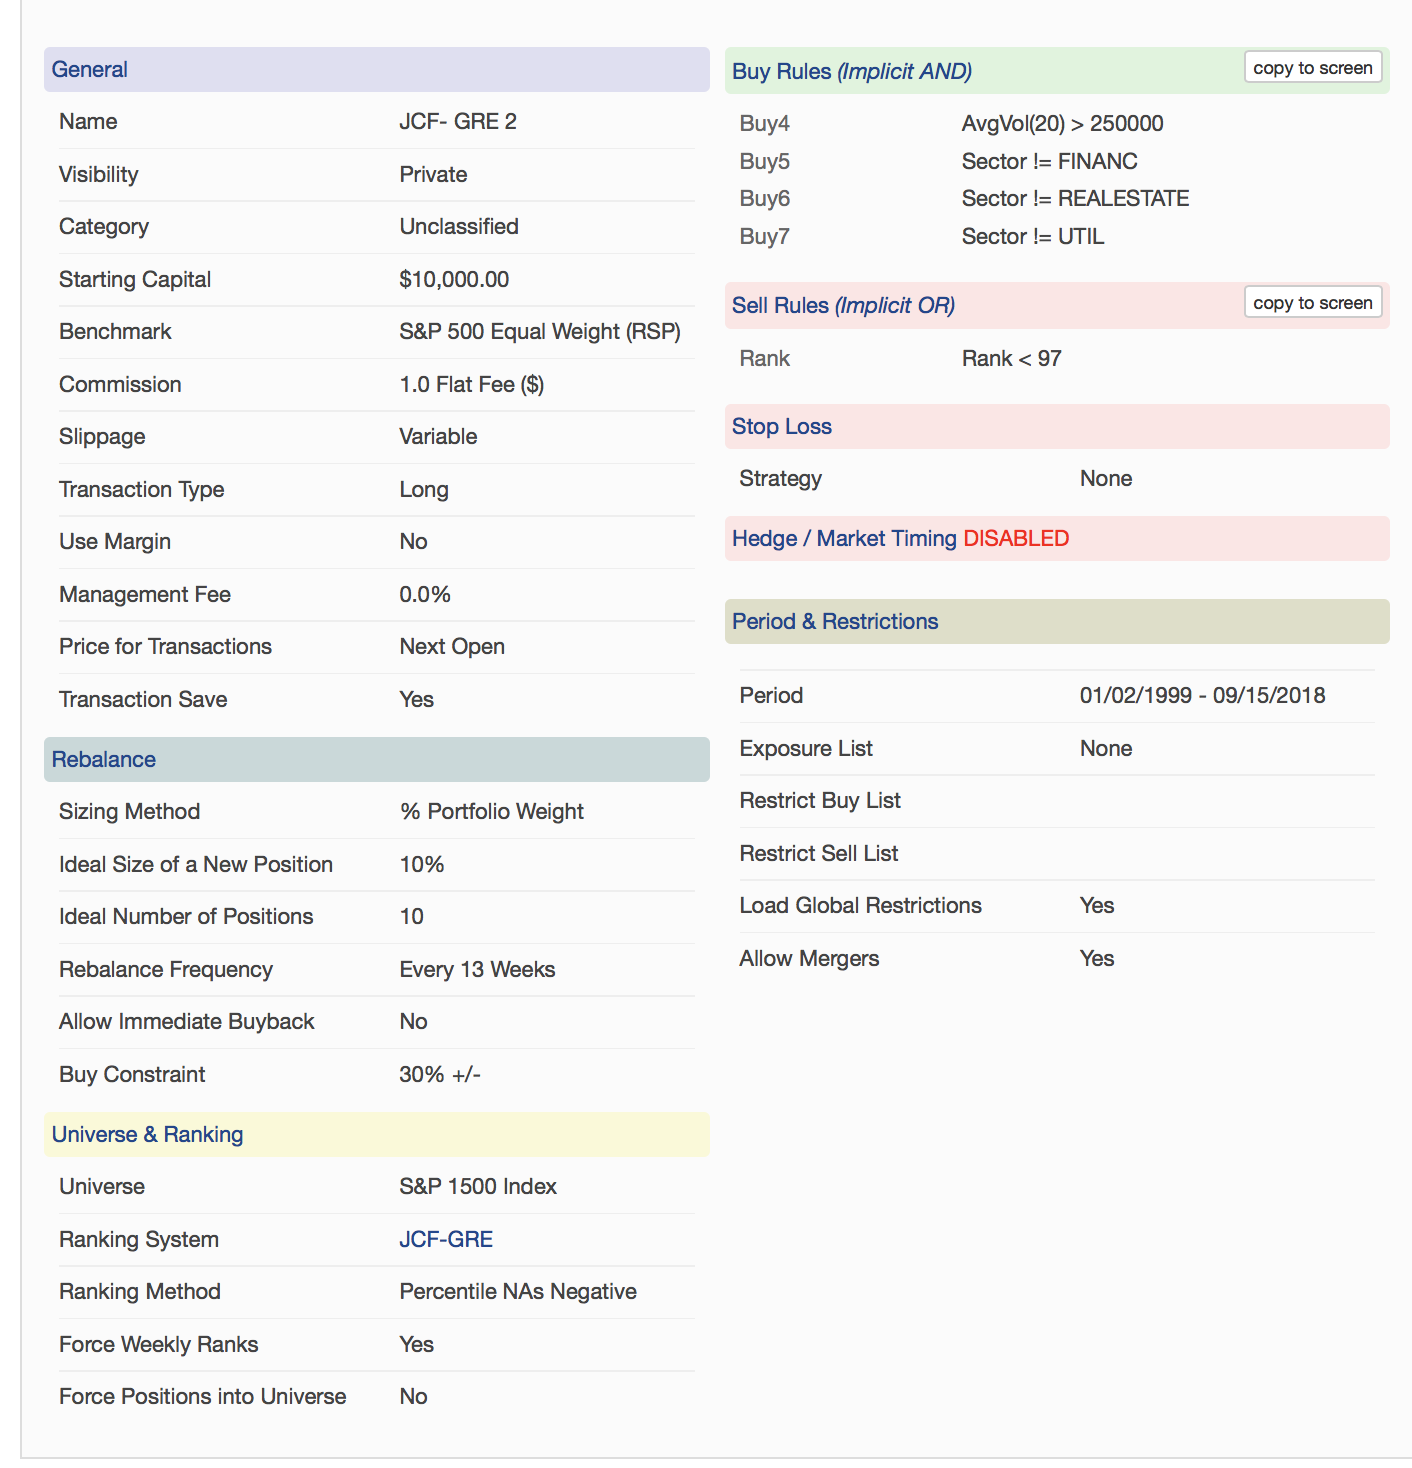
- Expand your universe to the S&P 1500. You’ll get much better results with that universe, I believe, and there really are no liquidity problems there. You could also try it with the Russell 1000. That index has much looser quality standards for inclusion, so it would be interesting to see which works better.
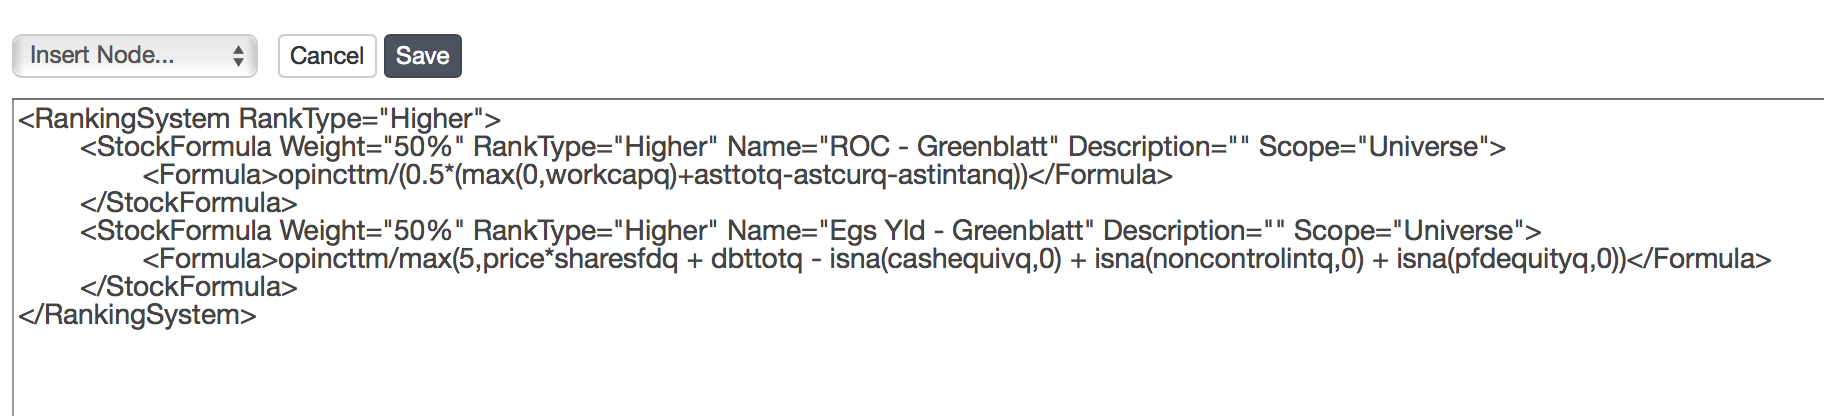
- Use the following formulae instead of the standard ones:
For return on capital: opincttm/(0.5*(max(0,workcapq)+asttotq-astcurq-astintanq)). A negative working capital is not an investable asset, and fixed assets are better calculated by subtracting current assets and intangible assets from total assets than by using net plant.
For EBIT/EV: opincttm/max(5,price*sharesfdq + dbttotq - isna(cashequivq,0) + isna(noncontrolintq,0) + isna(pfdequityq,0)). The P123 formula for enterprise value gives N/A for companies with negative enterprise value, but those are companies you really want to keep in your view; they’re often excellent companies to invest in. You also want to calculate market cap based on fully diluted shares, which is not the default for P123. - Sell far sooner than rank going down to 70. You really want to remain invested in the very top stocks here. I would argue in favor of keeping your portfolio at 30 stocks, but just doing a plain rebalance every three months (sell rule: 1 = 1), with “allow immediate buyback” set to “yes.” Or, if you’re using the S&P1500, you should set your sell rank at about 97 or 96.
- Use variable slippage. For most large-cap companies you’re not going to be paying 0.25% slippage in real life.
After you run your simulation, you should definitely look at the year-by-year results to see if your outperformance of the benchmark is consistent or is concentrated in certain years.
If you do try this, I’d be curious to hear your results.
Hi Monday,
I’m no pro, so take this suggestion with a grain of salt, but I’d suggest:
One thing I’d suggest is to run rolling backtests and/or compare lots of different start dates. A potential danger in longer holding periods is to optimize around the starting date. I think as formulated (3month hold and only selling when rank falls below 70) your turnover is only 27% you’re likely to get a wide range of results depending solely on the starting date. How different is start 1/1/2000 vs. 3/1/2000 vs. 1/1/2001 etc…
(edit: You can try lots of different start dates and various sell rules in the optimizer tool)
I think there are strategies that can work fine with longer holding periods, but for testing it’s usually better imho to shorten the holding period and increase turnover to make sure the strategy consistently picks stocks with an edge.
again, all imho
Spaceman - good points. For initial development, I usually set commission/slippage to 0 with weekly rebalance and sell all holdings at each rebalance (with ability to re-buy the same stocks of course). The profit per trade will be “crappy” but with results that I like other than profit per trade, I have a starting point for a system. The trick is then to raise the profit per trade while minimizing impact to the trading system. This generally involves modifying the sell rule(s) to hold individual stocks for a longer period of time and include such things as selling with a pseudo-stop loss or when the rank drops below a certain level.
Steve
Thanks to all of your guys for your help. I’m going to implement all your advices and let you know the result. Thanks!!!
Hello Steve.
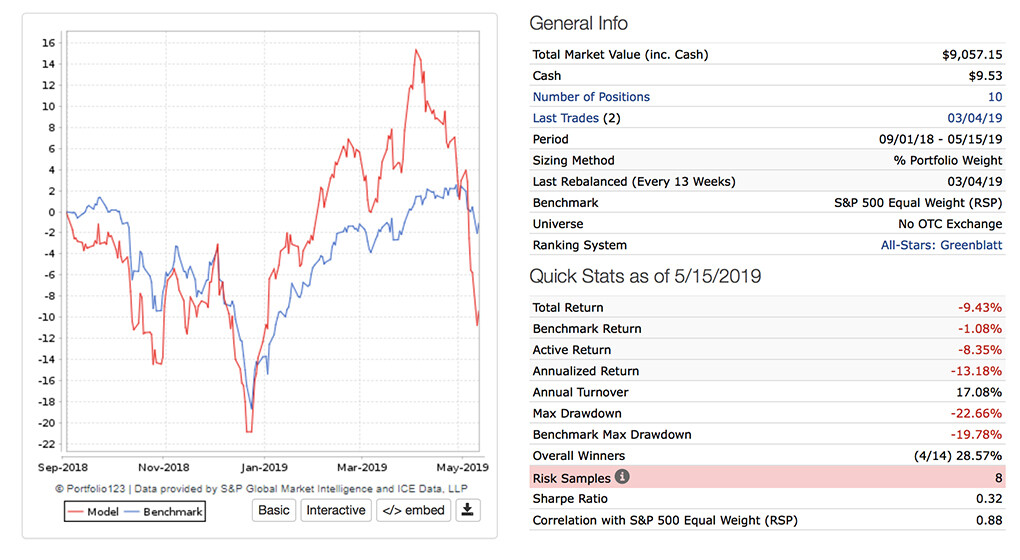
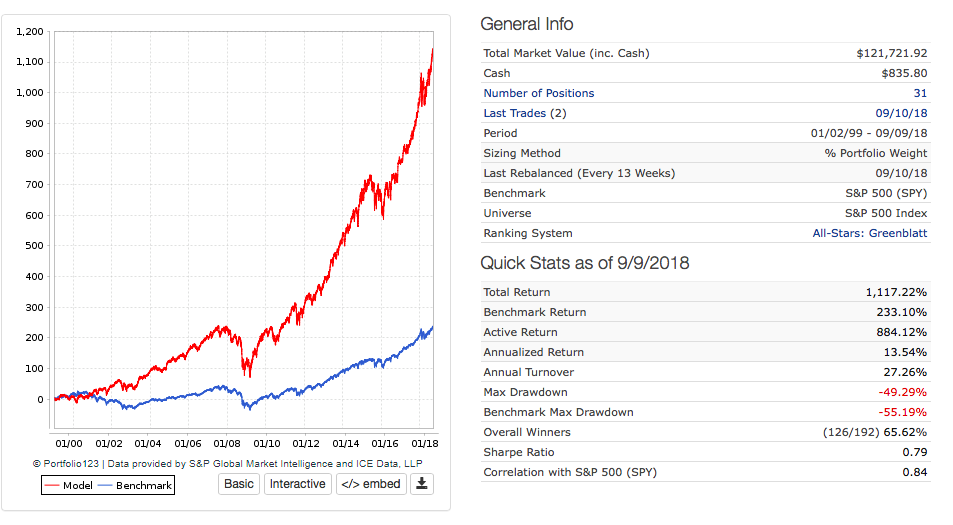
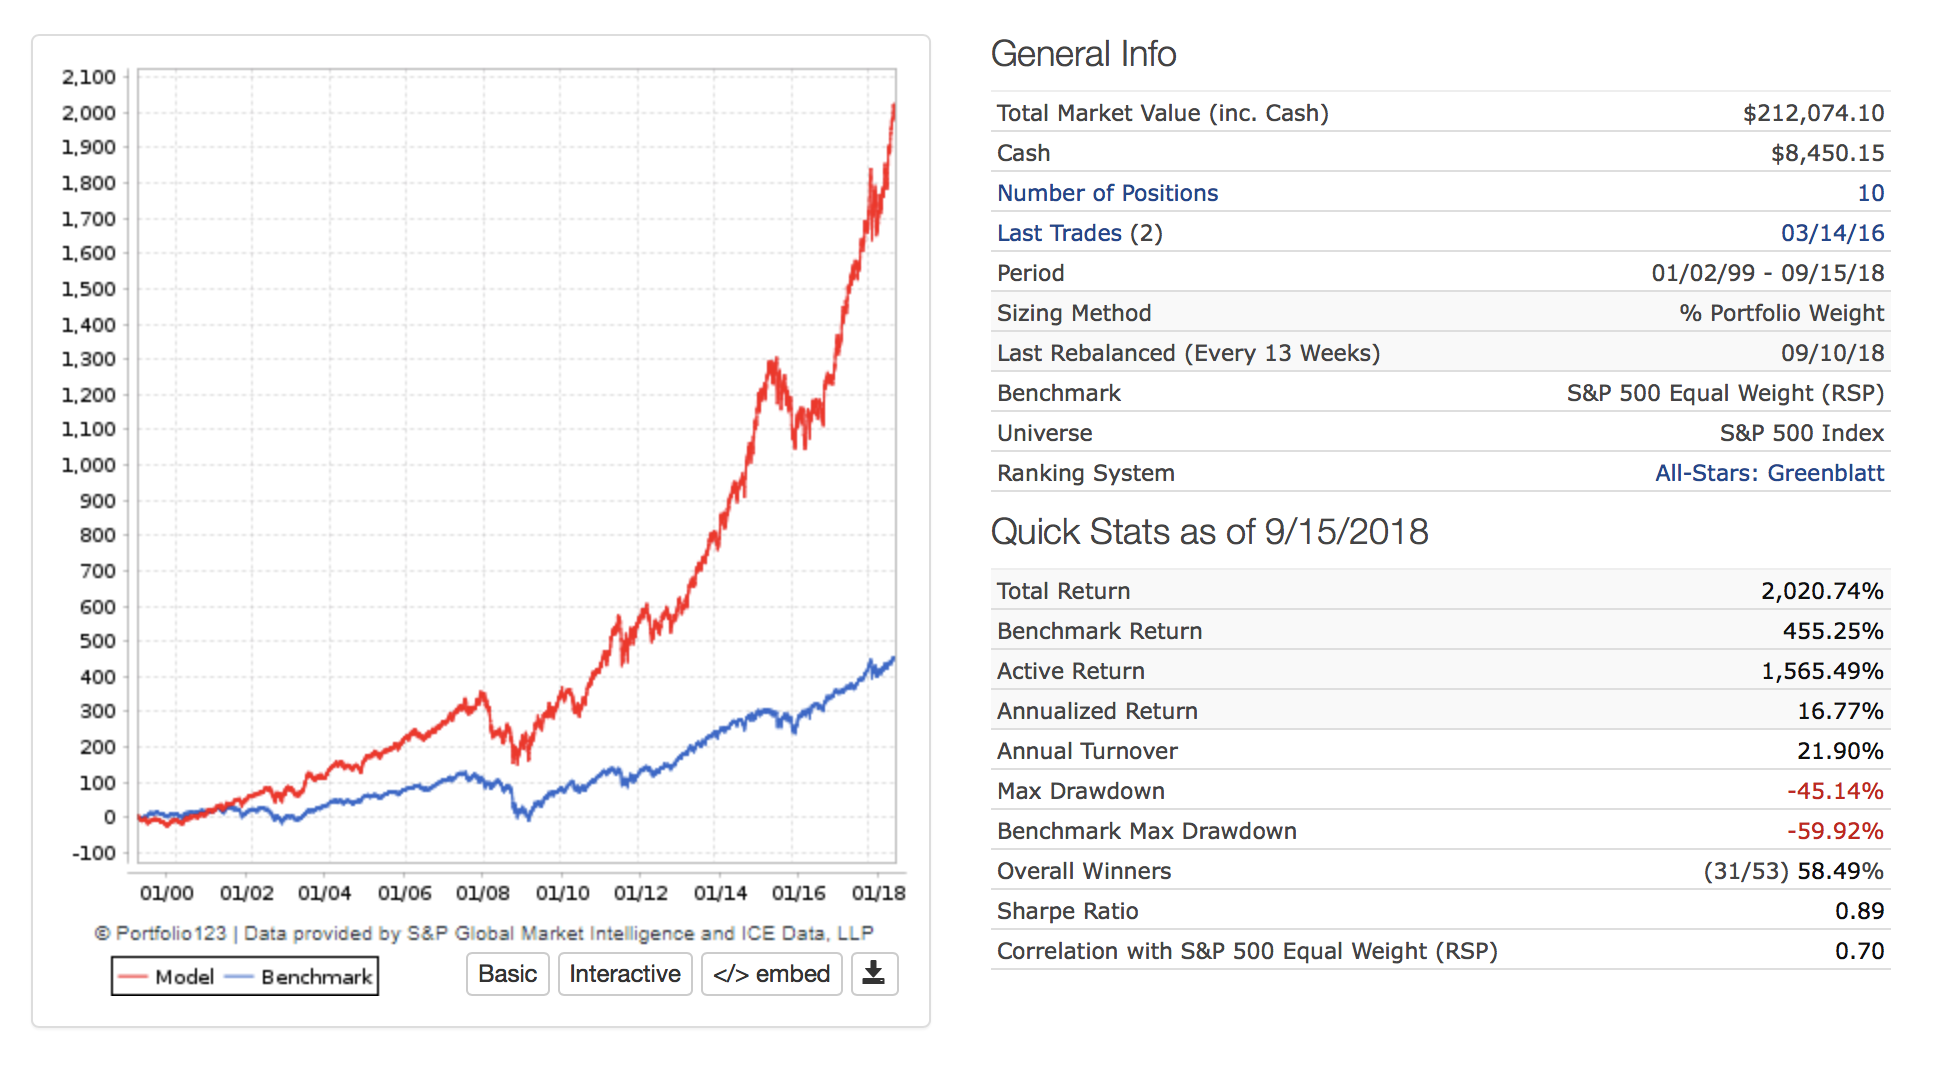
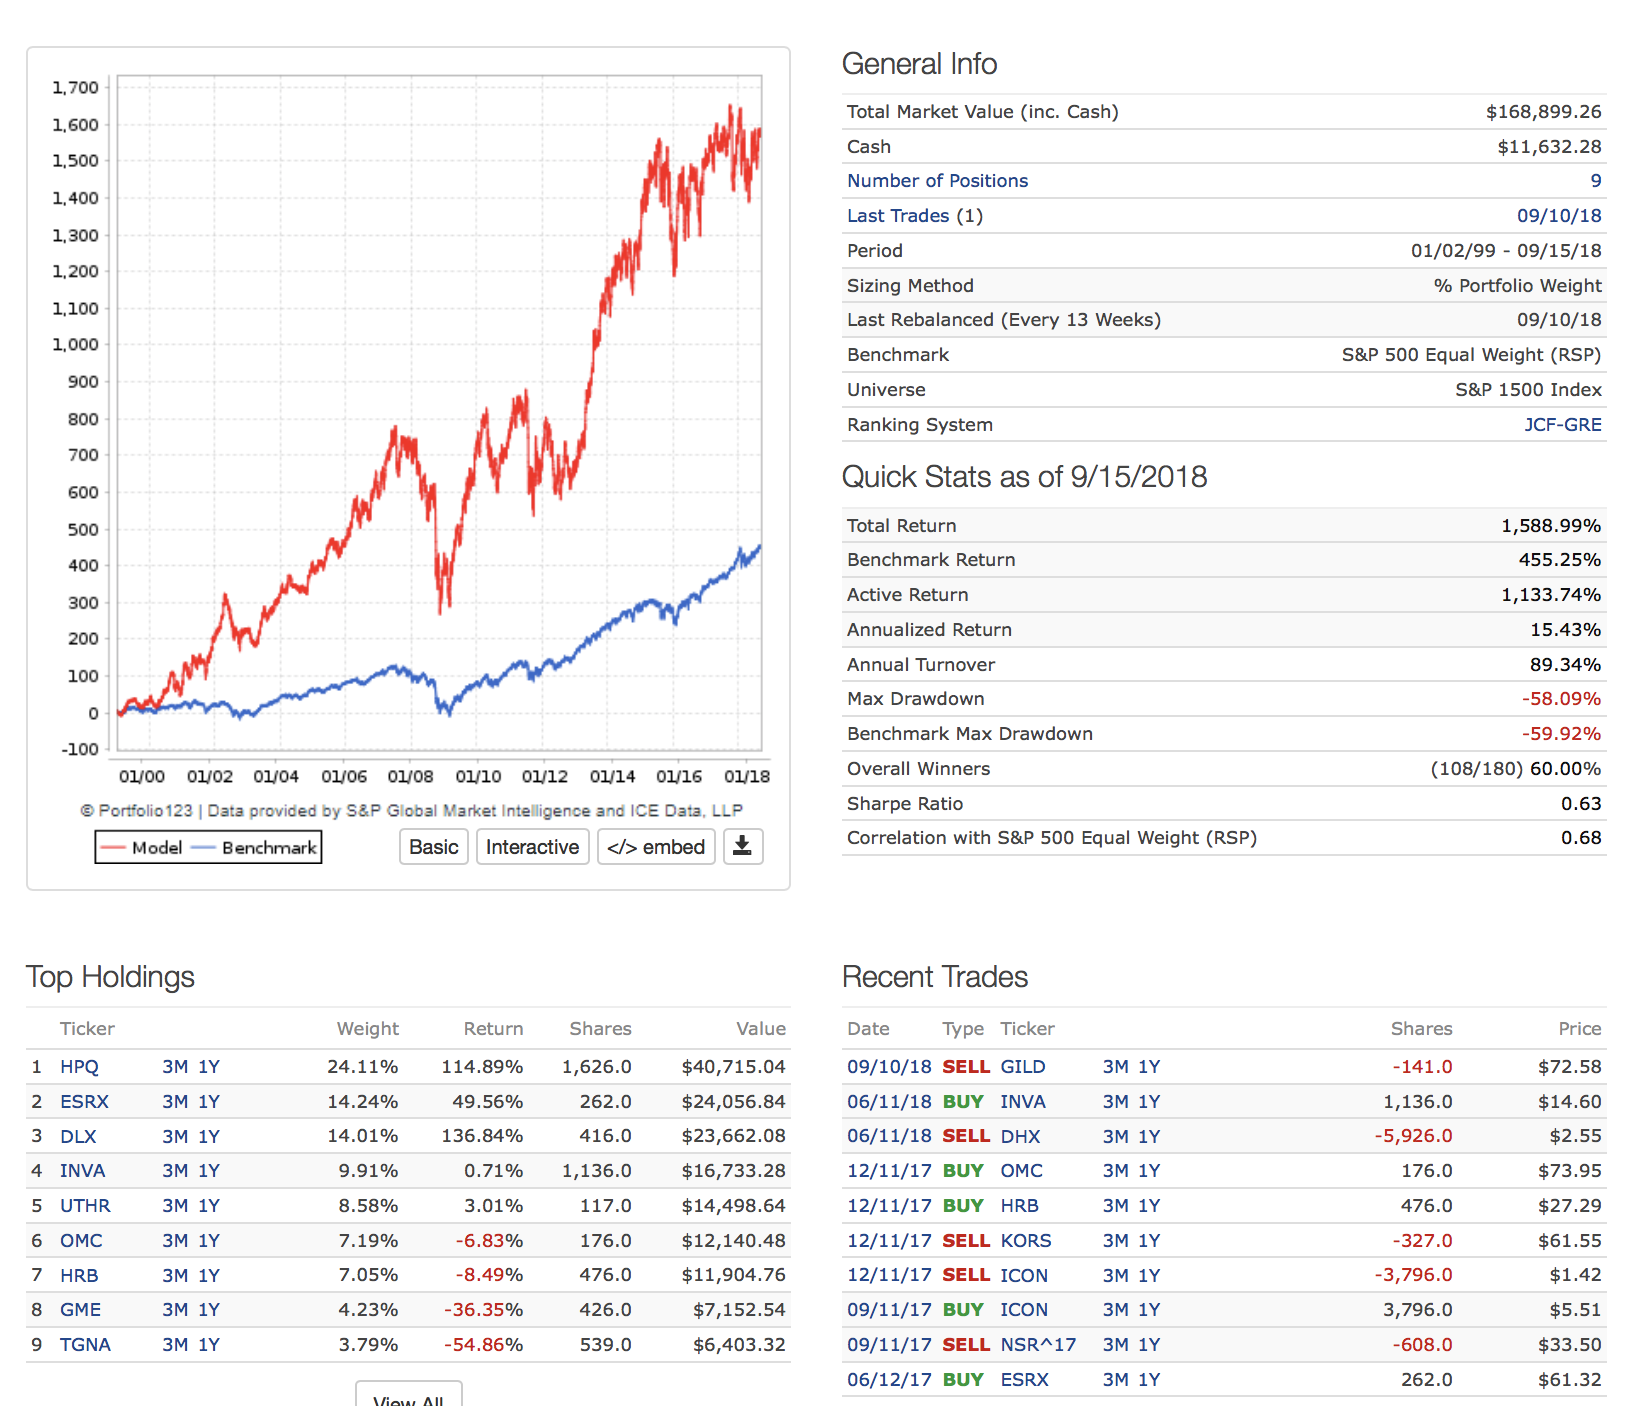
I did all what you suggest, Love the part of the RSP, and the result it’s great. In fact when applied to the 20 years sim the results are pretty good, around a 20% profit annualized.
Here the 5 years backtest.
Thanks Spaceman, very good points.
Monday - it looks like you have switched from the S&P500 to the S&P1500 stock universe or is it my imagination? It’s best to stick with one universe until you exhausted your investigation. Can you put up the same sim but using the S&P500 universe? I also suggest removing the hedge for the time being. The hedge can be added back later on but it is best to work with the underlying strategy until you have gone as far as you can with it.
If you want to stick with the S&P1500 then you may want to add back some liquidity rules as you will end up holding some lower liquidity small cap stocks.
Hello Steve.
Work done!! ![]()
I just mixed your instructions with the ones from Yuvaltaylor and because of that I place the s&p1500 universe, but that was a mistake.
Just I would like to ask you why do you prefer the RSP as a benchmark than the SPY? The only difference I can see between them it’s that the RSP offers more performance on the long term.
Since you are designing a portfolio with equal weight holdings, you want to compare against a benchmark with equal weight holdings (RSP). SPY is MktCap weighted.
Steve
Your turnover is 21%. That seems to be quite low. What is your sell rule?
Not a very impressive rule I should confess, just Rank<70.
OK - your sell rule is great. My only concern is that it is almost a buy and hold forever system. The system may not be so great but look great because you lucked into the right holdings. So you have completed Step1. But don’t go out and invest your money just yet!
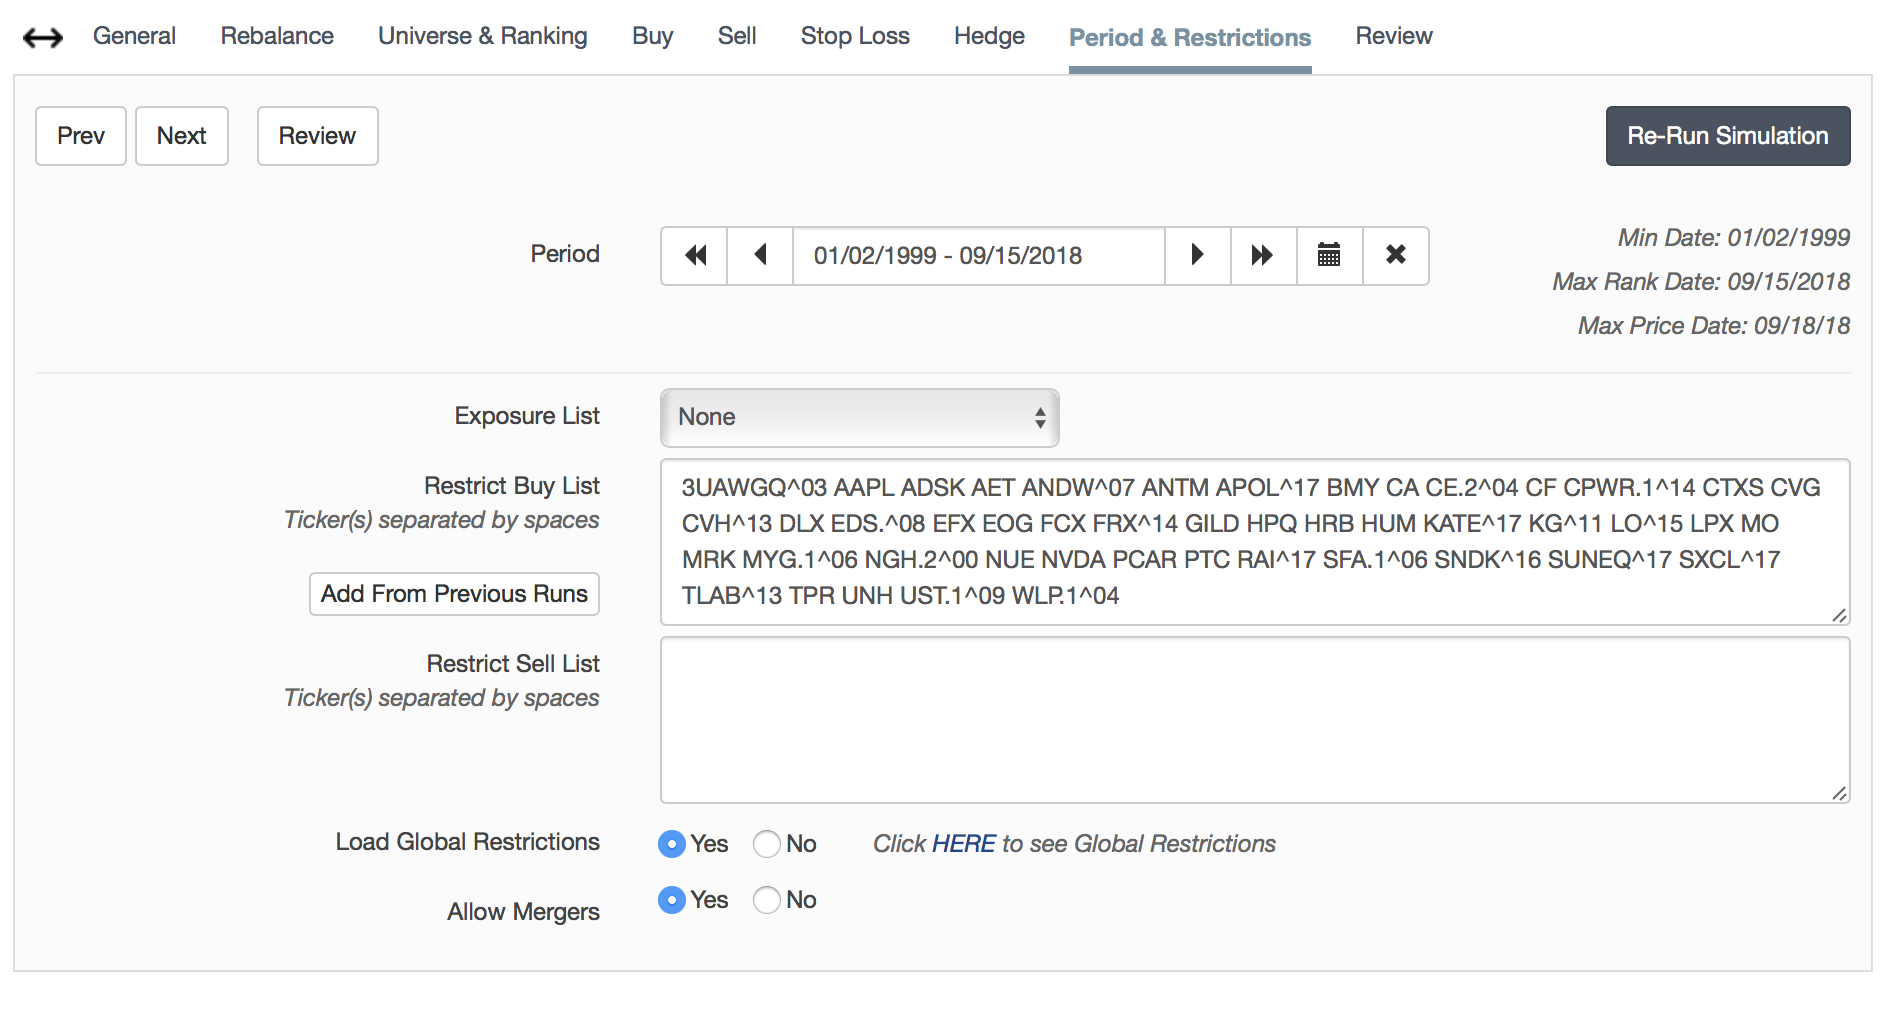
The next step is to see how your model degrades. When you run the sim, there is a button on the period/restrictions tab that allows you to exclude all the stocks that were bought during the last simulation. If you click on the button, then re-run the sim, you will get a new set of results with different stocks. Capture the results and keep repeating this exercise until there aren’t enough stocks left to run a sim.
Steve
Great trick Steve!!
I did it, but what is the purpose of this?
Maybe to realize how “strong” is your system? If so, I think mine is very weak.
The annualized return for the first run was 16.77% and then goes down, every run, to 10.14, 10.61,12.98, here breath for a while with a 15.60 return, then 16.90, and then goes down again to 8.30, and at the next run was 1.78. The last one becomes worst. But it still gives me the chance to run the sim.
Maybe my rules are not very restrictive?
Also I would like to ask you why you said my sim is “almost a buy and hold forever system”. If I have a rule that rebalances the sim every 52 weeks, This is not going to change all positions once a year?
I guess if the companies do not change their fundamentals in that period of time the sim do not sell the stocks… but we are talking about the Greenbladt system here, and it is what Greenbladt said we must do, doesn’t he?
I didn’t realize you were rebalancing yearly. With a 21% turnover, you are essentially keeping 4 out of every 5 stocks and selling one each rebalance period.
Analyzing the degradation with the reduced universe is a bit of an art, but I like to see the equity curve, drawdown characteristics, etc. But from your description of what is occurring, it sounds like you should be able to do better with a full universe of stocks. You could now consider rebalancing quarterly or every 4 weeks and apply sell rule(s). There are things you can do to pare down overweight holdings, sell non-performers, etc. It is all up to your imagination and what you want to get out of it. When you update your system and get results you like then go through the degradation testing again and see what happens.
Hello Yuvaltaylor.
I tried what you suggest, in the ranking system and in the sim, and here the results and the process. I think they are little bit worse than the previous sim.
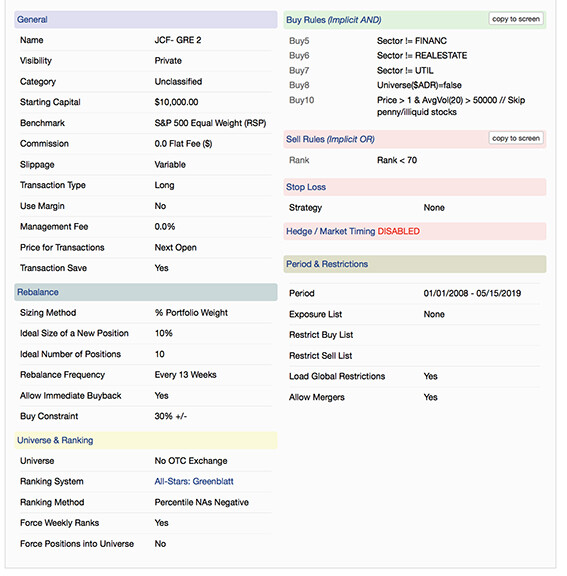
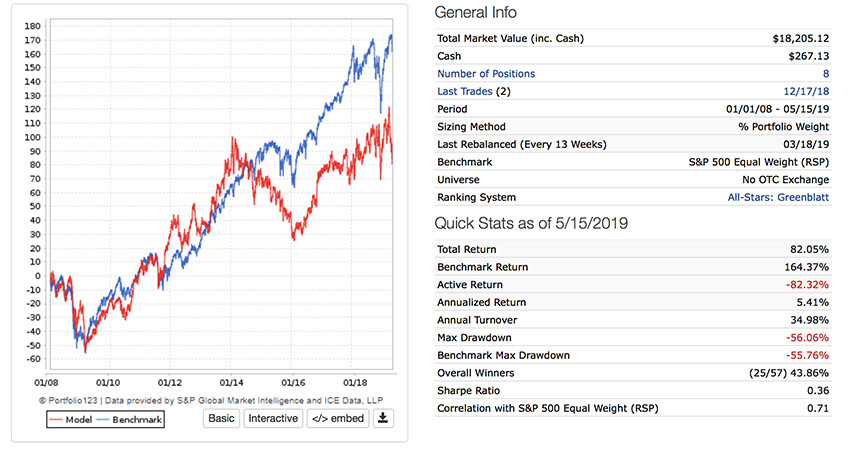
Steve, here there is the sim (with all your instructions) and the results since the last time we talk about it, in september 2018. Also I attach the results of that sim from 2008 onwards.