How high would the R^2 get do you think?
1 Like
The common indicator is the correlations of long-short factor returns. Maybe you should read some papers
So in conclusion, SIR/IO is very loosely (and maybe not at all) related to short fees, and once again, it would be very helpful to have actual short fee data!
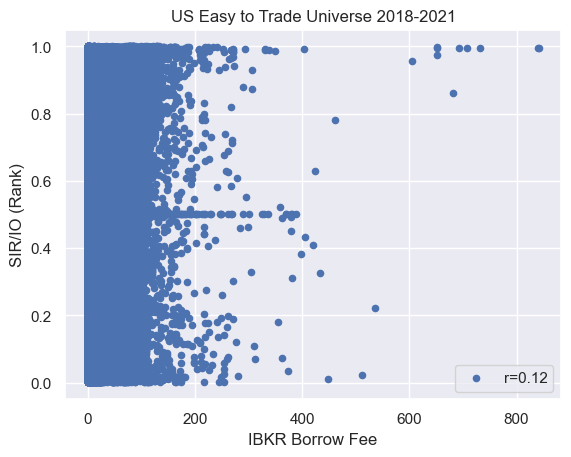
I don't have access to raw data for institutional ownership, but I computed the rank normalized SIR/IO (a proxy for the proxy, if you will) for the same period and the correlation to IBKR borrrow fees rises to 0.12.
If we get the FactSet short financing rates integrated into p123, I'll check again how well they correlate to IBKR fees.
Your lack of correlation may not be in a good way.
The real key is always "how much incremental information" and "the correlation of the factor returns", not "the correlation of the original values of the features". This is because the low correlation of the raw values of the features may be the result of so-called "noise", i.e., differences that do not lead to predictive targeting, whereas the new factors do not lead to much incremental explanatory power beyond that even if those factors have low correlation with the old factors.
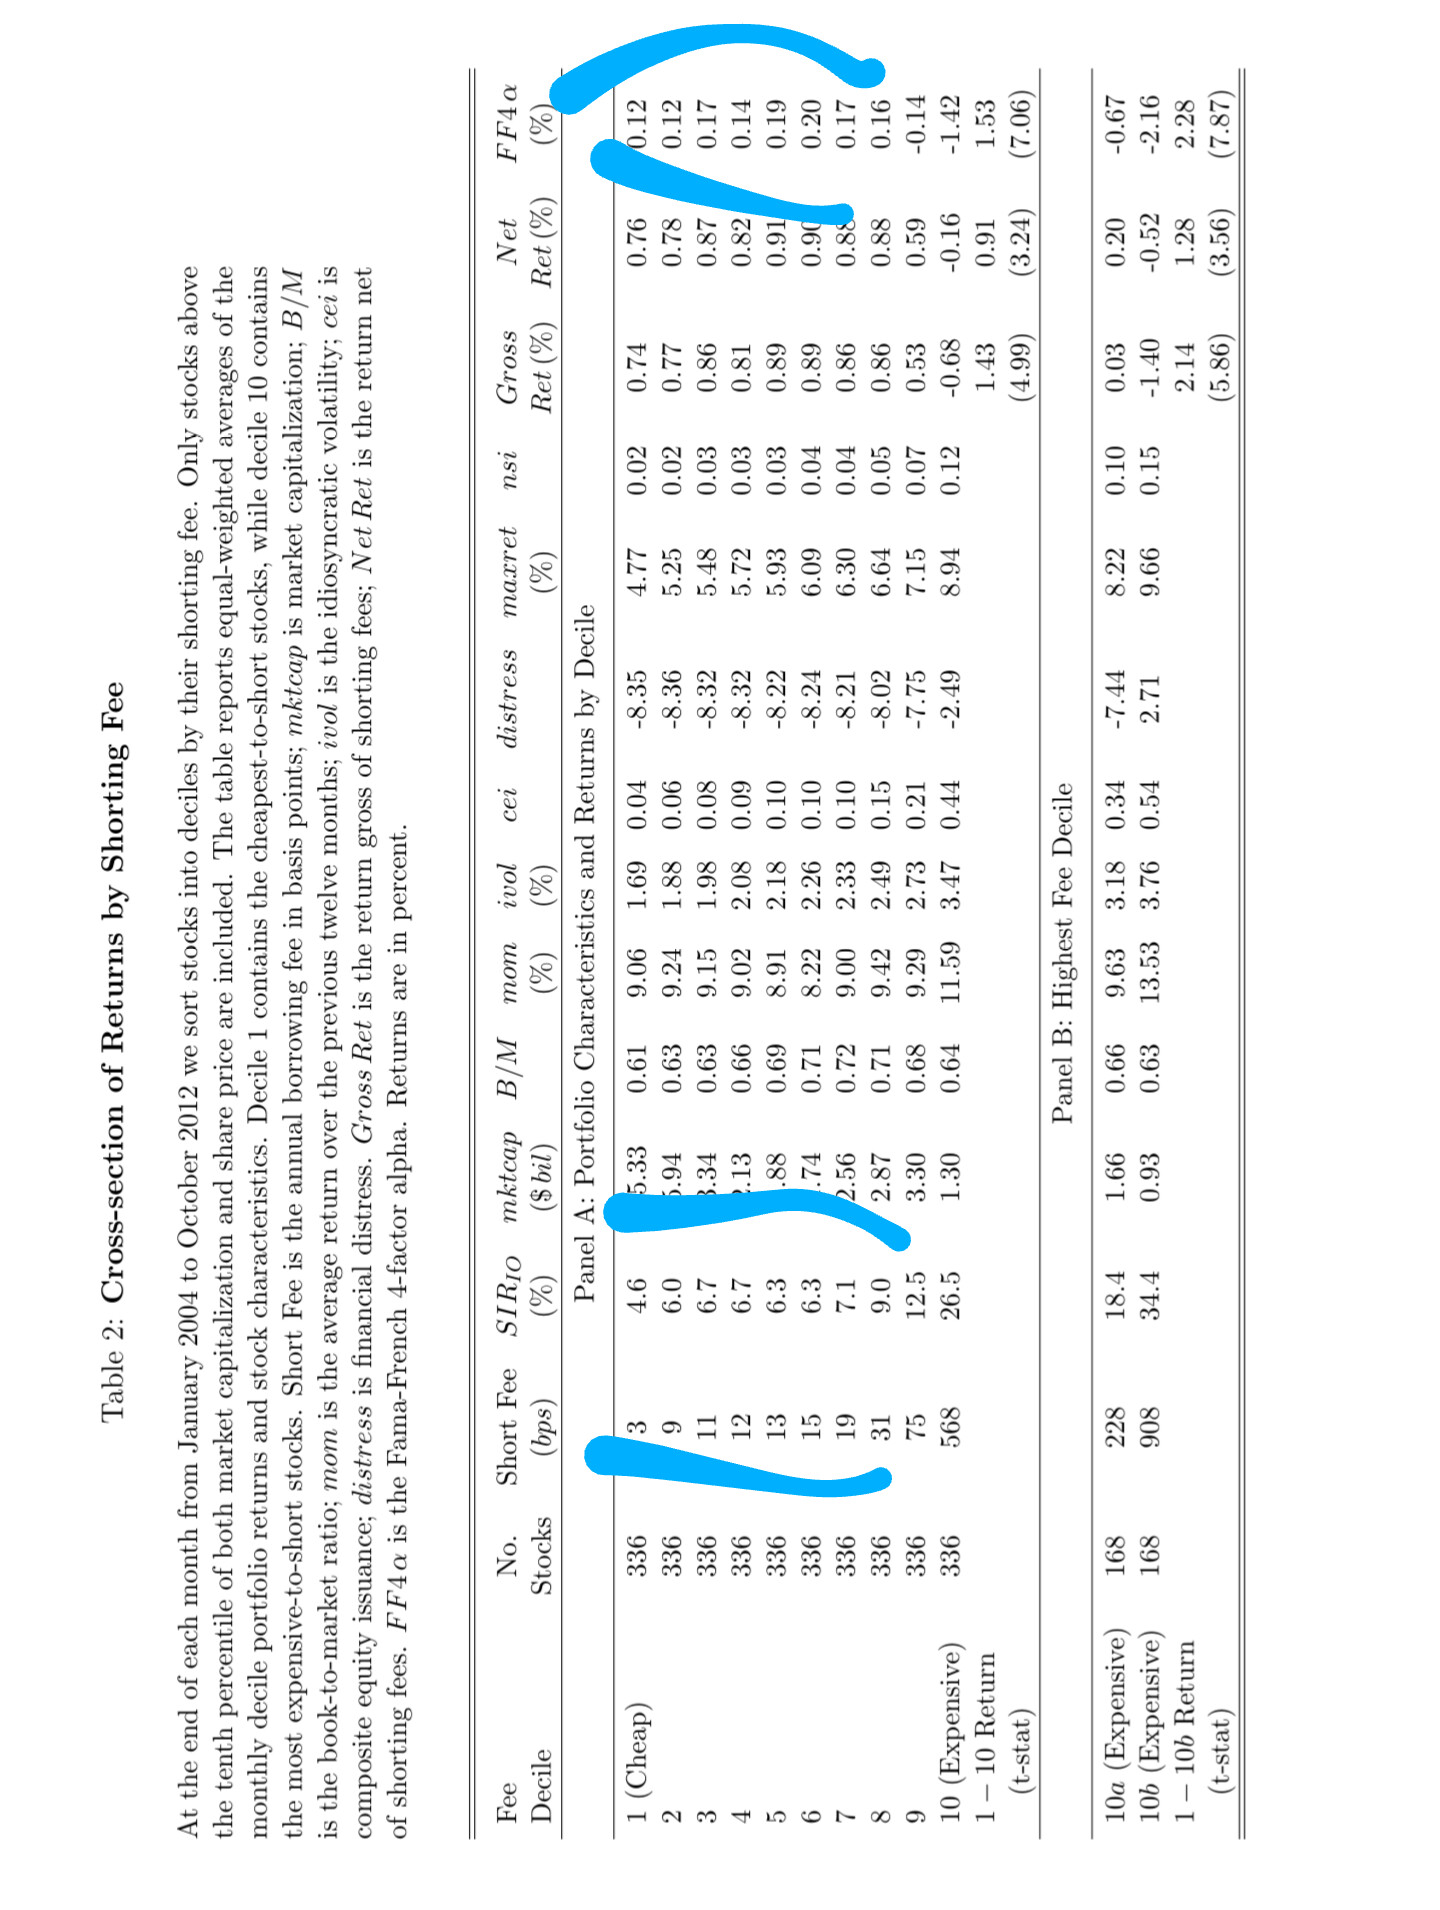
As shown in the figures, it is true that there is a lack of correlation of raw features between borrowing costs and SIR/IO when borrowing costs are moderate. This is also accompanied by a lack of monotonicity in the relationship between borrowing costs and returns there.
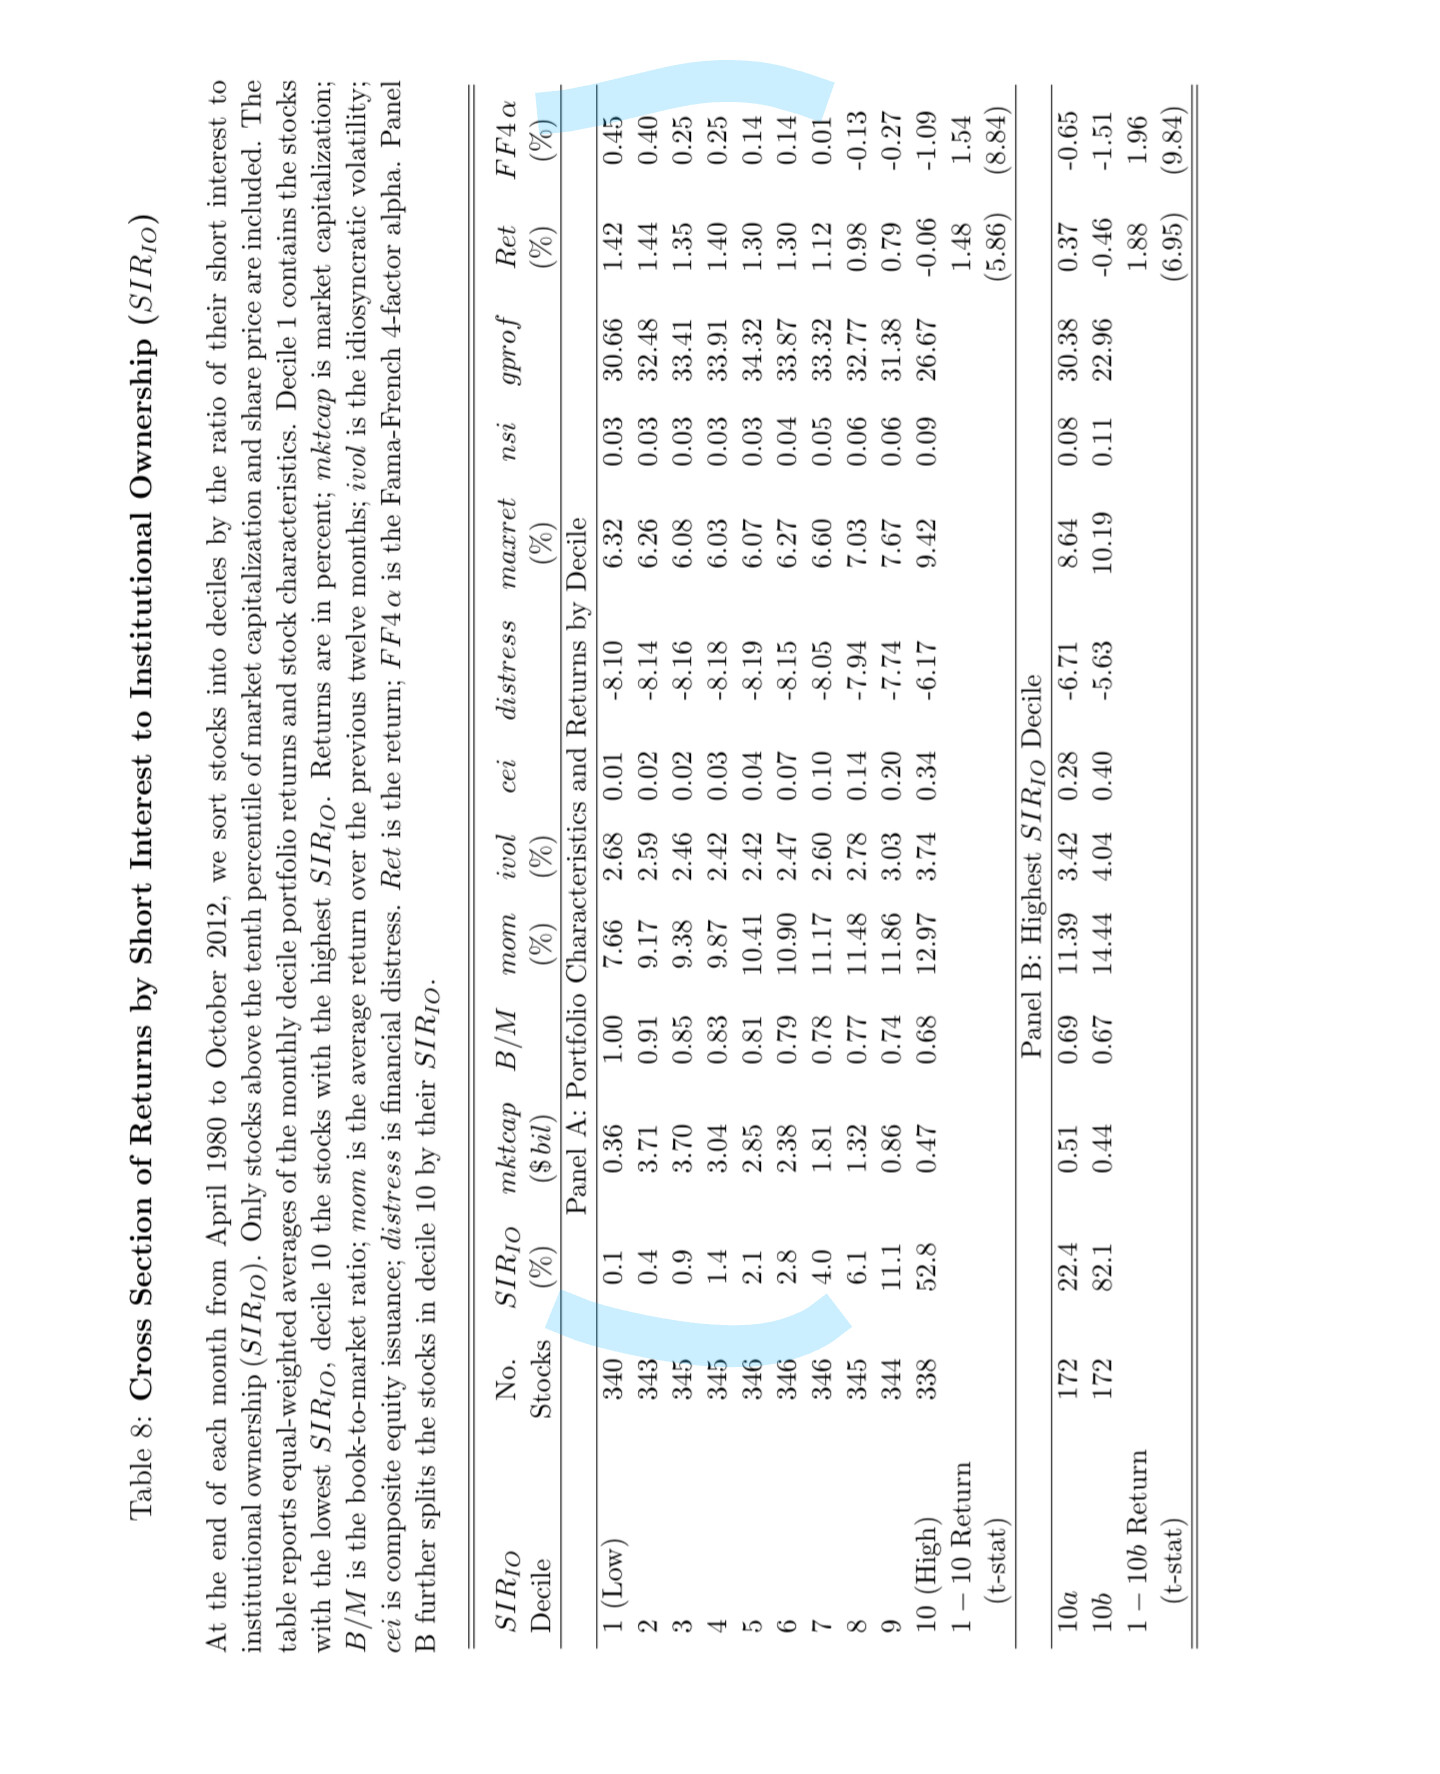
Whereas the relationship between SIR/IO and returns seems to be more monotonic at the long side. The two cover different time periods, though, so they may not be very comparable.
The correlation between SIR and borrowing costs in another paper is 0.2 and your correlation is lower than that.
And it looks like the advantage of the cost of borrowing indicator over SIR/IO is mainly at the short side, but this is offset by higher borrowing costs by definition.
Where the cost of borrowing data would be very useful is in forming profitable shorting strategies from it, rather than as a factor on its own, but the former has been talked about previously. My point is always that "There is a lots of signal in short lending fees as far as I can tell" is wrong, especially when you have short interest features already
Here is also a paper that may interest you.
The coefficient on the option-implied
lending fee remains highly significant even when other variables such as the actual lending fee,
loan utilization, short interest, and the short fee risk measure proposed by Engelberg et al. (2015)
3
are included in the regressions. Of all of the variables we include in the regression models, the
option-implied lending fee is the most significant predictor of stock returns.
But thanks @ZGWZ for your formula, for me it works fine as a proxy, i checked a lot of stocks that have a higher ratio and nearly all of them had also expensive options, which according to the paper i posted is also a good predictor of forward lending fees, which is probably even more important than current lending fees. Sadly a lot of the returns in my short system came from these stocks.
1 Like
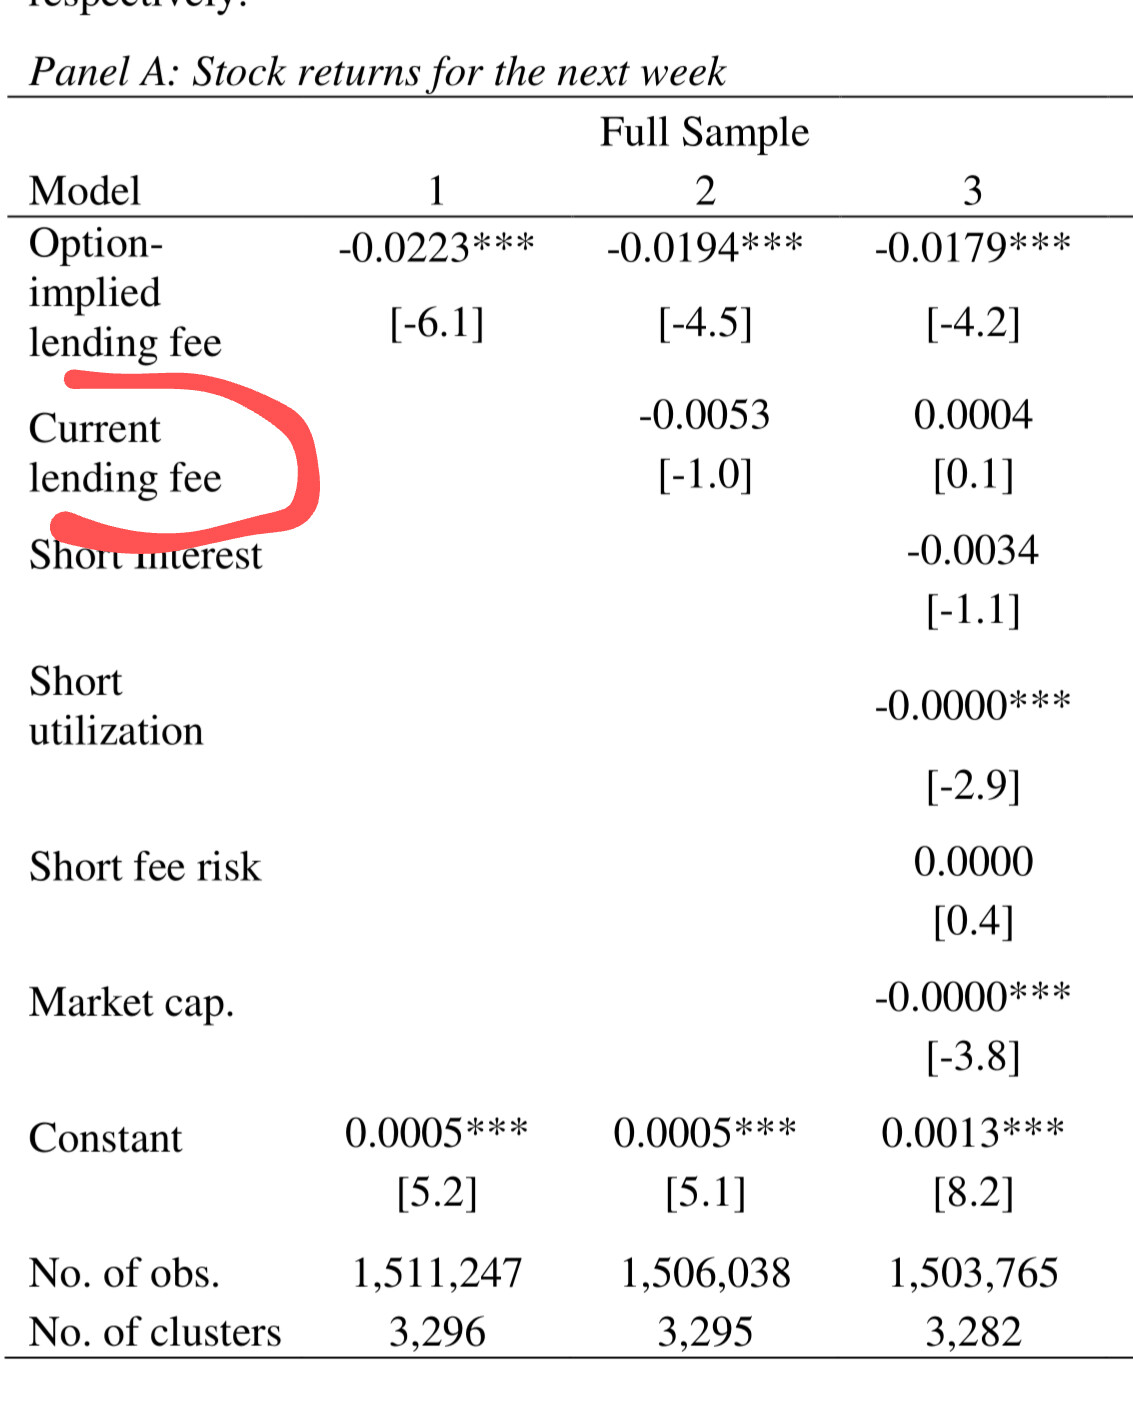
So option implied borrowing costs are important, but current borrowing costs are not.
And the effects of them are mostly reduced by the lending costs as you said
Yes, it would be nice to have option data.
Combining this with the last 5y of data of IBorrowDesk, gives the last 8 years of data for US markets for a decent price (read: almost free).
That could be an interesting start to add short lending fee and share availability to P123. IBKR is relatively expensive for shorting I read, so filtering out stocks to short in a universe would give a conservative estimate of the stocks that are available for shorting at a limited borrowing rate.
1 Like
IBorrowDesk is $500 isn’t it? plus the data comes in a zip archive with 1 security per file so how do you get that data into p123?
By almost free I meant if P123 itself would want to implement it platform wide.
To do it yourself as a user would require reformatting the data, uploading it via stock factor uploads and then updating it by fetching via the ibkr api and uploading via the p123 api with a set cronjob.
Anyone here @pvdb @SUpirate1081 I wish iborrowdesk was reliable but it just isn’t does anyone here have the IBKR borrow list from 2021 til mid 2024/25? iborrowdesk can get me to mid 2024, but even with their membership it flakes quite a bit and doesn’t always allow you to download all 5 years. Can’t even find it at any datasets…I would be deeply thankful to anyone here who has it. Thank you! I will share more on here if someone has it anywhere. Thanks!
Update, the only way I know of to get reliable shortable shares/borrow fees historical for IBKR is through quantrocket now.
I have discussed with the owner of iborrowdesk and he has pretty much abandoned the project, so even if you pay the $10 there will be hundreds of tickers that still cut off at 1 year, and the full dataset he says is there is not there and the button does not function.
Quantrocket says that the datasets are “free” but that is only after you purchase their upgrade at current $299 a month. I kept missing the tiny switch to monthly grayed out buttons on the left side of the screen thinking that I had to buy the annual membership.
I did sign in with my IBKR account but am unsure/doubt that is necessary
Once you upgrade it is simple after the docker setup:
- put in WSL:
quantrocket master collect-ibkr --countries US --sec-types STK ETF
quantrocket fundamental collect-ibkr-shortshares --countries usa
3)
quantrocket fundamental collect-ibkr-borrowfees --countries usa
4)
Stream the download:
quantrocket flightlog stream -d
4)
quantrocket fundamental ibkr-borrowfees
--start-date 2018-04-15
-o /mnt/c/Users/Public/Downloads/qr-ibkr/us_borrow_fees_daily.csv
any chance you could share that quantrocket data?
I’m a previous quantrocket subscriber, and while I do have IBKR borrow fees from April 2018 through July 2022, I don’t know if we are able to redistribute it even thought the underlying current data is freely available from IBKR. My CSV files were also ticker-indexed, as I attempted this before p123 implemented FIGI support, so it may have some failed ticker mappings.
When I imported a stock factor from the IBKR borrow fees, I ran into a couple issues:
- I hit the p123 limit for imported stock factor rows – not sure what the limit actually is, but I remember it being tight at the time. That said, it looks like maybe I did not downsample my fee data from daily to weekly which would help quite a bit.
- There is no ability to account for the borrow data fees in the strategy costs, so you are limited to using it as a Buy/Sell filter or as a factor in your ranking systems.
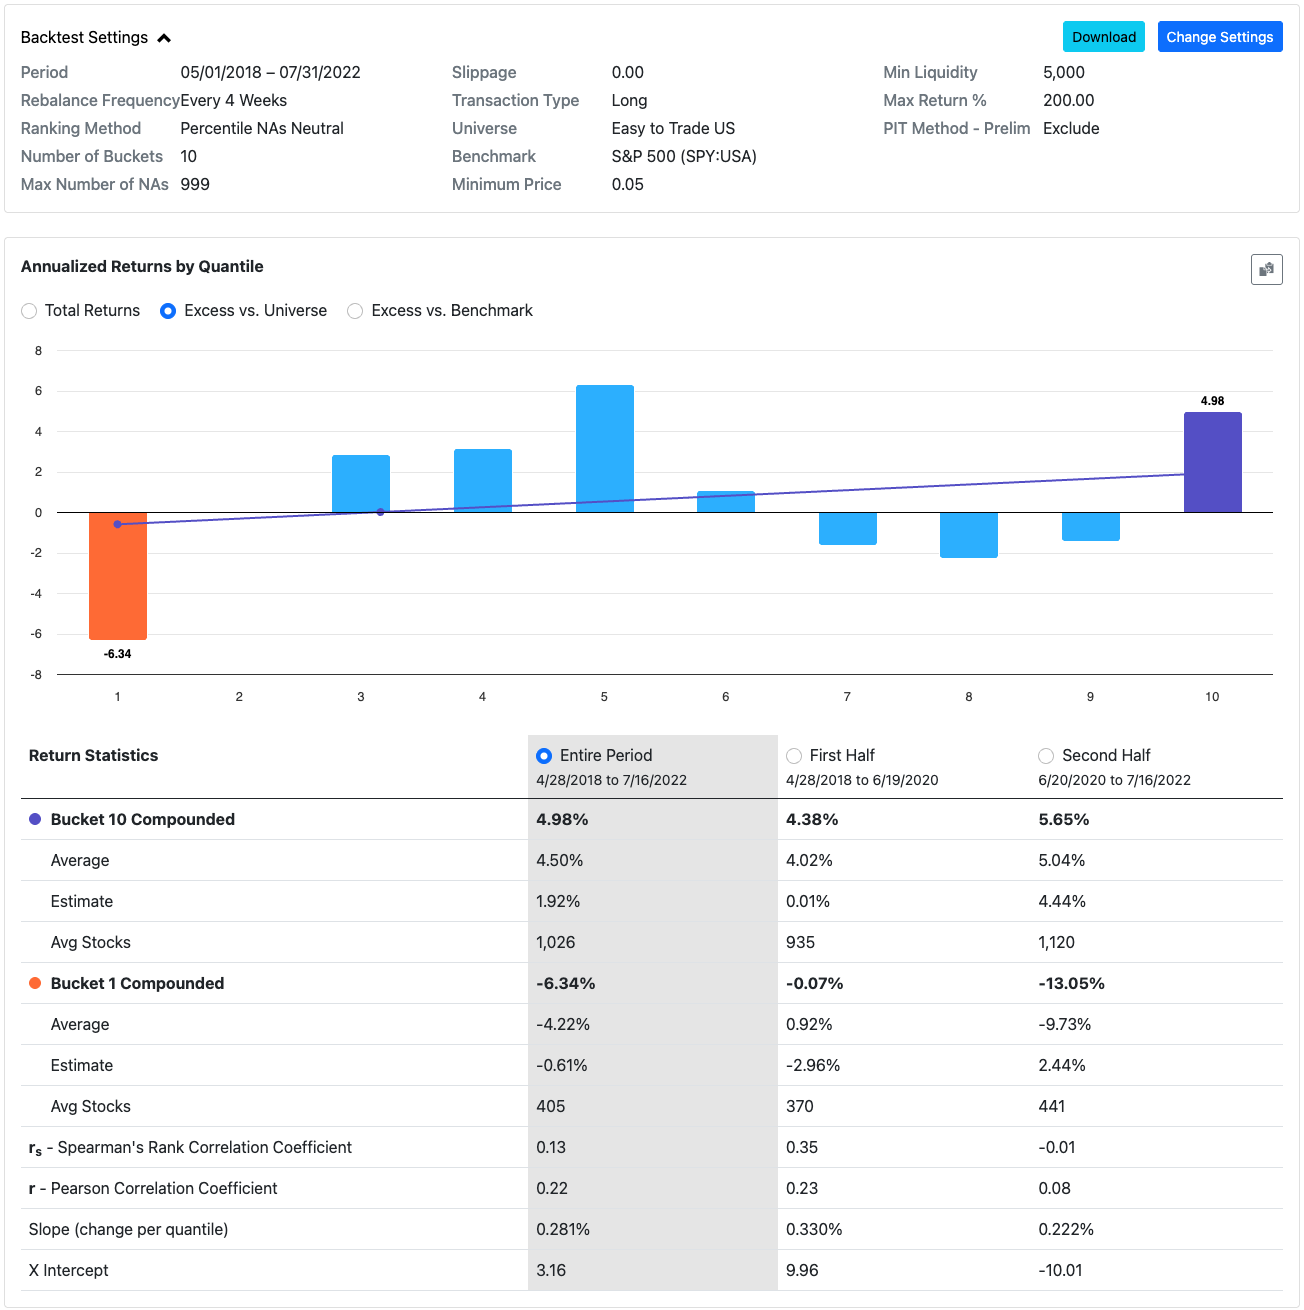
Rather than have N users create N copies of these borrow fees, I think this is a highly useful dataset that is worthy of being a sponsored project. Even if you are not shorting, there is potential utility for your ranking systems. Here are IBKR borrow fees as a factor (lower is better) for May 2018 through July 2022 on the Easy to Trade US universe:
Here’s how I’d implement this project if I were p123.
- Set up a pipeline job to start daily archiving the raw borrow fees and available shares from IBKR’s public ftp. Collect all country files to future proof when Asia/Emerging is implemented.
- License the historical data from Brian at QuantRocket to do a one-off backfill.
- Create two new new factors: IBKRBorrowFee and IBKRShortableShares factors. Going forward, the factors would be updated by the daily p123 pipeline job (pulling from IBKR ftp).
- Make the strategy “Margin Carry Cost” a formula so that you can implement more accurate costing in the strategy using ##FEDFUNDS (for short sale proceed interest) and IBKRBorrowFee for stock-specific borrowing costs.
If this can be a sponsored project, I would contribute.
@feldy what is the advantage of this set up versus P123 licensing the global borrow data from factset, building a parallel process from IB and then creating a proxy of IB data vs Factset to backfill pre 2015 (when factset borrow data starts)?
That's not a big deal. we have historical tickers
This is not a small project.
But what's the main use-case of this data? You want to use it in a seamless, all-in-one long/short portfolio strategy backtest, no? So shouldn't the L/S strategy backtest come first ?
We have started the L/S project. We will add separate buy/sell rules (similar to the screener), and support having two ranking systems. For the borrow rate we were planning to use some widely accepted formula.
That’s great to hear. A few weeks ago, I definitely would have agree that a combined L/S strategy is probably more important, though maybe less so now that simulated books support leverage. This bug with the Manage strategy performance for short positions I think is still present, and is a showstopper before I would reconsider re-enabling shorting.
The use case for adding per-stock IBKR borrow fees is to build more accurate simulations for short strategies. The current system only allows a single carry cost that is fixed across time and across assets. Unless you are restricting your universe to easy to borrow names, your broker may charge you 1% annualized to borrow one name, and 100+% to borrow the next. As-is, these short strategies may be tilting towards these high cost names as they are blind to the true transaction costs involved.
I can’t see enough detail on FactSet’s global borrow dataset to tell. Unless if gives you the granularity of borrow costs at per-broker, per-symbol lvel, then it wouldn’t be as useful for the modeling accurate borrow costs as these can vary so widely across executing brokers. Still could be useful for alpha/ranking system use though.
I do not believe it shows the costs per broker but rather focuses on the most reliable cost and availability metrics across the market, per stock.