The first quarter AMZN reports down revenue, Q to PYQ, they will nosedive. For them and analysts, it is all about market share and revenue share.
I recently ran across an article in Bloomberg titled, “The Math Behind Futility,” which includes a video interview with Rob Arnott (CEO of $161B Research Affiliates) and a discussion of why 90% of active managers have failed to beat the S&P 500 over the last 15 years.
In the video, Arnott states that the reason that benchmarks are almost impossible to beat by money managers is that there is a positive skew to market indices from a very small portion of companies in the index. It is that small number of companies that are “home runs” that skew the indices higher, not because the average stock is moving higher. If an investment manager doesn’t hold those few companies that are causing the positive skew, the manager will underperform the index. (The same thing applies to us beating our p123 portfolio benchmarks.)
Likewise, there is not a “small-cap effect,” it’s just that the few small-cap stocks that are “home runs,” tend to skew a small-cap portfolio more than a large-cap portfolio (because of the size differential of the basis). Arnott states unequivocally that the average small-cap stock does not outperform the average large-cap stock and also that there are no real “winners” in stock picking when considered as a whole.
I’ve been watching the Value Line Geometric Index ($XVG) for many years and have been fascinated by the fact that it has not set a new high in the last 19 years, even as the major market indices continue to regularly set new highs, particularly recently. The 1,675-stock Value Line Geometric Index gives equal weight to each of its components, while the S&P is market-cap weighted and the Dow is price weighted. The Value Line Geometric Index assumes an equal dollar investment in every security and is rebalanced daily. Geometric averaging provides a realistic representation of how the average stock is performing.
This chart shows the Value Line Geometric index since 1975, with overhead resistance at 510-530 for the last 19 years:
Here is a zoom into the last five years performance:
The challenge we continuously run up against, in attempting to put Portfolio123’s wealth of features to use, is that the regime of the market is constantly changing. It changes throughout the business cycle with a steady rotation of sectors that are performing well. It changes with regard to assets that are the best performing at any given time and many other market and economic factors that regularly fluctuate and greatly affect the stocks in which we have invested (to the consternation of many of us).
Individual stocks used to be the investment of choice, and the consistent selection of good companies at good prices served an investor well. It was, for example, the source of Buffett’s immense wealth. However, today that’s not the case as 70% of an individual stock’s price movements are correlated with the movements of the ETFs that hold it. You can have a sure-fire investment algorithm that is backed with logic from a Nobel laureate, but that doesn’t mean a stock it picks will go up if the ETF that holds it is in a bearish downtrend. Food for thought… and possibly the driver behind the constant flow of funds from active managers to passive ETFs these days.
For me, the recognition of these changing dynamics has meant that I am focusing more time and effort on price and macro factors, rather than fundamentals. Price is the only aspect of stocks or ETFs that is not subject to changes in investor’s focus, appetite or market regimes. An algorithm based on price is not affected by whether an investment is in a declining sector, an out-of-favor market, or any other categorization. An algorithm that works on one investment’s price will work on any investment’s price. Creating algorithms around price also do not force me to be dependent on other investors eventually noticing when the fundamentals of a company suggest its price should be higher, for me to realize a profit.
Chris
Chris, this is a fascinating nugget of information. From what is it derived? Is there a study that shows this? I’m very curious.
If this were true, it might be profitable to be overweight in stocks for which it’s not–stocks whose price movements are relatively uncorrelated with the ETFs that hold them. Not individual stocks, but stocks with certain characteristics that make them less likely to be correlative with ETFs. This would be especially valuable during a market downturn if one remains invested.
I suspect that low-volume stocks are the least correlated with ETFs . . .
Thanks, - Yuval
Denny I have to agree with you I have been in QLD since 2009 and every year it’s my best investment. Every year I think it’s over so I lower my exposure. I am only 33% QLD right now, 33% bonds and 33% S&P. YTD I am 8.5% return 4.5% drawdown. All of the return like you said is FAANG. Hard to stop until there is a major correction.
I looked for the source of that stat for about 15 minutes, but it’s not jumping out at me. In terms of dollars, 30% of all trading activity is accounted for by ETFs. However, for a stock in a widely traded ETF (and the traded volume of the ETF will obviously affect this), there is a ~70% correlation between the ETF’s price and its constituent stock’s prices.
You may be on to something in trying to find stocks that aren’t included in ETFs to buck this price pressure, but p123 doesn’t offer a way to find stocks that aren’t in ETFs. I imagine that this data will be a standard factor at some point in the future, the same as Insider, Institutional, and Short Interest data factors. There are also no external sources of this screening factor, to my knowledge. CapitalCube.com regularly publishes articles related to ETFs with exposure to a particular stock, but not the other way around.
Low volume stocks would be less likely to not be in ETFs, I guess, but then you have to deal with the inherent unpredictability of low-volume stocks. Their price is blown around by a light breeze. However, as Rob Arnott said in the video I quoted earlier on this page, there is no such thing as a size effect and no performance reason to choose small-cap stocks over large-cap stocks, which confirms my experience of increased success when I moved my investing focus into stocks with a market-cap greater than $600M and ADT greater than $8M.
Rather than try to go where the ETFs aren’t, I am instead interested in going where they ARE. If you are wondering where the catalyst is going to come from that will get your undervalued stock to take off, one of the best would be from increasing price and increasing volume of the ETF that holds it.
Chris
Fidelity scrupulously lists the ownership of every stock on its website, including the top 10 mutual fund and ETF holdings. So Apple stock, for instance, is held 47.9% by institutions, 13.7% by mutual funds and ETFs, 0.1% by insiders, and 38.3% by others. Breaking this down, Fidelity gives you the ten largest institutional holdings by shares held, the ten largest mutual funds and ETFs by shares held (along with total holdings, position values, and outstanding shares owned), and details of mutual fund purchases and sales.
I could name ten reasons, at least, but I’ll just refer you to this: Why I Invest In Microcaps | Seeking Alpha (by yours truly) and this: http://osam.com/pdf/Commentary_TrueMicroCapStrategy_Mar-2016.pdf (by Jim O’Shaughnessy). Certainly the stocks that O’Shaughnessy and I focus on are the least likely to be held by ETFs.
While I may not have written it a clearly as possible, I thought it was obvious I meant was that there was no systematic way to screen for stocks that are NOT in ETFs. I did say that there are no pre-built p123 factors and there are no external sources for screening out ETF-held stocks. Obviously, the information is available on a case-by-case basis, but at this time screening out ETF-owned stocks would have to be done manually. At some point because of the incredibly rapid growth of ETFs, there will surely be a common factor listed in all the stock profiles, right along with the ‘Percent Institutional Ownership,’ ‘Percent Insider Ownership,’ etc, with the info on ETF ownership of a stock.
Regarding there being no such thing as a ‘Size Effect,’ I was quoting Rob Arnott from the video, who was referring to a study that his firm, Research Affiliates, did for an article in the Spring 2009 Journal of Portfolio Management titled, “Clairvoyant Value and the Value Effect.”
With due respect, an article listing why you prefer micro-cap stocks over other size companies does not constitute proof that the size effect is real. Nor does the article by O’Shaughnessy provide any proof regarding the infamous “size effect.” Everyone is entitled to an opinion and a preference and that’s what makes a market (I could also provide a matching list of why I prefer larger companies).
Rob Arnott’s statements in the video, as well as the data from his 2009 research, offer the idea that there is no such thing as the “size effect.” He says that on average, large-cap stocks outperform small-cap stocks. A small-cap stock portfolio can outperform a large-cap stock portfolio if all else is equal (except average market-cap, of course), including the tiny number of companies in each portfolio that are “home runs,” and which provides the vast majority of the portfolio’s return. Obviously, the divisor in the small-company portfolio is less, making it possible for a small-stock portfolio to sometimes beat a larger-stock portfolio (but perhaps less likely because of the relative unpredictability of small companies). Arnott’s main point (and mine in response to Denny’s post about FAANG stocks causing almost all the S&P 500’s returns) was that a tiny number of companies are the source of the skew that makes market indices move steadily higher. If an investor doesn’t choose this particular, tiny group of “home run” businesses for their portfolio, they will most assuredly underperform the benchmark.
As shown in the Value Line Geometric Average charts above, the average stock has not set a new high since 1998.
By the way, Arnott’s study, “Clairvoyant Value and the Value Effect” states (pg 20) that there is a strong size effect, but not the way you would think: “The large companies exhibit a much lower [C-Value]/price than the small companies.”
Chris
In years where RSP beats SPY, the median stock total return beats SPY too. Outliers are not the reason for manager underperformance of SPY. Outliers are the reason the median does not beat RSP.
Further, while I have not studied it, I would be shocked if the median Russell 2000 stock did not outperform the median S&P 100 stock over time. Fama wasn’t wrong. It simply takes less money to move smaller stocks.
The Value Line Geometric is a poor approximation of the median stock return in their universe. Instead of taking the actual daily median, they multiply the returns of all 1700 stocks, and then take the 1700th root. This always understates the average return, and almost always understates the median return. Because of this, the Value Line Arithmetic was created. It has gone to new highs.
Finally, of course stocks are correlated to index and sector ETFs that hold them. Market performance and sector performance have always moved stocks.
Two-edged sword. If the ETF inflows are greater than a constituent’s business fundamentals justify, then that stock will become a sieve. A pass through vehicle.
Personally, I have no expertise predicting future ETF flows. I’ll focus on stockpicking. This platform has proven itself capable of producing outstanding results in that regard.
There are 38 designer models currently available that: 1) are invested in at least 50% large caps and 2) have beaten SPY over the last three months. On top of that, another 16 of these large cap models have beaten RSP over the last three months (as RSP has trailed SPY).
None of them factor in ETF ownership.
Along the lines of the influence that ETFs have on stocks prices, do market cap weighted index funds (mutual and ETFs) create a natural updraft/downdraft for a stock when its price starts to rise/fall?
Since index funds are passive, they just follow the market. So as active managers (like hedge funds) pile into a stock like Amazon, then the index funds must follow suit and buy more of AMZN, driving the price up more. And as more index funds buy AMZN, it creates a self feeding chain of more purchases. Until active managers start to sell. And then it is methodically driven the other way. Is that how it possibly could work?
If that is true, then index funds create a definite herd mentality and could be driving stock prices up right now. Even with poor fundamentals (like Tesla or Amazon). And when the market moves down, it could drive it down hard.
I think we are in a new era with index funds because the amount of money in them now is much larger than before the 2008 bear market. the next draw down could be more severe due to index funds automatically unwinding positions.
I suspect this is right. When the SP500 finally starts a downcycle, I think we’ll find that “passive” money gets active really quick. It’s easy to be passive when the ride is straight up. I think a lot of this move towards “passive” has been performance chasing.
I don’t think so. If the price of a stock rises and the number of shares remains the same, the market cap rises exactly proportional to the price. So as the price rises, the number of shares in a market-cap-weighted ETF remains exactly the same. Ditto with a fall in price. ETFs don’t buy more shares when the price goes up. Also, I think indexes rebalance quarterly. Equal-weighted ETFs, on the other hand, have to buy and sell large amounts of shares every quarter, selling shares whose price has gone up and buying shares whose price has gone down. In other words, they buy low and sell high.
ETFs adjust the number of shares of each stock held on a daily basis to match the inflows and outflows of the ETF. If the ETF gets in $1 billion dollars of inflow today, that money doesn’t sit there in cash for a quarter. It is put to work by buying shares of the stocks of which the ETF is comprised, typically weighted by market cap (or however the underlying index is handled).
It used to be, back in the old days (pre-2000) that even though a sector was down, there would be a few good companies in that sector that would buck the trend and go higher based on rising earnings, improving fundamentals, etc. NO MORE. Virtually all the stocks in a sector stay down now if the sector is down, and that’s largely because of the effect of ETFs on these stocks. Exchange Traded Funds wield more capital than hedge funds now and with $7 billion of new assets pouring in each week, they are regularly setting new fund flow records and will soon be larger than the stock-picking dinosaurs (mutual funds).
Look at flows of assets in the market. There are a number of good sources available from Google. The market continues to set new highs every week, but individual investors are pulling money out of individual stocks in droves. As I mentioned, $1.2 trillion has also come out of mutual funds with $1.4 trillion pouring into ETFs. Where’s the demand coming from that is driving the market to constant new highs? I’ll give you one guess (hint: 3 letters).
Eventually, stock picking may one day be something from market history you’ll tell your grandkids about. I’ve been in this business for 35 years and I can see that the future will be largely about ETF selection (which can also be done with p123) not stock selection. P123 Designer Models have fewer subscribers, investment newsletters are disappearing because of lack of demand, Wall Street continues to radically downscale staff/brokers who previously dealt with individual investors, brokerage houses are closing. I think we are seeing the final years of individual stock picking.
You can’t fight the 800-lb gorilla. Adapt and survive…
Chris
Chris,
Interesting comments.
Based on your remarks, what is your proposal or course of action ?
I have been moving all of my investments to ETF-based portfolios. There are a number of very smart p123 members who use, perhaps exclusively, ETFs for investing and have displayed some great portfolio systems in these forums that provide steady, strong growth of principle with very limited drawdowns. These people include (but are not limited to) Georg Vrba (Geov), Steve Auger (StockMarket Student), Florian Maurer (SevenSisters), and several others.
I find that I am far more confident in my ETF system’s selections than I am with an individual stock port. For years (decades, actually), I was checking the charts of each of the stocks in my ports each day the market was open, just to see if a company-related disaster had appeared out of the blue to knock one of my stocks down by -15%, -20% or more. I no longer do that with my ETF ports because the individual stock risk is gone. My returns are just as good, and I can count on those returns in good times and bad because of systems that rotate into the optimum ETF at the optimum time.
I can dramatically eliminate the severe drawdowns caused by the long-only losses that individual stocks incur by systematically rotating into that segment of the market, represented by an ETF, that is climbing as stocks go down. This was the original subject this thread when it was started, and my prescription is to use ETFs to nearly eliminate those drawdowns. It’s not necessary to use inverse ETFs either, as there are many options to choose from (such as fixed income, volatility, Consumer Staples or Utilities sector ETFs, etc.) when long-only equities are declining.
While individual stock investing will still be around for some time (perhaps as long as there is a market), big money ($trillions) is moving away from individual stocks, away from mutual funds, and into ETFs. Every day for some time it seems there are a half-dozen articles about this in the media, so it isn’t news. The acceleration of the trend is news, though.
Fortunately, p123 makes it possible to create ETF portfolios just as sophisticated as stock portfolios. So I’ll be here for a while to come, challenging myself to build the best ETF systems I can. I have a few more years before I’m ready to call it a career and for me at least, ETFs have opened up a superior way to invest.
Chris
Chris, you are correct. Now with the Beta rebalancing options we can get rid of all the Buy/Sell Difference trades which ETF models are more prone to than stock models.
What has been promised years ago, but never implemented, was to add a Hedge module for ETF simulations and ports. Perhaps the P123 team will find time for this soon.
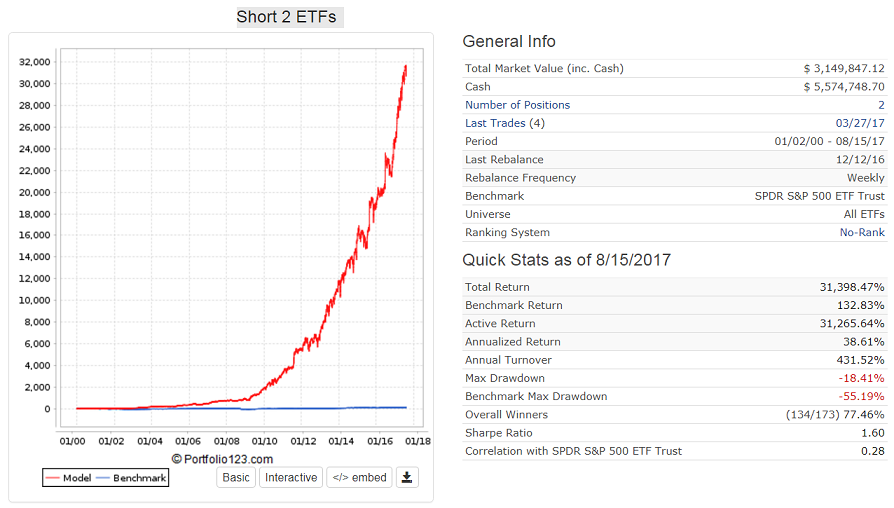
In the meantime I have designed a very useful short model. It uses ETFs only, has an annualized return of 38% with a max D/D=-18%, and only 173 trades. Short models are not allowed as DMs, so I just post the performance here for information purposes…
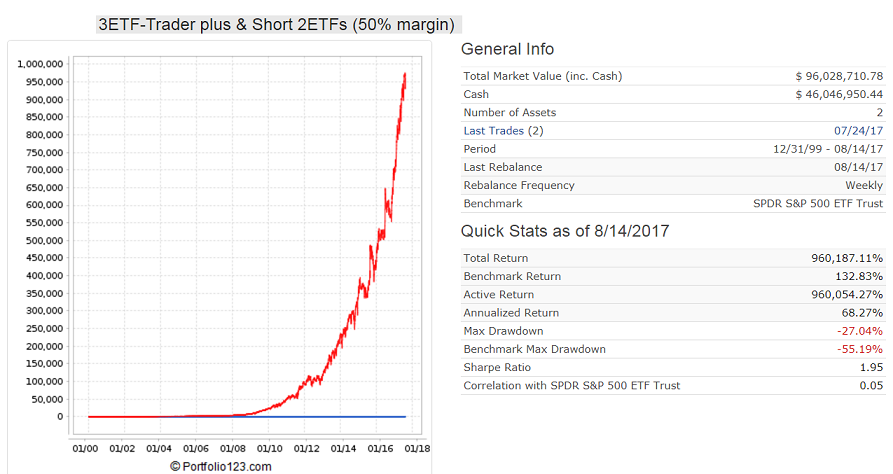
The second chart is for a long/short simulation emulating a short position with a conservative 50% margin using the DM 3ETF-Trader plus and the Short 2 ETFs. This provides a 68% annualized return with a -27% D/D. An initial investment of $10,000 in Jan-2000 would have risen to $96,000,000 by Aug-2017. Needless to say, I follow this model with money.
Wow, Geo, that’s impressive. You have proved my point (again)!
I agree 100% with your comment about the implementation of a Hedge module for ETF simulations and ports. Marco said a looooong time ago that it would be easy to add the hedge module for ETFs. It would really help us make cleaner sims/ports, allow some more creativity, and improve my port performance even more.
However, many thanks to the p123 team for the “position sizing, rebalance/reconstitution” update. It was a much-needed feature that truly helps!
Chris
George,
Very impressive! This, and what Chris said, encourages me to look more deeply into ETF models.
Can you explain your quote above more clearly? What do you mean by the buy/sell difference trades in regards to ETFs?
Thanks!
Sholom
Hi Sholom,
What Geo and I were referring to is the new Beta release of sizing and reconstitution/rebalance options that are in Step 2 (“Position Sizing”) of a sim/portfolio. You can read more about it in the forum thread titled, “OPEN BETA: ‘Formula Weight’ Position Sizing Method .” It looks like there are also a number of related threads that have been started by members around this new feature.
One of the benefits of this update is that it will eliminate the insidious, “Buy/Sell Difference” transactions - i.e., transactions of dozens of tiny purchases or sales of stocks/ETFs to bring a position to the optimum percentage in a portfolio every time there was a rebalance. This commonly occurred when “Allow sold holdings to be re-bought at current rebalance” was set to “yes,” “EVAL” was used in a buy rule, and the Sell Rules were set to “True” (or 1, etc.). This forced a sim to operate more like a screen and as long as the Buy rule was met, a holding would remain in the portfolio.
The “Buy/Sell Difference” transactions were a real problem because they would unintentionally spike Annual Turnover to very high levels and cause a designer to never know the expected actual return of a portfolio when these small transactions were ignored in real time.
Now we can control this aspect and set our systems to not buy shares unless they are a meaningful amount.
Chris
When I was a tyke, the market was dominated by mutual funds, most of them with a large number of holdings. Now it’s dominated by ETFs. There are some obvious differences, of course. But there are some similarities too: they’re institutional, diversified, balanced, and relatively static. So my question is whether the average stock today has a larger percentage of its holdings with mutual funds and ETFs than it did in, say, the 1970s and 1980s. And whether individual stock pickers like the users of Portfolio123–and technical traders, and individual buy-and-hold investors, etc.–discretionary stock pickers, in other words–have a higher or lower percentage of the stock market. I honestly haven’t seen any numbers on this and would love to see some.
Chris thinks that individual stock pickers are a dying breed. He might be right. But from what I’ve seen, the brokerage business is booming like never before. It’s gotten so much easier to invest in individual stocks–you used to have to call your broker, and now you can place your orders online, and for a tiny fraction of the cost. I think individual stock picking is thriving, and that we’re in a golden age. But I could be completely wrong.