Here’s one from Wes Gray:
http://empiritrage.com/wp-content/uploads/2012/03/Value-and-Momentum.pdf
O’Shaughnessy AAII article last fall: http://www.aaii.com/journal/article/what-works-key-new-findings-on-stock-selection
(what is absent is any talk of momentum in this one)
@Jim, curious if you have ever tried running a simulation of Tiny Titans as defined by AAII on P123. I have not taken the time to try it. I don’t have nearly the confidence in AAII data as I do P123 data .
–Tom C
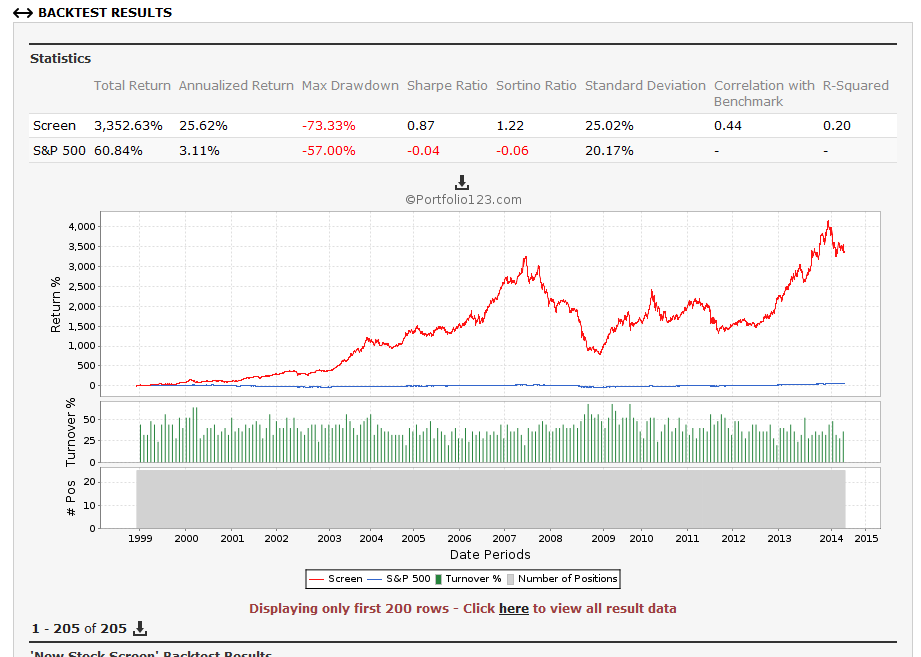
So quick screen without slippage. 25 stocks 4 week rebalance. Is in line with AAII (they do not calculate slippage as you know) but without slippage questionable as a useful port. Also, I do not think I could stomach that drawdown. Took until 2013 to recover from the 2008 recession. Perhaps this is where I got my impression that Tiny Titans has not been working at all recently: perhaps true until say the last year or so. BTW, I am no longer a member of AAII so this is Tiny Titans from other sources and may not be exactly what AAII is using: mktcap >= 25, mktcap <= 250, Pr2SalesTTM < 1, top 25 stocks ranked by 52 week price performance, 4 week rebalance, no slippage
Looked on AAII, added NOOTC and Country(“USA”)=TRUE, ran as sim. Pretty dismal!!
https://www.portfolio123.com/port_summary.jsp?portid=1208534
–Tom C
You can also look at etfs or mutual funds that use this style of investment to determine whether others are able to make this work out of sample. Type in etf ticker, PDP, which is based on momentum. It has outperformed the spy over time.
Scott
Yes! And adding variable slippage to these microcaps did not help the backtested returns either. Not understanding slippage at the time (still not really knowing much) was one of the reasons I never invested when I subscribed to AAII. Good thing I didn’t invest in Tiny Titans at least.
Hi Jim:
Thanks for sharing, good stuff.
Some observations … as I recall O’Shaughnessy advises investors to stay away from the micro caps for a few reasons, chief among them the unfavorable bid/ask spread. It is doubtful the average investor would get the theoretical pricing inherent in these statistical studies and therefore achieve anything close to the sample performance (of course some of the skilled users here on P123 may be the exception). The fact that your screen has no slippage only underscores this point. In other words, out-of-sample performance will likely disappoint.
Obersvation # 2 … these momentum plays are often best paired with a tactical signal that keeps one out of the markets during downturns (e.g., observing moving averages or earnings trends for the benchmark).
Observation #3 … I wonder if the outperformance in small & micro-caps is due for some reversion to the mean. They’ve been outpacing the market since 1999 … we could be at a turning point. Just my $.02.
Thx,
Ed
Another momentum article, released today:
http://www.alphaarchitect.com/blog/2014/07/16/ride-winners-and-cut-losers-period/#.U8apmPldXAk
I guess my observation was that I never could find a strategy based only on momentum that I was impressed with. Even as part of a ranking system, I found that adding momentum ususally decreased returns. Just curious as to what others opinions were given that momentum is a common theme.
“Another momentum article, released today:”
Tom - someone really needs to check the calculations behind the charts that guy is producing. They don’t make sense.
Steve
I also find that sometimes adding momentum to a ranking system reduces returns.
I tend to trust fundamentals more than technicals. I’m okay with including momentum if it fits within the conceptual framework. It can be a bit of an art. Some of my R2G’s don’t have any momentum.
My suspicion is that momentum and technicals in general are more susceptible to over-optimization because they have more parameters to fiddle around with.
I believe there is benefit to using momentum in conjunction with value to help avoiding value traps. Also, the Canadian stocks are much more momentum based.
Steve
Steve,
RE: The calculations do not make sense, could you elaborate more on your thoughts? The results are higher than I expected and taking 30 random stocks instead of using the decile performances is an unnecessary step that does not add value, but I was wondering what your thoughts were.
iavanti
First of all - the spread in CAGR for the momentum portfolios is too tight for 45 years of monthly rebalance. I would expect at least one losing simulation out of 1000. Maybe I don’t understand what he is doing?
Anyways, here is what I believe is an equivalent P123 simulation, except it is rebalanced every 4 weeks instead of monthly.
https://www.portfolio123.com/port_summary.jsp?portid=1209156
One run is shown below. Each run will be different due to the random selection of 30 stocks. I can’t believe I even spent time on this.
Steve
Steve, I got something similar to what you got. I don’t understand either. Although in the simulation alpha was added for the time period.
–Tom C
Tom - True, but the Alpha is negative (-4.5%) over last three years if you use Russell1000 w/Div as the benchmark.
Steve
I think I understand a little better now at least what he was trying to do.
If you are taking random diversified portfolios from the top decile for 45 years, I would think it would be likely to not expect a losing simulation out of any of them for the entire 45 year period. Any one year, sure, any ten years, yes, probably. But I could see it for a longer period like 45 years. Wherever the mean ended up for CAGR, I’d expect the distribution to look something like shown.
I am surprised at the spread however. O’Shaughnessy did an analysis of relative price strength in What Works On Wall Street from 1926-2009, and came to the conclusion that momentum was significant. One example was 6 month momentum. Decile 1 compound return was 14.11%, Decile 10 was 4.15%, All Stocks were 10.5%
Another was Large Stocks Universe, 12 month momentum, Decile 1 11.59%, Decile 10 6.29%, All Large Stocks, 9.69%
But the charts in the article have a much bigger dispersion than that from top decile to bottom.
–Tom C