Dear All,
We released a new function Aggregate(“Formula”, scope, …) that lets you compute your own Sector, SubSector, Industry and SubIndustry averages. It supports CapWeighted and Simple Average. You can also specify several other parameters like trim %. You can find it in FORMULA FUNCTIONS → CROSS SECTIONAL ANALYSIS
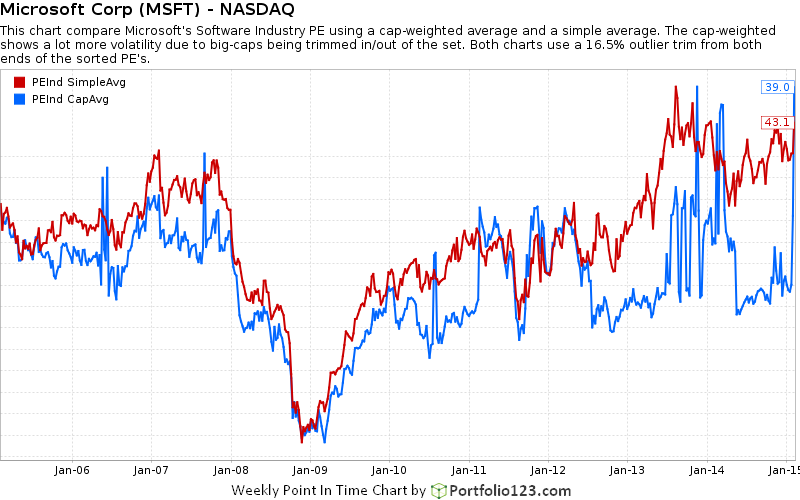
I used the new Stock->Point-In-Time charts to illustrate the two methods of calculating a representative PE for an Industry (yes, the PIT charts can be used for many things, not just for individual stocks).
As you can see from the image below , using CapWeighted results in a very volatile time series. This is due to large-cap stocks whose PE is on the fringe of the outlier trim % which makes them come in & out of the computation.
We therefore will no longer recommend using CapWeighted average for groups. Our current pre-built Industry factors , the ones ending in “Ind” like PEExclXorTTMInd use cap-weighting. We will revise them sometime next week to use a straight average. If you use these “Ind” factors in your systems, please try substituting them with the Aggregate function to see the impact. When we revise the Ind factors next week, and you wish to keep the cap-weighted method, you will need to replace the factors with the aggregate function using #CapAvg for the ‘method’ parameter.
Here’s the description of Aggregate:
Aggregate(“formula”, scope [, method, outlier_pct, outlier_handl, ex_zero, ex_adrs, median_fallback ])
Returns the aggregate value for each scope. Can be used to calculate your own averages for Industries or SP500. It allows either a simple average or a cap-weighted average. Most of the time we would recommend a simple average as cap-weighting results in more volatile values (for ex.if a large cap is a borderline outlier). It works like this:
- The formula in quotes is evaluated for all the stocks in each scope. The formula could be a single factor, like “MktCap” or more complex like “Close(0)/Close(10)”.
- The results for each scope are placed in an arrays. N/A’s are discarded
- The arrays are sorted.
- The arrays are trimmed or winsorized
- The arithmetic or cap-weighted average for each scope is calculated
Parameters
formula: any valid stock formula
scope: how stocks are grouped before the aggregate is calculated (see below)
method:how the aggregate value is calculated
#Avg: average the formula values (default, recommended)
#CapAvg: market cap weighted average for the formula
outlier_pct: trim percent for outliers from each side. Default is 16.5%
outlier_handler: how the outliers are treated
#Exclude: excludes outliers from the aggregation (default)
#Winsor: the outliers are set to the highest/lowest value that are not outliers
exclude_zero: when set to TRUE 0 values are discarded (handy for factors like Yield). Default is FALSE.
exclude_zero: when set to TRUE ADR’s are excluded. Default is TRUE.
median_fallback: when set to > 0 it triggers a fallback to a simple median calculation when not enough stocks are in the scope. Handy for small industries. Default is 0 or no fallback.
Cheers
NOTE: The chart below is for
PEInd SimpleAvg: Aggregate(“peexclxorttm”,#industry,#Avg)
PEInd CapAvg: Aggregate(“peexclxorttm”,#industry,#CapAvg)