I think this comment sums up my experience as well. I won’t be using it because the restrictions are too harsh ( on a magnitude of at least x10 to x100) compared to the website.
If I remember correctly it outputs a CSV file, which Python can handle well.
Philip,
That’s right. I have no trouble uploading (or downloading) a csv file in Python. Or in R for that matter.
But I still need the matrix (or array) I described above–at some point in the process. Otherwise I have no practical use for the Data Miner App.
I am willing to do some manipulation of the data. But as far as I can tell, something like this is pretty standard for most Python libraries.
I am really just describing a pandas DataFrame as you know. I would not mind getting where I want to be with a few lines of code (including the slices of data) as I have done here:
df=pd.read_csv(‘/Users/JamesRinne/opt/ReadFile/poptindex.csv’)
f1=df[2000:]
f1_slice=pd.DataFrame(f1[[‘QQQ’,‘XLE’,‘XLU’,‘XLK’,‘XLB’,‘XLP’,‘XLY’,‘XLI’,‘XLV’,‘XLF’,‘GLD’,‘LQD’,‘TLT’,‘SLYV’,‘IWO’,‘SPY’,'IWM’]]
Thanks.
Best,
Jim
Can someone explain to the non-programmers among us what this means in terms of sharing our intellectual property? And will it facilitate an easier way to share (beyond P123) our Strategies & books, or results from our Screens?
I don’t think it changes anything in terms of protecting your intellectual property (as in, you currently have no protection and will continue to have none). But it gives you a much easier way to export data from the website (to use in other programs like Excel or Python).
Are there news regarding the limits of the Data Miner?
thanks in advance.
Changes are in the works. I should have more information for you later this month.
Hello,
Thanks @Yuval. I am looking forward to see how it advances.
Meanwhile, I would like to learn how to get the best of it. And I am facing a a roadblock.
It seems quite easy to change the “ranking system” or the rules within a rank. At the end, there are not too many combinations.
However, if I would like to see the evolution through different dates, the only solution is writting one by one all the nodes?
Let’s put an example. I would like to see the result of 20 different rolling backtets every 4 weeks. Like the result that I can download with the Rolling Backtest in the screener, if I select Holding period & rebalance period of 4 weeks.
For that I have the feeling that I need to create a node for each different period of 4 weeks and rank, which will result in an enormous amount of work. While using the website I only need 20 backtests.
Am I correct? or Am I missing a point?
thank you very much in advance!
BR!
I may not be understanding Ignacio correctly.
Even so, for those familiar with Python, wouldn’t it be nice to have all of the data with a date column and be able to slice the data by date? Maybe be able to use the date column to sort by date as well as rank and returns to see how the ranking system is doing at finding the best stocks?
One download and all the rest being done with slicing (sorting, etc) within Python. A small script doing the rolling backtest or cross-validation or bootstrapping…or whatever. Much of this code already written in Scikit-Learn.
I may be missing something (probably am actually). More than likely, I am missing something and 2.0 will address any inefficiencies others are noticing—which would be good. But Ignacio’s post is not the first post like this.
More succinctly: I think P123 would benefit from attracting and marketing to the Kaggle crowd. https://www.kaggle.com
You know, the Kaggle crowd who competted to win $2,000,000 to better be able to predict the prices of homes for Zillow.
Of course, as we all know, it is much easier to predict the price of a home–using the limit data available on a home—than it is to predict a stock price using P123’s data. Of course, Kaggle has paid to predict future stock prices for hedge funds too. And we all think those kinds of predictions can be made or we would not be here at P123.
Hmmm, P123 probably could not market to them. But they do use Scikit-Learn, universally, if you did decide that there might be a market there.
-Jim
I think I understand your question. By “nodes” you mean “iterations,” right? If so, then the answer is yes, you are right.
One thing that we need to do is to enable the DataMiner to give, as an output, a batch of .csv files that would be the same as what you can download after running a backtest on the screen. That would solve your problem, if I read you right. Personally, this would be of great use to me too.
But right now we are working on lifting some of the restrictions, pricing use cases with fewer restrictions, and creating a service that would help you use the DataMiner for practically anything you can think of. I’m sure that batches of .csv outputs will be an option sooner or later.
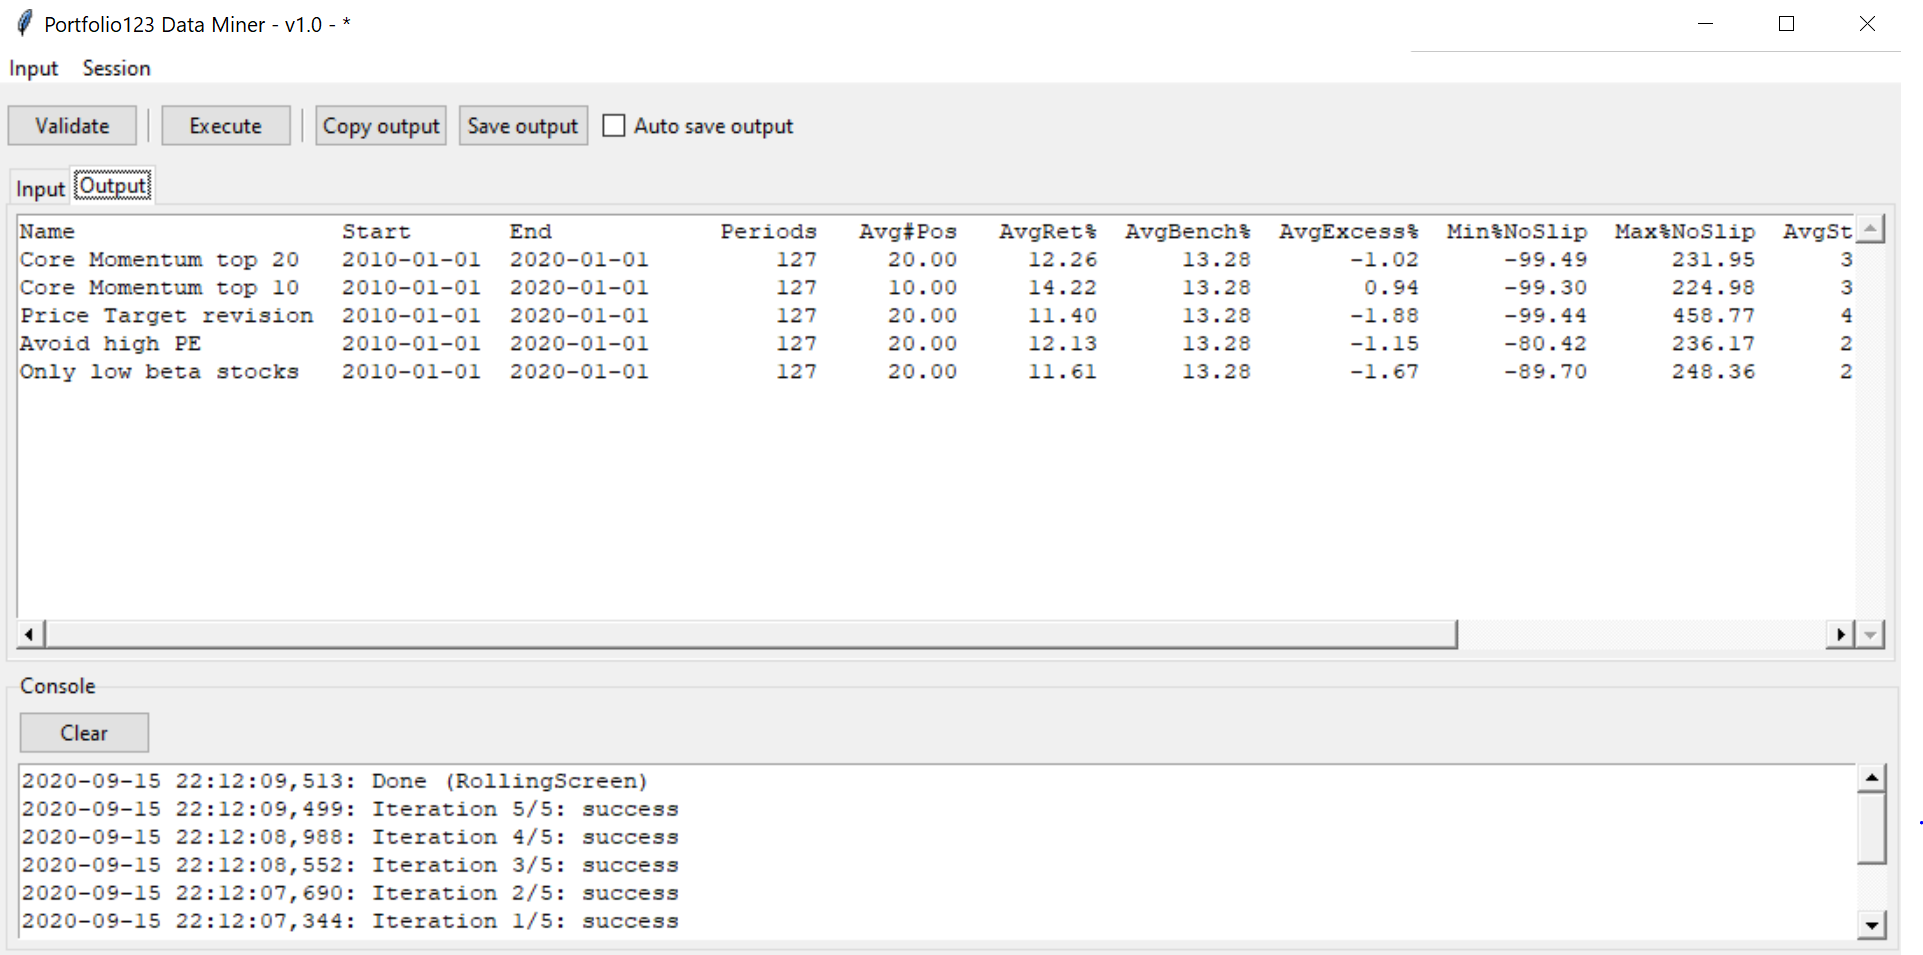
Isn’t the RollingScreen operation what you want? Below is image of the output of the RollingScreen sample . You can save the result and view in excel (or copy paste directly). The sample I used is in the dropbox shared folder and is called
“RollingScreen - Testing momentum ranking with different rules.yaml”
There are 5 different versions of the backtest that share the same period, 1 year holding, shifted 4 weeks, for a total of 127 periods of 365 days.
This takes one click to run using DataMiner . The only difference between this and the website output is that we only show the average row of the periods for each backtest. So 5 rows in the output. Missing are the row for each period, and the averages for Up / Down markets. But we can easily add this detail if needed.
Also please note the the RollingScreen operation has two extra columns not present in the website Last13AvgRet and Last65AvgRet . These represent the average return of the most recent 13 & 65 periods. There’s no way to configure this at the moment.
thx
Marco,
Thank you for your post. Is there data in this download that can be manipulated to get new information and develop a model in Python?
It is excellent that you and Yuval are addressing a user’s interest in rolling backtests. This is very much appreciated.
Still, I do not think you are going to attract a massive group of new users by duplicating what is available on P123 as far as rolling backtests.
Quantopian, to some extent, tapped into a market of machine leaners. But they really have not done it well and they have not taken over the world yet. I think they have not address the use of fundamentals (P123’s strength) at all. But I think they have proven that there is a market.
I think P123 can not only attract some Quantopian users but tap into a larger group. A serious mainstream group:
Like people at UC Berkeley’s Master of FINANCIAL ENGINEERING Program: LINK
Kaggle and other machine learners address a broader spectrum of problems but I think they use the same techniques. Some of them use money and might want to use their skills to make some (money) at P123. I think they are a pretty large group.
Rolling backtests are fine. And again, thank you for addressing this for people who are interested in rolling backtests.
But I would think about calling a professor and maybe even paying a graduate student from a FINANCIAL ENGINEERING department to see what they would want. See if you could attract them (and people like them) to P123.
Truly just a marketing suggestion. I am very happy with the present services at P123.
Best,
Jim
Thank You, Yuval and Marco.
Indeed, Marco, what I want is the row for each period, as I can get in the website.
For me, that provides multiple operations and I can use the data for other ML processes.
If I understood correctly, this will be available in the future. But I think that it could be one of the most powerful features of the data miner.
otherwise, I cannot see how a ranking system has evolved in different periods, except if I create a new different iteration for each period, which in the case of months we are talking about 250 and around 1100 weeks. Too many interatios to be written manually.
Maybe there is a way to create a script in a text editor to create it automatically. Let’s see… XD
Anyway, thank you very much, and please consider to include the CSVs with all the rows for the rolling backtests. That would be really nice ![]()
Hello Jim and everyone reading this thread. A precision… In theory Quantopian is already more powerful than P123 to build fundamental models, with the condition of being comfortable in their coding framework. They have both US Factset and Morningstar fundamental data, you can process them and even mix them in any way allowed by Numpy, Pandas, Zipline, statistical functions. In fact you can build and mix filtering rules and ranking systems based on fundamentals and technicals like in P123, in a more flexible way (I translated 2 screens and a ranking system from P123 to Quantopian, just to assess feasability). The framework also allows to set simulation parameters (transaction costs, position sizing, etc…)
However, practically the free version is unusable for anything else than very basic models, because backtests are way too long (probably of a 100x magnitude compared to P123). Moreover, in the free version data periods are limited and you can’t create and import your own packages (no code reusability). The pro version has all the data history, is likely faster, and probably allows code reusability, but it’s too expensive for me.
As for their ML features, the whitelisted packages are limited, but I have made a few tests of market regime detection models with random forests and bagging SVMs, technically it works and I can get metrics from the tests (I didn’t find any actionable alpha yet).
Federic,
Thank you.
You are a better programmer than I am. That is just a fact and I mean that sincerely. That is pertinent here because I seem to be able to do stuff with Quantopian’s technical data. But I just can’t get the clean wonderful fundamental data that the P123 team provides over at Quantopian.
I watched P123 build the data for FactSet (something else I cannot do as a non-programmer). Near as I can tell there is real value there.
But once the data is arranged properly, I have no problem using Boosting, developing a neural net or using other ML methods. And they do work, plain and simple.
Seriously, does anyone really believe that P123’s linear weighting of ranks works but nothing else does? Like magic, the only useful method that has ever been discovered is in just one place for retail investors and at a reasonable price (except at Renaissance Technologies I guess). You have to be kidding me. That is not how the world works.
IMHO, P123 is sooooo close to having something that is vastly superior to Quantopian.
But at a minimum they would have to have an easy download of the new overnight data in the morning to make predictions and to allow SORTING ALL OF THE PREDICTIONS FOR ALL OF THE STOCKS IN THE UNIVERSE to find the best 5, 10,…or 25 stocks to buy.
And honestly, if P123 wants to develop a market I would not limit the downloads to professional programmers in the top percentile of Python literacy using DataMiner on a windows machine (just me). I think it is a fact that even the best programmers are not getting what they want with DataMiner 1.0.
Maybe DataMiner is the best way. But I would replace “Samples” with “Templates” and make it very user friendly. Friendly enough that an undergraduate using SPSS can get the data she wants without calling Aaron. And if someone does get Aaron’s help that it is needed just once and that a series of templates are available afterward negating the need for any further calls.
Actually, I would scrap DataMiner if it was me.
But whatever P123 does is fine with me. I have not been sitting idly-by waiting for this. I use other sites now. And I have found ways to use ML without having to have every stock in the universe in the sample.
I truly can do without any of this. And probably, I am better off if P123 does not attract a bunch of machine learners to compete with my models anyway.
If P123 develops new abilities I will use them so I am perhaps indifferent. Indifferent except that I would like P123 to survive.
Did I mention that I watched P123 build the FactSet data and I think there is real value there? I appreciate the work that P123 has done.
Wishing everyone the best,
Jim
The value added by the model designer in ML is precisely in the data wrangling process before choosing and tuning an algo. Choosing and tuning an algo will be more and more automated in AutoML frameworks. Arranging data properly is the biggest part of the job and we can’t expect to have it done completely. Some visual tools allow to make data wrangling pipelines without programming. Azure ML studio looks promising for that, but it can’t compete yet with a python/pandas programmer.
Frederic,
I agree and I may need to check out Azure ML. Thank you for the tip.
But P123’s tools are pretty powerful. Not that I recommend always using a screwdriver when you need a hammer (which I may be doing here).
But, if it does not work in a sim or a rank performance test do not expect a miracle in that random forest you visit. This is not the story of Little Red Riding Hood and magic in some random forest. I get that as well as anybody.
P123, thank you VERY MUCH for the rank performance tests, easy downloads from the rank performance tests, sims etc. The tools go a long way toward data preparation. Not to mention everything you do with the data before I see it as a rank.
Actually, let me be the first to say (again) that a lot of people use Excel Spreadsheet downloads, panels (e.g., fundamental analysis) etc without ever programing a Random Forest and they do very well. And I am not sure I actually need anything more than the excellent service P123 already provides.
But I am not P123’s entire (potential) market either. As I said, there are a lot of successful methods at P123 and elsewhere.
Best,
Jim
Is there a schedule as to when the Data Miner will be updated to make it usable?
No. As I’m sure you know by now, we rarely set firm dates for improvements and new features. I’m working on getting this out as fast as we can, but if I gave you an estimate, I would likely be proven wrong.
Yuval,
You should take all of the time you need to get this right, IMHO.
You said you are not a programmer or at least have not used Python much. If you make it so that you can use this easily, I am sure it will be a great addition to P123.
Whatever your preferences may be, I can say with certainty that I would like to do as little data wrangling with Python as possible.
But I think you should make it even easier than what both of use could use. I think you should make it so that an undergraduate who has not had much programming training (not yet anyway) could download the data she needs (into a csv file) and plug it into SPSS easily without calling anyone. Even on her MacBook (pretty common even for advanced programmers and for undergraduate students).
Didn’t Marc say he uses a MacBook? Marc is actually a very high-level user—even of statistical methods. It would not hurt if you keep this easy for him (and users like him). For me too (I am not picking on Marc but using him as an example of someone who should be able to use this).
BTW, perhaps the majority of Kaggle competitors use MacBooks. For sure, a lot do.
I am pretty sure you will get some additional users with this–if the data wrangling is kept to a minimum. Marc can probably find a windows machine (or use Bootcamp) if necessary. I can anyway.
Does P123 want to market only to Python users? SPSS is better for many things including multiple regression (Econometrics)j, Principle Component Analysis, Factor Analysis Bootstrapping etc.
Me. I would use Python (TensorFlow) for neural nets and SPSS for factor analysis.
Specifically, you should think about making it such that someone could download a CSV file and immediately upload that file into SPSS without any thought (and certainly without any Python data wrangling). Perhaps even on a MacBook
That should be your standard if you want to attract new members, IMHO.
Best,
Jim