Calif, you didn’t save the series. PLease save it so we can check. Thanks
I retried and it works now, thanks.
Marco,
This is a great new feature.
There seem to be errors in the data for P/B, P/E EBIT/EV. See the public chart from Rellis labeled “Price to Book for the S&P500”. The big steps don’t make sense.
Rick
Marco,
Will we be able to use the new functions UnivAvg(), UnivCnt(), UnivSum(), etc. as buy and sell rules in Sims & Ports like:
100 * (UnivCnt(“close(0)>sma(200)”)/UnivCnt(“true”))>50
I tried it but it doesn’t work now. I got the error: [color=red]Error near ‘UnivCnt’: Invalid command ‘UnivCnt’[/color]
Denny ![]()
I’m getting the same error as Denny
Relllis,
WYNN’s Pr2BookQ on 11/18 went from N/A to 17K+ which throws off the average. I think that is the correct value for that ratio since their BookVal was close to 0.
We should probably add UnivMedian to make this type of series meaningful.
Or you can add your own sanity check to eliminate from the average the outliers. For example in “criteria” for UnivAvg use Pr2BookQ<20
Yes, please add UnivMedian, it would be very helpful in many cases like this one.
Very cool Marco!
I will love the see a contributing factor (weight) that can be negative(!) for each component.
An optimisation mechanism will be cool too.
Marco & All:
Is it possible to create a weekly series from daily data? If not, would you consider adding this functionality in the future. Weekly data (with its inherent filtering of daily fluxuations) is sometimes valuable. Thanks.
Bill
dmicsa, you referring to the series tool? what weights?
strader1, maybe. Inside the “formula” you have free reign. You have a specific example?
Can we please get more than 15 years of data for the series tool. For example, % of SP500 stocks > 200 day average. It is very limited with only 15 years/2 recessions. I would like to test some market timing strategies with a longer period of time.
thanks, Debbie
Marco & All:
Yes, I would like to be able to calculate / use Rsi(x, y, #Series) based on weekly data. Can I use "top-down" series to do this for say SPX? If so how? Thanks.
Bill
Marco, now you sum with factor 1 on all oscillators. It will be nice to can alter the weight of any oscillator we use. Some oscillators works well reversed and are not symmetrical.
A parameter defaulted to one on all oscillators will make it behave like now.
I know we can duplicate oscillators and they will contribute with integer multiple but still the one that contributes in a negative way are impossible to quantify.
The overal oscillator:
OverallOscilator = Sum(Wi * Vi) / Sum(Wi); where Vi = {0, 1}
now is done like this:
OverallOscilator = Sum(Vi) / n; where Vi = {0, 1}
Marco & Team,
It looks like Christmas is coming early this year. Thank you for this extraordinarily valuable upgrade to the platform. These new functions save so much time over the alternative (labouriously copy-pasting into a sheet / running series operations in sheet) that I am just about ready to shed a tear…
Best regards and keep up the great work,
D
Has anyone managed to create a series based on existing macro data? E.g. the Junk Bond vs. 10y treasury spread?
Great addition Marco. Will it also be available in screens?
Hi Marco
Thank you very much for this powerful tool. I have a couple of questions:
- I have been trying to create something that compares results based on rank. Could you please help how I can achieve this:
For example, I would like to plot the price performance differential for the last 20 days between the top 10% and bottom 10% ranked stocks based on Price/Sales, excluding N/As.
Is it even possible to use FRank in the Series? I receive an error message for:
FRank(“Pr2SalesTTM”, #All, #DESC) >= 90
ERROR: In Rule 4: Error near ‘FRank’: Invalid command ‘FRank’
-
Is it possible to do a certain calculation to create a series, and then transform this series to an SMA (series) to be accessed in macro charts? I see it is possible for the chart, but I would like to create an SMA series directly. For example, I would like to use the example series “SP1500 Vol ADC Pct” but create a SMA of the Highest (or Lowest) series values, or create BollingerBand around the “SP1500 Vol ADC Pct” series. The current macro charts backtest only gives the possibility to either set above/below SMA or a flip flop around the raw value. I would like to create a SMA series, and then use the flip flop on the SMA series.
-
Is it possible to use the LoopSum within Series?
Thank you
whotookmynickname
P123 Team,
I am just realizing how amazing a feature this could be. This will solve a lot of my problems. Really impressed how you can elegantly solve many solve problems with a single addition.
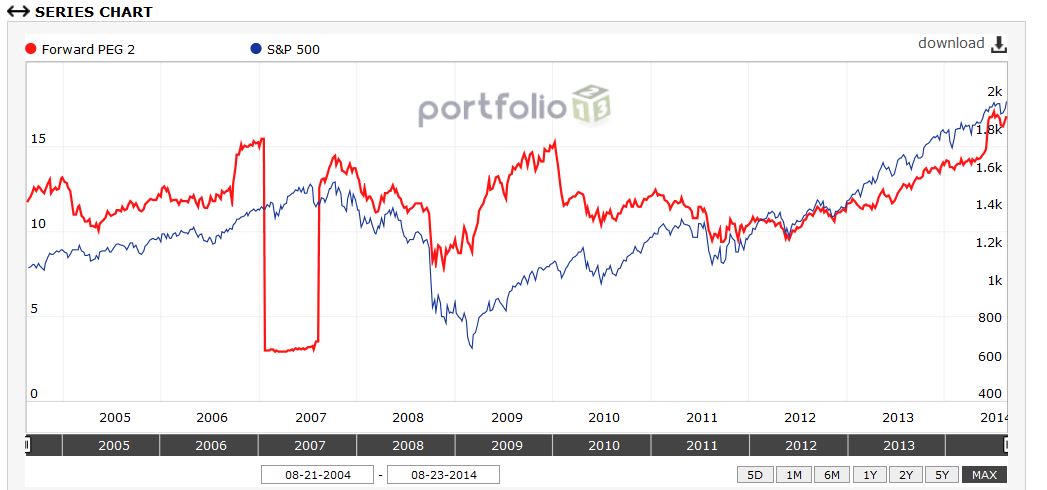
I am getting an anomalous value for the S&P 500’s earnings when I try to calculate the forward PE and PEG ratios.
I am doing it two different way, but both are resulting in anomalously large earnings spikes between 2006 and 2007.
Method 1 for Forward PE is as follows:
- setVar(@TotMktCap, UnivSum(“#AnalystsNextFY >= 1 AND #AnalystsLTGrthRt >= 1”, “MktCap/1”))
- setVar(@CapWeightedGrth, @MktCapxGrth/@TotMktCap)
- SetVar(@FwdEarnings, UnivSum(“#AnalystsNextFY >= 1 AND #AnalystsLTGrthRt >= 1”, “SharesCur(0)*(CurFYEPSMedian/1)”))
- SetVar(@FwdPERatio, @TotMktCap/@FwdEarnings)
Method 2 is:
- setVar(@TotMktCap, UnivSum(“#AnalystsNextFY >= 1 AND #AnalystsLTGrthRt >= 1”, “MktCap/1”))
- SetVar(@MktCapxEarnings, UnivSum(“#AnalystsNextFY >= 1 AND #AnalystsLTGrthRt >= 1”, “MktCap*(CurFYEPSMedian/CloseAdj(0))”))
- SetVar(@FwdPERatio, @TotMktCap/(@MktCapxEarnings))
In theory, these graphs should be close, and they are somewhat. However, I get the following chart which shows that earnings estimates spiked and plummeted in a way that I think is clearly indicative of an error, either on my part or due to the data…
Please, advise.
Try excluding BRK.B, that’s what we do in the SP500 series
When the primary issue changed from .A to .B there’s a lag in the fundamentals that we do not handle.
Berkshire is notorious for causing a lot of headaches.