“To cope with this issue, we asked one of world’s largest stock brokers, Nomura, if they could provide us with transaction cost estimates for stocks that are constituents of the S&P1500 index over our sample period 1990 through 2009.”
It goes on to describe the method. The results are in Table 2 on page 37.
There are some obvious issues. It is limited to the S&P 1500 index, which is considerably smaller than the P123 universe and doesn’t include the less liquid stocks. They assume large trades, $1 million per trade, which is likely unrealistic for most P123 members, which I think will tend to make the trading friction too high. They do not include commissions, which would make the trading friction higher. Etc.
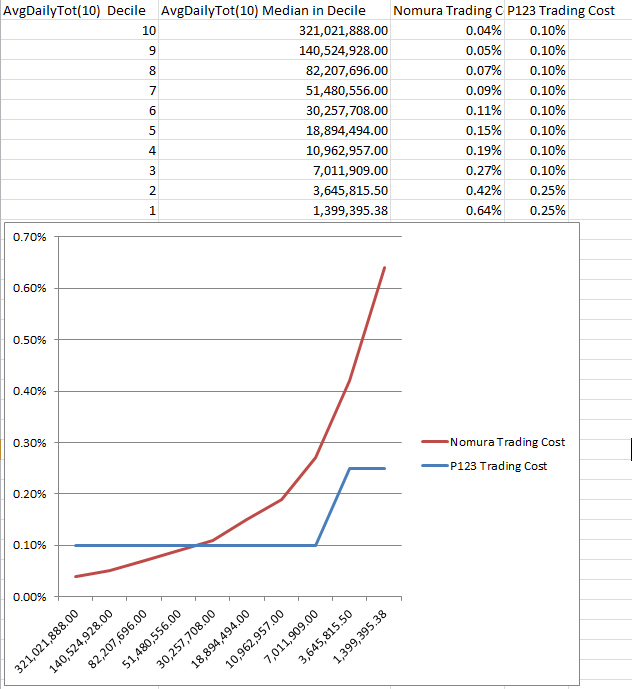
I used this screen to get the median AvgDailyTot(10) by decile.
I combined that with the Nomura trading cost for each decile and lined it up with the P123 variable model. The results are attached.
The results would seem to indicate that the Nomura estimates for trading costs are higher than the P123 ones for lower liquidity stocks and lower for high liquidity stocks.
On the other hand, if one really was doing $1 million trades, using a PctAvgDailyTot(10) < 10 rule would limit trading costs to about 0.2% by the Nomura data.
Now that is VERY interesting. trades less than $1Mil will have lower slippage. But without the data the amount is only guess work. It would be wonderful is we could find a study that covered the amounts less than $1.4Mil that this study covered.
Taking the numbers that Al provided I’ve come up with a formula for variable slippage that more or less conforms to both the Nomura trading cost and P123’s slippage calculator but is much smoother and simpler. The percentage slippage is 25 divided by the square root of the ten-day average daily total measured in thousands. So if the ADT is 44K, the slippage is 3.77%; if the ADT is 100K, slippage is 2.5%; if the ADT is 5000K, slippage is 0.35%; if the ADT is 321,000K, slippage is 0.04%. And if the ADT is as low as 10K, slippage is 7.91%. This seems like a very reasonable measure of transaction costs, and it avoids the huge jump in slippage that the current variable slippage formula applies when the ADT drops from 55K to 45K.
I think you should be using a minimum daily total, not an average daily total.
I realize 10 days is probably short enough for it not to matter in the vast majority of cases. I always avoid ADT because I’ve seen too many cases where a stock has an extremely high volume for a few days and then goes back to trading a very small amount, even days with no trading at all.
In any case, if there’s only a small difference between MDT and ADT, you haven’t lost anything. But if there is a large difference, you may gain a lot by not stepping on a liquidity land mine.
So Randy is touching on an important broader point. At those small volumes market impact becomes important.
At an ADT of 45K, $10,000 will be more than 20% of ADT. There will be a difference if you trade $10,000 compared to $1,000.
My question would be should I trade just $5,000 for that stock? Less? Maybe if that is my best port I should trade $20,000. In other words: What is my market impact? What is the optimal amount to trade based on the market impact?
Many of us need equations where the amount we trade is in the numerator. Yuval is correct that the square root is often used.
Most calculation take the form Constant * Daily volatility of the stock * Square Root(Amount You are Trading/ADT). Often with some function of BID/ASK spread added (which is not in the P123 data). The point here is that the amount you trade is in the numerator.
With any luck, at some point we will all be asking how much of my increasing money can I dedicate to my best port (or the lowest volume stock in that port)?
Personally, I am far from having an answer to this question–yet it is one of the most important questions.
If you have a link to such a calculation, I’d love to see it. It seems extremely useful. How, for example, do you calculate the daily volatility? What’s the constant?
By the way, though actual slippage for simulations should be calculated on the basis of a 10-day ADT (or MDT–thanks for the suggestion, Randy), when buying a stock that I’m intending to hold for a while, I don’t look at anything less than a 90-day figure so that I know that I’ll be able to sell it without too much trouble.
I only use limit orders so that I don’t usually pay the full bid-ask spread, but the partial fills, with their daily commissions, kill me.
I used this in a screen to get the daily volatility: showvar(@Pctdev, Pctdev(30,1)). I used 30 bars thinking there may be some statistical validity for the standard deviation based on the central limit theorem. Note this is percent and you will have to modify the equation a little if you use percent.
The constant is always around 0.5. I think one paper made a big deal that 0.5 was way off then put it at 0.6. I tried to run a linear regression to get the constant for my trades but did not get significant results.
Like I said, I am far from an answer on this. I do not do just window trades but this does not seem to work at all for window trades (small study). Maybe not unexpected. Who knows who else is trading the same window or how much they are trading.
BTW, in that small study the daily volatility of the stock did seem to help some: still the study was not significant.
I’m afraid I don’t understand what the paper means by volatility as measured in “daily units.” If this means the standard deviation multiplied by the price, then high-priced securities would have a higher transaction cost, which is rarely the case. Or does this mean the high minus the low divided by the close? Or perhaps by cost they mean dollar cost rather than percentage cost? I’m trying to calculate this and am pretty confused.
So I think it is the standard deviation of the close to close price in dollars. Like IBM was down -0.61 today. If you take that number for that last 30 days and get the standard deviation of those numbers you would have the “daily units” to use in that equation to calculate the slippage for a large purchase of IBM.
Higher priced stocks would naturally have larger daily price changes and therefore a higher standard deviation (but not necessarily a higher percent change in price). A $10 stock might have a standard deviation of 1 while a $100 stock that has a standard deviation of 10 would be a stock with similar volatility.
It does make sense to me that a speculative stock who’s price has been fluctuating wildly could get pushed around by a large buy or sell order. Holders would not be as committed, buyers and seller not as sure of their price and there would be limit buy and sell orders all over the place.
P123’s PctDev is the standard deviation of the percent change in price. So you will have to adjust the equation to make everything percent. You will want percent for most purposes anyway: you are dividing both sides by the price of the stock and multiplying by 100. Then you use P123’s PctDev on the right side of the equation instead of the standard deviation in dollar terms. Then the left side of the equation would now be the percent change in price that your order would cause. That is good. That is what we usually mean by slippage.
Please post again or email me with any questions or ideas about slippage. Ultimately, I would like to adjust my purchase for each stock in my favorite port according the the ADT, volatility of the stock BID/ASK or whatever works. At a minimum I would like to know the maximum amount I could put on the lower volume stocks. The stocks with the lower ADTs have the biggest returns but there has to be an optimal amount to buy.
I spent some time studying my own transaction costs. I’ve made over 200 transactions since October 1, almost all of microcaps and small caps, all using limit orders placed before the market opens below the bid-ask spread for buying and above for selling, adjusting as the day progresses if I don’t get filled. My trades are never for less than $1600 (usually much higher) and my commission is $7.95 a trade plus an occasional few pennies fee. I took into account the times when I had to buy or sell over multiple days because of getting partial fills, paying a commission on each day’s trade, and I included those costs in my calculations. Then I compared each buy or sell to the opening price of the stock on the first day of the trade. It turns out that because of all the times I improved on the opening price my average transaction cost was 0.59% and my median transaction cost was 0.27%. I then performed a linear regression comparing the square root of my purchase/sell divided by the ADT to my transaction cost (in percent). There was no correlation–the slope was -0.022 when in theory it should have been positive. I drilled down and looked at my transaction costs when I was buying more than 10% of the ADT–a dozen times in all. My average transaction cost was 0.20%. More than 5%–about 30 trades: 0.27%. I once sold more than 50% of the ADT–it took me 5 days–and my transaction cost was only 0.35% because the market moved in my favor despite the impact of my sale.
My conclusion?
I think I’m not going to pay any attention to slippage costs from here on out. The way I trade seems to minimize them no matter how low the stock’s volume is or how much of the ADT I want to buy. Just one less thing on my mind.