Your results seem somewhat consonant with my theory because there are HUGE differences in 2023. But I’m not sure yet; there are large differences in other years too. The holdings you’re showing are not informative: you need to show the Holdings / Current tab, not the Holdings / Return tab. Thanks!
After thinking about it some more and doing a little more research, I think that I was wrong about what I wrote earlier. I think Jim and Whycliffes are right: ranking systems are indeed so efficient at choosing stocks that even the price difference between open and close can make almost as much difference in returns as a one- or two-day delay between the ranking and the purchase/sale of a stock. I found it hard to believe, but now I am convinced.
Very interesting Yuval! For my models, this effect of buying and selling in the open is 3-5% annualised.
Now, the second question is; is the opening price so difficult to buy or sell into that this effect is almost impossible to use? (I don’t want to use a market order, since I trade small and microcaps.)
Will the price correct so fast after the open that you usually get worse than the opening price?
There is no way of testing this in p123, so I would be happy to hear some input from more experienced investors. How difficult is it to trade during the opening hours and to get into or close to the opening price?
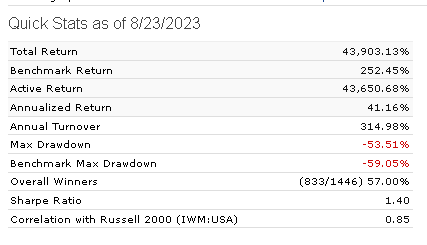
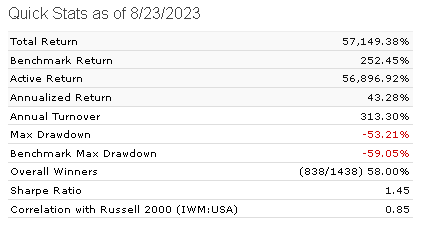
This is a different RS, but mine too, I get a better result when using the opening vs. the close.
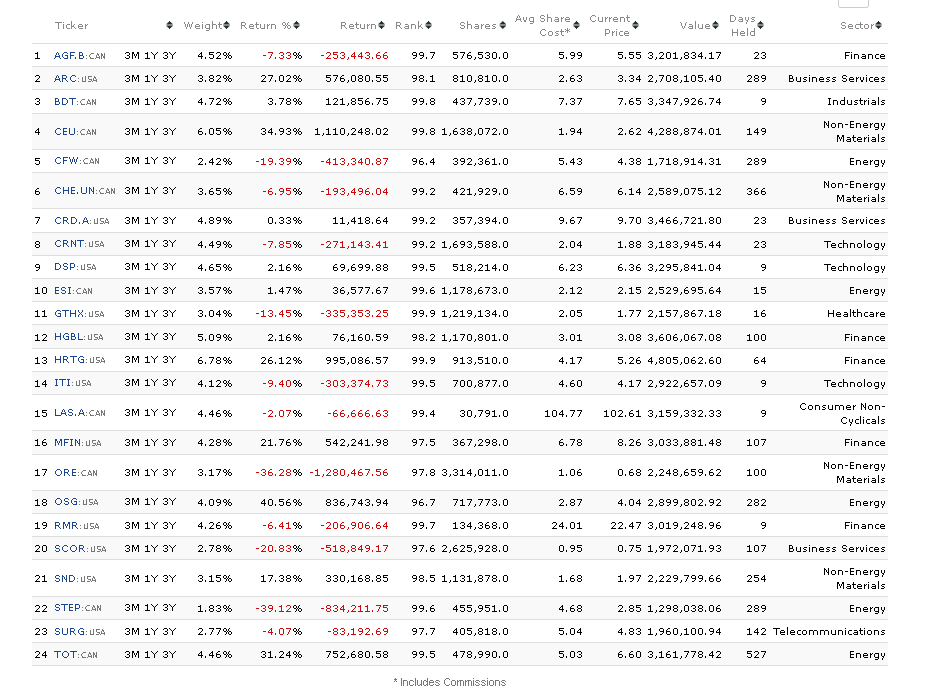
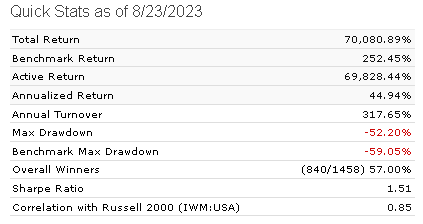
Close:
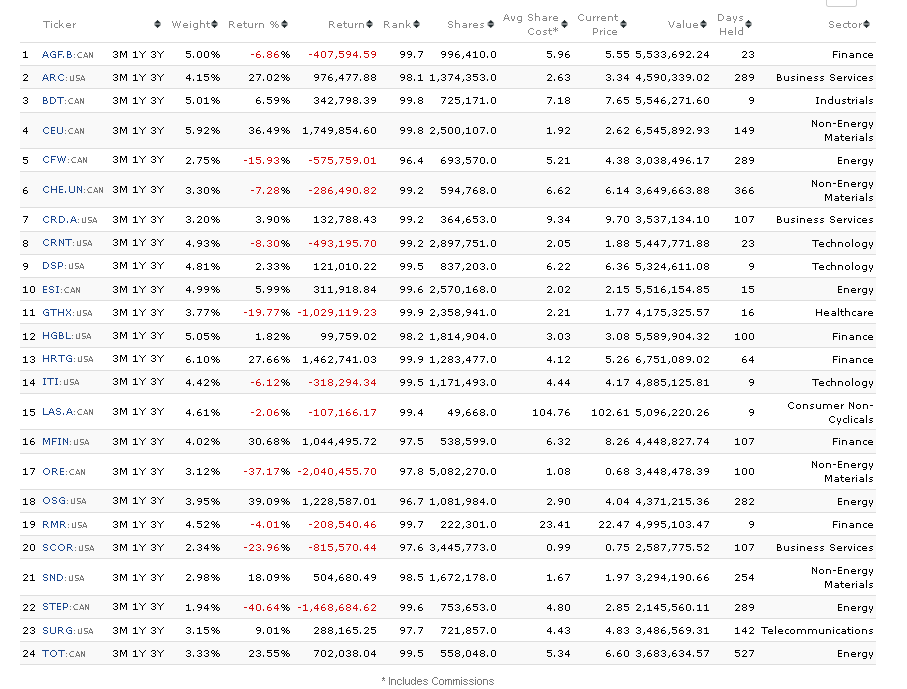
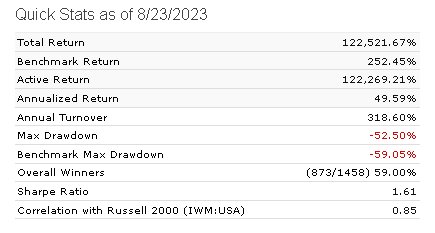
Opening:
This should mean that a good trading strategy is to get in as soon as possible after the signal is generated. And when using daily rebalancing, this is the result, which confirms the idea:
The models you are testing, do they have they have a momentum factor? If so, I know from my many years of pure technical trading that Mondays are special.
Mondays are the worst weekday of the week and with the worst intraday performance, at least for the the larger indexes I normally trade.
However the Monday anomaly can be explained by the well known “Turn around Tuesday effect”. If the market is oversold coming in to the weekend, it’s likely Monday will continue down, then the price will mean revert on Tuesday-Wednesday. If the market is overbought on Monday, it tend to behave like any other day of the week (from my experience).
It would be interesting to see the difference in your results if you removed all momentum factors in your simulation.
Hi all, I wanted to share some work inspired by conversations here. I got interested in implications of delay mentioned here because my framework has tended to be “moving faster is better than moving slower” when something new shows up in my ranks or when something falls out. In theory at least. In practice it’s harder, because I almost never just place “market on open” orders. But in truth, I can’t recall measuring the idea of “what is the cost of taking a week or two to get in and out of positions?”
I ran some studies using RankPrev(n) on a couple of screens I use. These are fairly low turnover screens (maybe 15-20% turnover every 4 wks) and much of the change in rankings - both new arrivals and falloffs - seem to happen around earnings events. For the most part liquidity is good and slippage is low. (Probably 90% of companies are over $1B mkt cap and currently 30-40% are over $40B mkt cap - so lots of very large companies), although occassionally I get some that require patience.
Essentially for the screens I found that transacting using rankings of RankPrev(1) instead of Rank caused an annual return performance to drop 0.8 to 1.5 pp (vs Rank), and RankPrev(2) had a drop of 2.5 to 3.8pp (vs Rank). RankPrev(3) through RankPrev(10) mostly stayed in the range of dropoff of 2.0 to 3.2pp (vs. Rank). Beyond RankPrev(10) the degredation mostly continued trending downward with it generally being in the 4.x pp range out to RankPrev(24) and being 5-8pp decline from there out a year to RankPrev(52).
I was surprised that the delayed performance held up so well, but in hindsight these are fairly low turnover screens with quite a few longer term fundamental quality requirements.
But my experience is that even though the screens are low turnover, the new arrivals and departures can move in violent ways - regularly 10-20% moves in both directions. I’m realizing I’d like to study the precise arrival and departure events for these screens in closer detail because and entire year of gains/losses often happens in day (or even in zero time overnight) with them, but not sure how to. My intuition after watching is to move faster on the arrivals (they seem to gather steam over time) even though I’ll miss most of the bounce, and be more patient with the departures that are big drops (maybe more often than not initial over-reaction to downside) - but that’s all anecdotal and I have low confidence in what I’ve seen as things behave differently in different market conditions and industries.
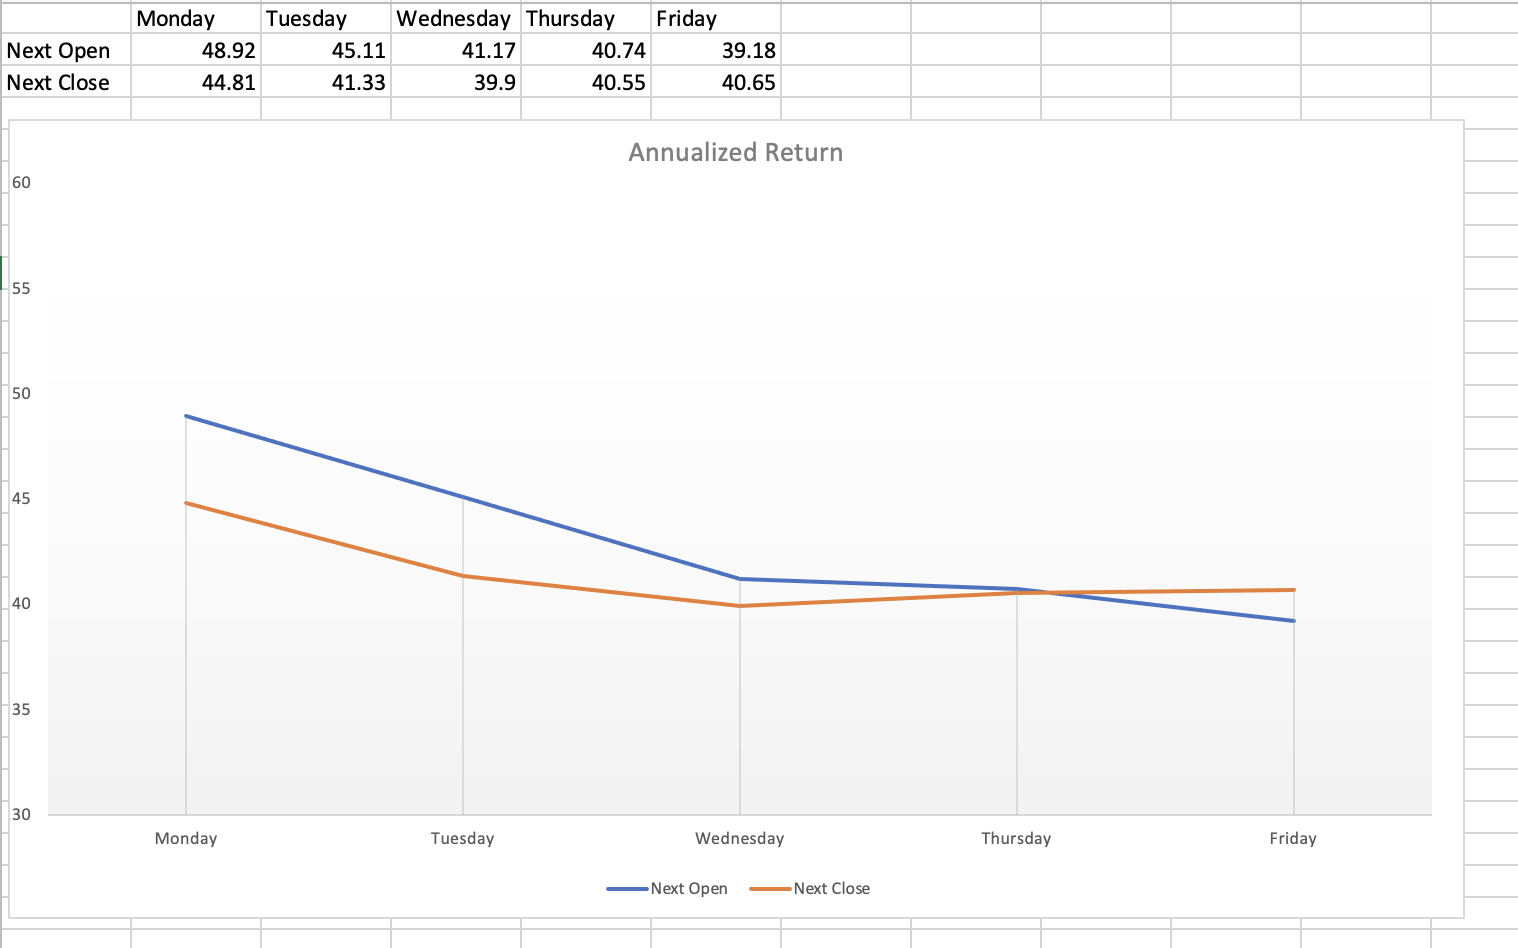
Using the Easy to Trade Universe and Small and Micro Cap Focus ranking system, I ran weekly sims across 01/02/06-08/23/23. Attached is a chart of the annualized returns. Next Open performs better on Monday and Tuesday. After that it doesn’t really matter.
Thankfully, Monday’s close is near Tuesday open. There’s continuity there. Same for Tuesday/Wednesday. So maybe it is efficiency - or momentum.
I’m going to try redoing the chart to offset the closes since they’re only separated from the next day open by the overnight session.
You can always place a market order before the open if you’re willing to pay the spread and risk the market impact of your order. It all depends on what kinds of stocks you’re trading.
Because I place really huge orders for somewhat illiquid stocks, I always use VWAP orders where I can. When I can’t, I try to break them up and spread them through the day. But for small orders for stocks with low spreads, market on open shouldn’t be a problem. Another thing I often do is place a limit order before open a little below the last close for a buy and above the last close for a sell. When it gets filled, that’s great.
But remember this: it is impossible to get better fills than most market participants by cleverly placing orders. If it were possible to do so, then you could profitably do pair trading (sell a stock in one account and buy it in another on the same day) with liquid stocks and there would be no need to be a stock-picker.
It depends upon what your priorities are. I know I may be giving up some of the spread to get a fill. The stocks I trade are from the NOOTC universe with a $200K median and less than 1% bid/ask spread. I place limit orders using the prior close and the limit being a half percent against me. So on a $20.00 prior close this would be $20.10 for a buy and $19.90 for a sell.
I’m in Arizona which means the market opens at 6:30am local time. When I login about 10:00am local about 85-90% have been filled. This week 19/20 sells were executed. This is an IRA which I need cash to buy and 9/10 orders were filled completely. The remaining one was partially filled and I completed it 0.3% above my limit – the stock went up another 0.5% to close.
I very much try to catch the open with focus on the less liquid stocks as my conclusion without deep analysis is that it helps. You can also tell when you are crossing with index funds with all the small quantities.
It seems that most of us find that selling and buying at the open, or at the previous close gives better results. But what we don’t know is if it’s both sides that contribute to the better performance or just the stocks you sell (or buy) at the open.
Is there any way of testing whether to sell at the beginning of the day, and buy at the close and vice versa?
Discussion: Strong evidence for signal(s) (both the buy and sell signals) affecting the price action the day of the trade for this model over this limited time-period? This just a test of a method and not much data for any broad conclusions.
I hate data wrangling or munging (whatever you call it). But would it be that hard in Python (you know the answer better than I do)?
The transactions for next open and next close should be exactly the same shouldn't it (for the sims)? So you should be able to sort the buys and the sells for each and maybe they will still line up in a DataFrame or spreadsheet.
Or maybe you are advanced enough that you just to an external merge or something.
If not lined up, maybe a date sort and/or ticker by alphabetical sort (double sort) might fix most of it.. Not being a great programmer I would probably use a dowloaded spreadsheet from there and compare the percentage difference in the opening and closing trade prices for the buys and the sell.
Or just upload a sample of the transactions and into ChatGPT code interpreter and have it tell you the answer.
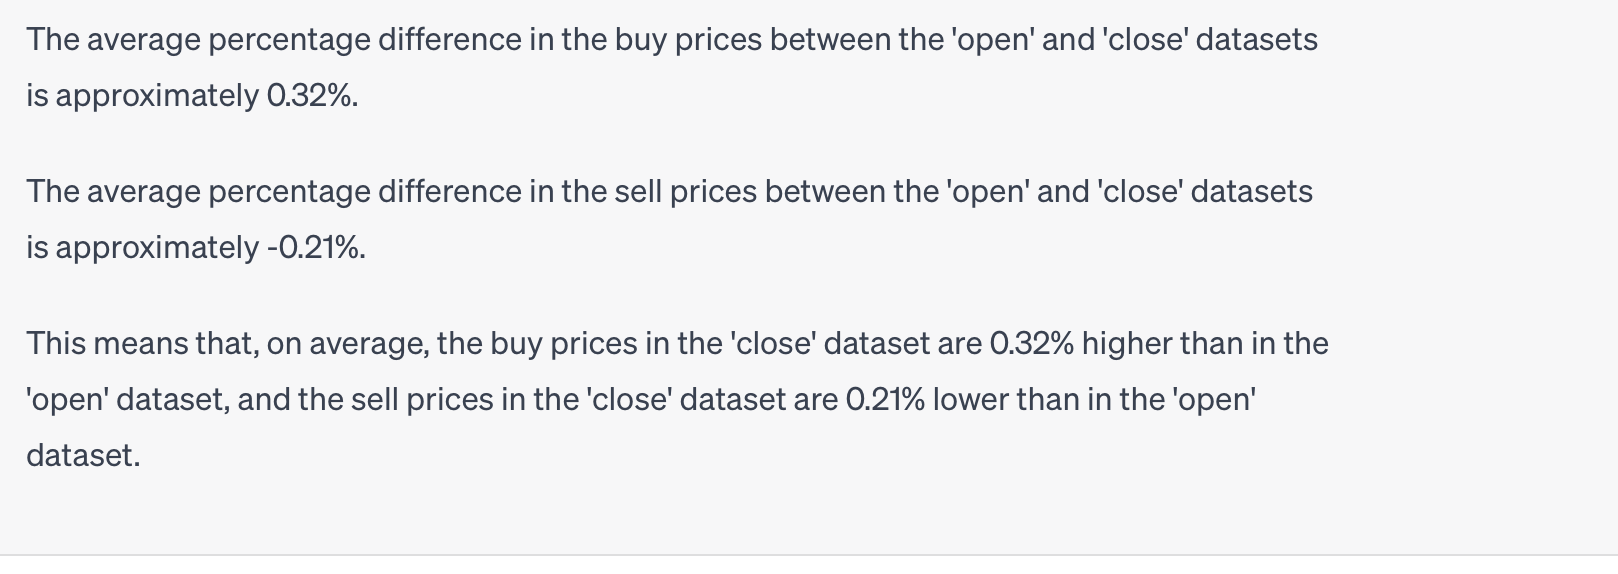
TL;DR: The good and bad news is we will use ChatGPT and Python more in the future. But we can answer any question we may be interested in if we have the proper downloads.
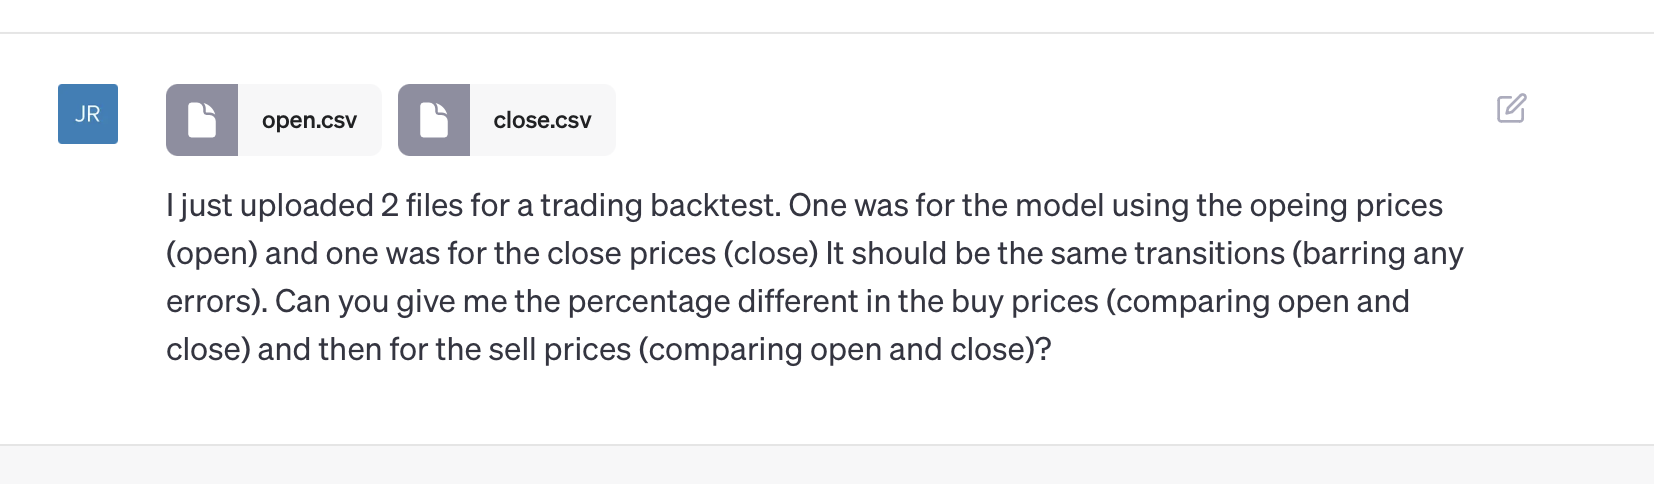
Yea, that worked (sample of only 100 trades to make sure I did not get into any issues for upload size):