I am not trying to hijack this thread but I definitely sympathize and agree. And it is an unbelievably important topic, here and elsewhere.
I wish Yuval or Marc could give us another truly great explanation and make this intuitive for all of us. Honestly, if they could I think we would all be making a lot of money without a sweat. We would get it. Get how all the factors are interacting and see the patterns without needing P123 or anything. Of course, if we were that good we would be recruited to work on some quantum-computer project somewhere and be predicting everything flawlessly.
As far as making this intuitive, the mathematicians will not be of much help. They look at this as an n-dimensional space. Remember those matrices from high school algebra? They were supposed to help us with this. It is the best they have for making this intuitive or at least tractable.
Einstein had just a brief, intuitive glimpse at four-dimensions and changed the world.
In a sense, they are clearly right. Their’s is a way to look at it. And Marco can—and does—put those matrices into a computer with a little matrix multiplication, I would guess. Maybe he uses a lot of loops at the cost of some computer time. Either way, one of the great things that P123 does for us.
P123 is solving this for us and we often never notice. Marco is taking care of a lot of difficult math and making us feel like we are the smart ones. He does it seamlessly and that well.
No doubt the mathematicians are right when they say: “No one can imagine more than 3 dimensions in their heads.” And even they get into HUGE PROBLEMS when they try (Einstein being a rare exception).
For example, they spent decades worrying about local minima (a potential concern for the boosting Steve Auger uses) that GENERALLY DO NOT EXIST IN MORE THAN 3 DIMENSIONS. Instead, there are “saddle points.” Decades wasted by the mathematicians because their intuitive understand of this is no better than ours.
Anyway the mathematicians will say—after a little matrix multiplication–that Yuval got it exactly right.
Every tool has advantages and limitations. The key to success is to understand the limitations and use accordingly. And Jim, I think in one dimension (UP) so the 3 dimension minima that you describe is not a problem for me.
Just to be clear this is a good thing for boosting. I was not trying to be critical of any method.
Also, the only difference between P123 classic and boosting is P123 classic assumes a “flat” hyperplane and boosting allows for things to be flat or a bit of a curve: a manifold. Clearly the same factors can be used for either one.
Oh yea, and pick your poison: manual optimization to find the hyperplane or let a computer do it but learn Python first to find the manifold.
Steve has picked a good tool IMHO. But if your data fits a hyperplane pretty well then P123 classic is probably your best tool. Again just in my opinion. If someone has other reasons to like P123 classic (or boosting) my only recommendation would be to keep using it.
The only point of my posts is that P123 classic is already doing a lot of pretty advanced stuff. Often without the user fully appreciating it.
Yes, that’s the whole point of composite nodes. If you used a simple weighted average, then putting something in a composite node would make no difference at all.
There is an argument for using composite nodes. It goes as follows. You group like factors together. Then you can get a company that is strong in general in each of the factor groups. If you don’t group them together, a company can be strong in various discrete factors but be weak in the group as a whole.
There is an even stronger argument for using composite nodes, and it goes as follows. Let’s take ROE. Using DuPont analysis, you can break down ROE into three ratios: income to sales (net profit margin), sales to assets (asset turnover), and assets to equity. Now you can rank all those separately in a composite node and you get a quite different ranking (and arguably a more meaningful one) than if you simply ranked companies by their ROE. But if you didn’t use a composite node, you would lose sight of ROE altogether as those three factors would just get mixed in with a bunch of unrelated ones.
It’s not a competition among methods and a rational person could end up using more than one method. .
In fact I am using a method not discussed in this thread at all now. Actually a couple not discussed in this thread.
P123 classic is pretty amazing really. And this is a thread about P123 classic and composite nodes. Perhaps I should not have mentioned boosting. I did because I think it is the same topic. They are both just ways of mapping out a flat or not-so-flat manifold in hyperspace.
The topic of composite nodes is an interesting topic.
For the record I have used factor analysis as the basis for determining what factors to put into composite nodes and to determine the weights of the nodes and factors.
So I posted with one perspective on how composite nodes can be used.
It worked and made me money. I’m not going to pretend that didn’t happen just because I am a big fan of boosting too.
My apologies to anyone if I promoted one method too much in this thread about composite nodes or tried to discourage anyone from using something that is working for them or that they want to investigate further.
Jim - you are a very smart guy and most of your posts go over most people’s heads, certainly mine at least. But the message you are conveying (in my interpretation) is that Marco has wasted time and resources updating the API and dataminer because P123 proper is already superior. Please choose your wording carefully.
So what I would like to say here is that XGBoost is a means to an end, it is not the end. I have ideas of replacing it with my own home-brew ML algorithm that writes back into P123 a Ranking System. The ML algorithm will embrace some of the concepts in XGBoost but will not be decision tree based, and will be easily mapped into an RS. The algo could be along the lines of what I already do with the ranking system optimizer, which is at the heart of Inspector Sector’s Cloud Computing.
The API opens new doors for a vast array of applications, not just XGBoost. Thank you Marco/P123 for making improvements to the API and dataminer. I am sure that Jim has great ideas for P123 and I am just as sure that those ideas can be magnified externally using Python.
My apologies for not being clear about my opinions on boosting in this thread. I just get tired of people—including me when I do it—saying their way is the only way to do it. Especially when the thread is just about composite nodes. I was trying to keep my opinions and biases out of this thread and that my have been perceived as a shift in my opinion. What I should have done is not mention boosting at all in this thread. My apologies to everyone for not doing this.
So here is my personal opinion about boosting which I do not think will contradict anything I have said before. My apologies if this is slightly nuanced.
Boosting is a non-linear method.
P123 classic is a linear method in that it uses constants for the weights of factors and nodes.
Boosting being a non-linear method will handle non-linear data better than P123 classic as a general rule.
Most (but not all) financial data is non-linear ESPECIALLY WHEN YOU START CONVERTING THE INPUTS OR PREDICTORS TO RANKS.
Therefore, boosting should be the better method for most financial data, especially when you are using ranks as inputs. And in backtesting I have found this to be the case so far.
Steve, as you know I am the one who introduced you to XGBoost while we were working on some things with TensorFlow. So obviously I like boosting (or I would not have recommended it). This has not changed.
Perhaps we could move any further discussion about boosting to another thread. Composite nodes is an important topic and it deserves its own thread. Yuval has some interesting, important and useful ideas on this topic and I would like to give him (and others) room to express them here.
Attached is the ranking system for Inspector Sector Cloud Computing. It is actually six ranking systems in parallel, each very optimized on its own. Within the individual nodes, you can see that a conditional node is used for bull and bear markets. The condition that determines bull versus bear is when the SKYY ETF moves above or below a moving average.
Conditional nodes can work very well for this sort of application. I recommend making the condition time period based, not factor based. The latter becomes very confusing.
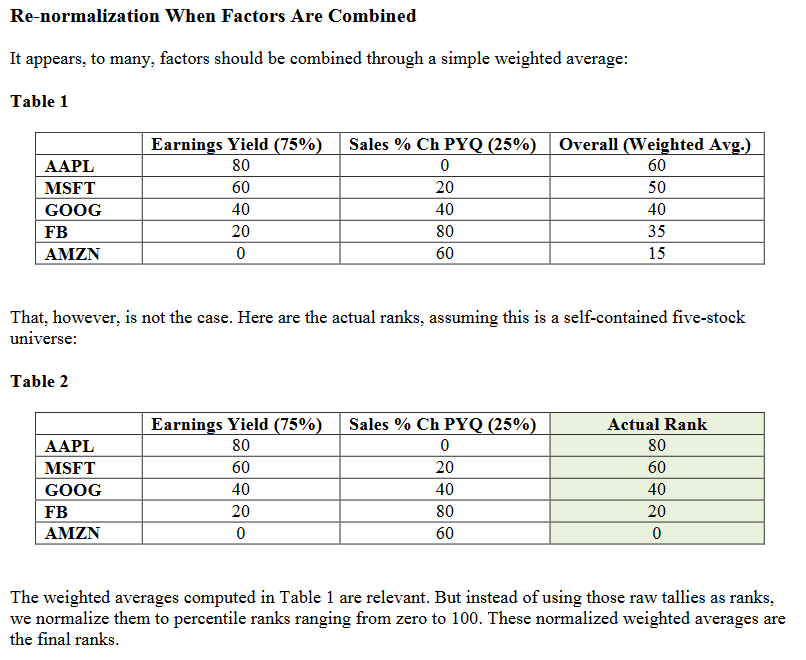
Yuval I don’t understand the “normalization” of the composite nodes at all.
According to this example from the docs, the lower % factor is effectively ignored.
Maybe if I had the actual “normalization” formula, that would explain it better.
In this example I would expect AMZN to have a rank > 0, unless Rank 0 just means last place in the ranking, in which case I understand completely.
I’ve put the example into Excel to see how the numbers work. I’ve normalized values between 0-100. See attached Excel file, also screenshot for reference.
In the end, for this example at least, there seems to be no difference between the top 3 ranks of weighted average and normalized method. There is only a slight difference between ranks on a lower ranked stock.
As noted, I’ve normalized between 0-100. In the examples in the P123 documentation and Yuval’s example, top stocks are ranked 90, not 100. Perhaps this is a discrepancy between the methods.
Please take a look; if there is another nuance, please let me know.
My aim here is not to split hairs, but to make sure I’m on board with how P123 is ranking!
No, normalization is not what happens after ranks are combined. Instead, all the stocks are RERANKED and ranks are assigned accordingly. This is necessary so that composite nodes function in the same manner as a simple node, with evenly spaced ranks, and so that composite nodes actually accomplish something instead of simply replicating what separate nodes would do.
OK, got it now. Clearly the composite nodes do not use weighted averages to rank, as you noted and through my Excel file there would be no difference in the ranking (but have the advantage of grouping similar themed nodes together for ease of management).
All of this said, if composite nodes treat ranks like this, then was the original intent of composites to deal specifically with related ratios only, i.e. like your Dupont ROE example? Or were other applications intended for use w/ composites?
The P123 Core ranking systems all use composite nodes (and often composites within composites). While the nodes within composites are related, should they be shown as separate nodes for the reasons discussed in this post? Or are the composites used in these P123 ranking systems for demonstration/presentation purposes, to group similar themed nodes?
The composite ranking method has always been the default method at Portfolio123, and when the ranking systems were originally designed they were designed to use composite nodes. This was based on the idea that one should rank stocks on value, growth, sentiment, quality, etc. separately first, and then combine the rankings to get the best stocks. This certainly makes some intuitive sense. One could argue, for example, that because all value ratios share one common element–a stock’s price–it makes more sense to come up with an overall value score than to weight each value component separately.
By not using many composite nodes myself, I’m being heretical.
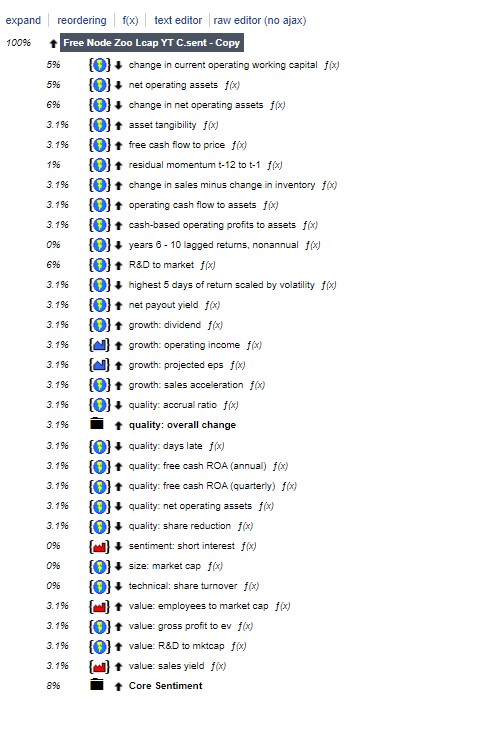
I’ve gone over the conversation. As far as I can understand, it is preferable not to group the nodes in Composite nodes unless the criteria are almost identical - one factor (Yuval), as in this case with Sentiment in the attached system. I merged the Yval Large Cap System and the Zoo.
How would any of you proceed now to provide the appropriate weight to the individual criterion (node) without overfitting?
Would you test the individual node against a certain universe and the number of shares in the portfolio you want to hold over a 10-year period, and then assign the individual node weight based on the total return it provided in the universe?