No, I’m doing it in Excel, which is what I use all the time. I download the data and paste it into my spreadsheets. This is cumbersome. The Theil Sen estimate would be easier in R, but I haven’t taught myself that yet.
It’s such an elegant little formula that I wonder it’s not used more often. For those who don’t know it, you take every possible pair of points, draw straight lines between them, and find the median slope. To get the intercept, you draw lines with that slope through every point and take the median of all the intercepts. Algebraically, the slope is the median of (y(i)-y(j))/(x(i)-x(j)), and the intercept is the median of y(i)-beta*x(i).
To answer your question, no. The OSL slope then drops to 0.6392 and the intercept goes down to 0.0306. So it’s not really any closer to the Theil-Sen estimation than it was–it’s just in a different direction. On the other hand, if you remove that point, the Theil-Sen then changes too–to 0.6629x + 0.033. A less dramatic change.
When I can, I use OLS or standard linear regression. ANOVA when things are not linear or when when using nominal independent variables. T-test when there is a large difference in the variances. Nonparametric tests when the the distribution is not normal. And if I cannot meet the assumption of independence or being stationary, I do nothing.
I keep to the basic stuff.
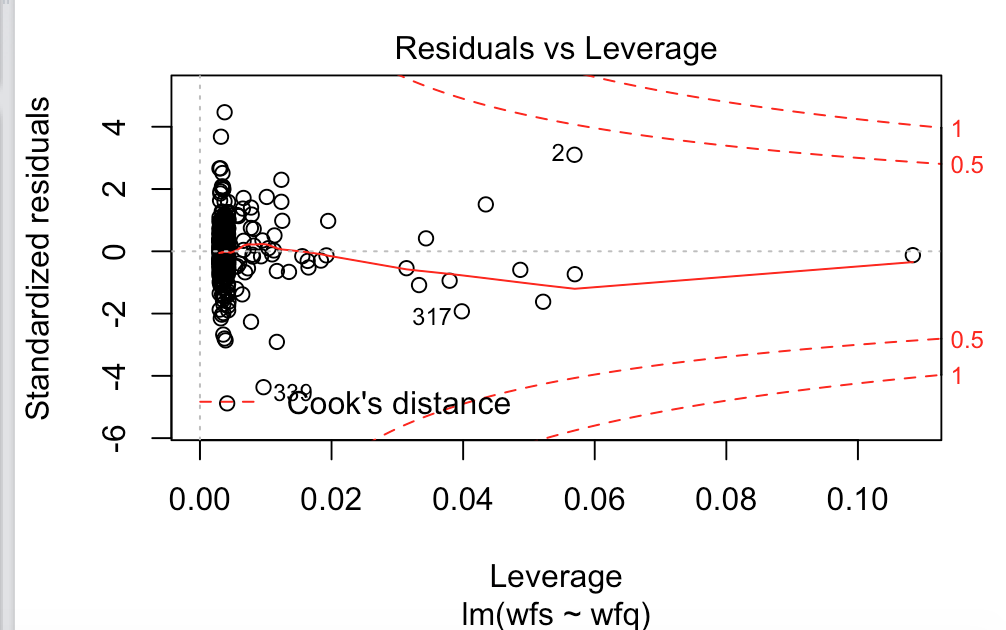
To your main point of outliers, I just remove the very worst outliers (as few as possible) in a non-scientific way. I have played with Cook’s Distance. It highlights the points that have a lot of “leverage” and have a large residual. An example would be an outlier far to the right of the x-axis. Being far to the right on the axis gives it a lot of “leverage.” Other points may have a large residual but they do not “tilt” or move the line of best fit as much. So keeping them or removing them has less effect.
My personal problem of with this method is that I have a tendency to keep removing points until I get what I want. R gives me new points to remove each time I run it. I will need to learn a formal way to use Cook’s distance that avoids this problem for me. There probably is a formal way but I may need to just remove one or two points the first time and declare it done. But in any case I am not using it seriously yet.
Probably, Cook’s Distance should aid a person in removing fewer outliers (only the ones with a lot of leverage) and is probably not intended to aid me in overfitting, getting a good looking scatterplot or a high R value. The opposite of my natural tendency. But, obviously, removing some spurious outliers can be helpful in getting a model that may perform better going forward: if it is an art I have not perfected it yet.
Attached Cook’s distance from R.
So I might remove the point labeled “2” in this attachment as it has both a large residual and a lot of leverage.
I did a correlation study to see which better correlates with OOS results, alpha calculated by OLS methods or calculated by Theil Sen estimation, and OLS won. (If you want to know my methodology, I invent thirty different ranking systems, find the alpha of the 100 top stocks with weekly rebalancing and some rank tolerance over 9 staggered 8-year periods, and correlate the results with the returns of the top 20 stocks over the subsequent 3-year periods; I then check this with rank correlation.)
One thing I noticed was that when you calculate alpha by Theil Sen estimation, the result is quite close to the median of the excess returns. So I tested that too, and the result was better than the Theil Sen alpha and just about as good as OLS alpha. (I also tested alpha divided by standard deviation for good measure, and the results were worse than the other three measures.) And it’s a lot easier to calculate.
My conclusion is that Theil Sen estimation may be better at calculating slope than OLS methods, but its calculation of the intercept is weaker, at least for my purposes. Historically, the focus of Theil Sen estimation has always been slope; intercept is more or less an afterthought, and there are at least three different ways to calculate it.
So in the future I’m going to be looking at not only the OLS alpha of my results, but the median of the excess returns–something that would never have occurred to me had I not investigated Theil Sen estimation.
It’s a bit of a relief, in a way. Setting up Theil Sen estimation in Excel isn’t easy, and the files are HUGE. But the investigation has been great fun.
One disadvantage that Theil Sen estimation has over OLS regression is that OLS makes a distinction between the X values (observed) and the Y values (predicted) while Theil Sen estimation treats them the same. In other words, OLS minimizes the vertical distance between the points and the line while Theil Sen estimation minimizes the diagonal distance. It makes more sense to minimize the vertical distance, since the X values remain constant from one observation to another: only the Y values change, so the comparison points should be those.
I’m going to try using LAD (least absolute deviation) next, but it’s much less efficient. A correlation study will take a lot longer.
Good point! I think this it true of most alternative statistics. I was going to say that in my first post but I am not quite knowledgable enough to defend it with a mathematical proof–or even quantitate it–if I were questioned. I just know (or think) this is absolutely true.
And this is true about statistics that use median, too, I think. And one other thing that is intuitively true. The mean means more (no pun intended). If I know the median home price of new homes and the number of new homes sold in a year I do not know much about the total price paid for new homes in a year: and really just cannot calculate it. With additional information about the distribution of prices I can finally get it, sort of. With the mean and the number of homes sold I got it with one simple multiplication.
I get why people who work for HUD and social justice warriors are so concerned about Median Housing Prices.
But this goes double with, say, slippage or trading costs. Why would I even care about the median slippage of my trades?
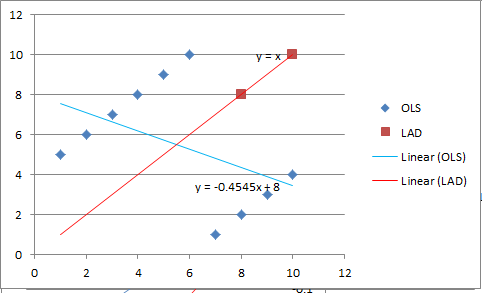
Check out the diagram below, Jim. For the blue diamonds, the blue line is OLS regression, the red line is LAD regression. The x-intercept for OLS regression is 8; the x-intercept for LAD regression is 0; the mean excess return is 0; and the median excess return is 4.
Now do you see why I like using the median excess return?
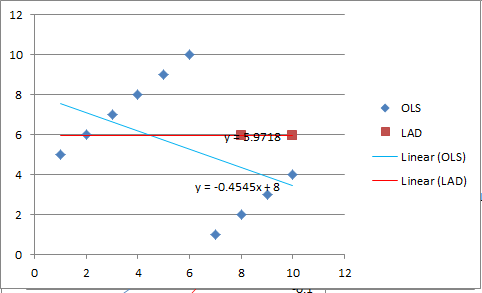
I made a mistake with the LAD line. Here’s the correct version. LAD intercept is 5.97 (according to computer calculations using successive estimations) but should actually be 6.0.
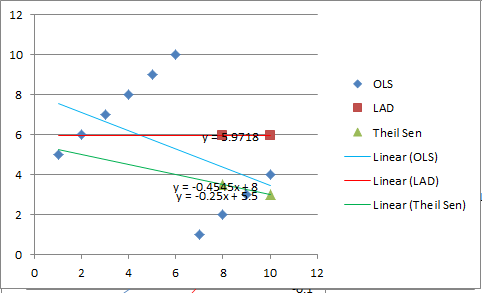
Just for kicks I added the Theil Sen regression line too, in green. The intercept is 5.5.
For what it’s worth, it seems to me, intuitively, that the correct intercept should be 4. That’s what I would predict given this data set. And that’s what I get using the median excess return rather than any of the linear regression options.
Now, obviously, linear regression shouldn’t be applied to data that looks like this in the first place. But I just wanted to make a point about using medians.
I see what you are saying. I would just have said—to myself—I should not be doing an OLS on this. And actually, a mean or median of 5.5 looks pretty good.
I defer to you on why you did a linear regression to get this (in this hypothetical example).
But it seems clear why you should not be doing an OLS. Is it linear? Is it from a normally distributed population (the data in this sample does not look normally distributed). If not, are there enough data points to satisfy the central limit theorem? Constant variance? And edited for David’s comment below: Stationary?
I am not sure about some of these assumptions on these hypothetical points. But I can see why you might need to use something else. I see your point and agree with it.
I would only add that with a large amount of data that takes advantage of the central limit theorem, I try to make the other assumptions true: when I can.
I wanted to play with Theil-Sen IOT implement a more robust regression in some DCF models I use in P123. For example, the gross margins in some industries can be incredibly noisy because impairments are highest when revenues are lowest. Therefore, most regression techniques are biased to the upside, with some even going asymptotic. I was hoping to get my head around some better, more robust estimators than can be implemented using P123 syntax.
Based on your discussion, I anecdotally think that Theil-Sen might not be well suited for time-series and/or non-stationary process. However, if you would compare it to something in which the “x” and “y” are concurrent and/or stationary, then the pairwise sampling should increase the statistical significance by increasing the sample size by n*(n-1)/2. This is in effect re-sampling, or in another’s parlance “bootstrapping”
And isn’t there still an assumption that the distribution is symmetrical which seems to be an unfortunate assumption of most nonparametric tests?
But I am seeing the advantages of this test and am learning.
I’m not trying to be negative. I have used some nonparametric tests on things that are not symmetrical: any criticism would have to be directed towards myself first. And almost certainly better than using a parametric test on something that is neither normally distributed nor symmetrical.
I would say so. But it depends on what you’re looking for. If you’re looking for the slope that will best predict future data, then I think Theil Sen is far more robust than OLS, and that it does indeed increase the sample size. If, however, you’re looking for the intercept, which is what I’m after, Theil Sen’s only advantage over OLS is its relative insensitivity to outliers. LAD may be better. The trouble with Theil Sen estimation for intercepts is as follows. Theil Sen approximates the line closest to the points in a diagonal direction (i.e. the distance perpendicular to the line). Intercept is a purely vertical measure. So you want the line that’s closest to the points in a vertical direction.
I just meant to differentiate statistical bootstrapping from its other meanings in finance (e.g., such as starting a business by one’s “boot straps”; interpolating points on a curve; etc).
Perhaps… but in order to assume non-symmetry, one must incorporate additional parameters. More parameters leads to calibration. Calibration leads to increasing chances of over-fitting. Over-fitting leads to the dark side.
In my opinion: A thing which is descriptive and which is also not highly calibrated has better likelihoods of being both predictive and prescriptive than a thing which is more highly descriptive but also more highly calibrated.
Leading to a good next question, I think: has anyone had success in using non-parametric regressions? How would one implement such a regression in P123? As an aside, all of the P123 ranking systems are by default based on non-parametric ranks.
Yuval,
Thank for that. Makes sense. I am interested in learning if you ever do find a “good” Theil-Sen intercept.
I really do not know much about this test and this is making me want to learn more!!!
Honestly, I did not even know it was a nonparametric test at the onset of this thread. So any comments I made specific to this test should be taken with a grain of salt (at best). This assumption of symmetry has frustrated me with other nonparametric tests in the past, however.
Most of the times that I want to use a nonparametric test it is because it is a normal–but skewed—distribution (e.g., outliers giving a large tail on one side). What have I gained in using a nonparametric test that has symmetry as an assumption? Maybe I have actually gained a lot. I just have to wonder until I get a clear answer on this.
Using non stationary samples has been a weakness of mine (and probably remains so). So my question of what is not affected by this assumption remains a question of mine: perhaps out of frustration.
I am all for any methods we can use to go beyond looking at the pretty graphs: which I must admit is a pretty good start.
I remain committed to finding the mean of my slippage with no concern, whatsoever, about the median (or the mode).
With the intent of making no points this is great question. Really great question!
For a moment I thought I was doing better when I stopped making the assumption that the rank performance test was linear and also using a test for nominal (or ordinal) independent variables for the percentiles. Specifically the ANOVA test gets around these assumptions. But I had problems with the assumption of equal variances.
I do think that the central limit theorem does, often, take care of the normality assumption. Do you remember my post on bootstrapping the daily returns: Bootstrapping over 4,000 daily returns gave a histogram that looked pretty normal to me. The purpose was to just get a picture of what the central limit theorem can do with stock market return data. Of course, they do this in every statistics class with other types of data. Stock market return data does not seem special to me with regards to the central limit theorem—as long as it is stationary.
I would be interested in any thought on this. But for now I think it is possible to do some statistics that strictly fit all the necessary assumptions. I just use those when I can and often use statistics that do not fit those assumptions. Or I just look at the regularly spaced upwardly progressing stair-steps of the rank performance test and know it has to mean something–with no proof. As I said, I need look no further than what I have done to find bad assumptions and outright mistakes.