I use the 40 bar SMA of (new quarterly highs - new quarterly lows)% of the S&P500.
This simple timer switching between VTI and BND shows annualized return of 10% with max D/D = -15%.
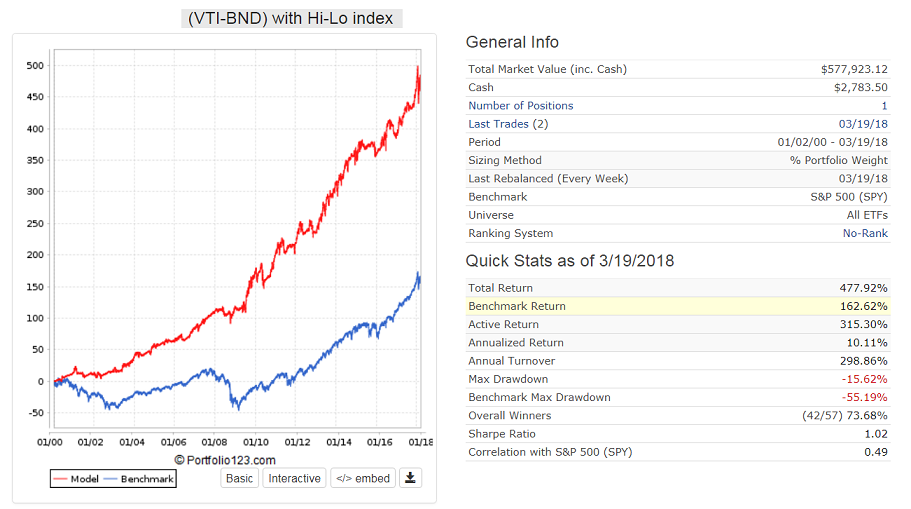
There is something wrong with your model. Turnover is much too high. I use a trigger of 5%. Here is the buy rule:
Eval(SMA(40,0,GetSeries(“Quart Hi-Lo”))>= 5 ,ticker(“VTI”),ticker(“BND”))
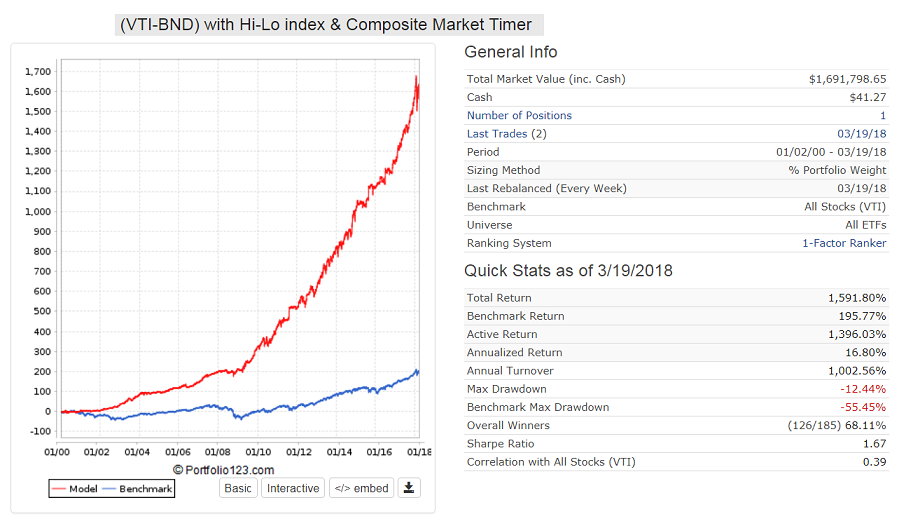
Adding the Composite Market Timer improves returns to almost 17%.
Eval($comp>=50 ,ticker(“VTI”),ticker(“BND”)) | Eval(SMA(40,0,GetSeries(“Quart Hi-Lo”))>= 5 ,ticker(“VTI”),ticker(“BND”))
I must have an error in my custom series then:
(UnivCnt(“hi(0)>=highval(60)”) - univcnt(“low(0)<=lowval(60)”))
invalue!! so after your trading system, we’re entering a bearish scenario when closing today this week under the 20 week moving average, is that right?
Here is the rule I use expressed in percent, -9.4% as of yesterday:
100*(UnivCnt(“Hi(0)=Highest(#High,63,0)”) - UnivCnt(“Low(0)=Lowest(#Low,63,0)”))/UnivCnt(“close(0)>0”)
anybody abandoned this market yet?
I’m also interested to hear from Chris what TA might have told us about the recent drop.
no, still long 130%, up 1,5% for the year, DD 4,5% from high. This market feels like 2015, corrections yes, but no bear market.
USA Bull Case (can change fast)
Earnings trending up like hell, have not seen a market, where earnings trended up and market went to bear market.
still record low interest rates
investor sentiment (again) terrible
USA good demograhics
slowdown yes, but no recession forecast by ECRI
small caps showing good rel. strength
still above 200ma (right sitting on it)
tech revolution (tech, biotech, AI, Energy revolution, converging of industries)
Best Regards (my last bull case is from beginning of 2016!!!)
Andreas
How much of those earning trending up can be explained by Trump’s tax cuts? I assume those were priced in by the large rally in the 2nd half of 2017.
that is what I worry about as well, my system has not seen a spike like that in earnings due to tax stuff.
so I might sell when ma 200 is broken, still thinking…
Make a custom series showing sales growth Q to PYQ for the S&P500. You’ll see +7% growth and increasing growth since the start of 2016. The economy looks good. The trade war issue is a concern, however.
Walter
EDIT: Or better yet, Look at operating earnings before taxes.
No, not at all. Prices being below the 20-week mean – their intermediate-term equilibrium level – is probably just an overshoot of the correction. The error that most investors make is switching to a defensive position (or cash) when temporary, corrective market action occurs. Corrections occur to resolve over-speculation in prices that have moved upward too far, too fast. Corrections are technical, price-centered responses to overextended prices that reposition shares back into equilibrium from overbought conditions.
Overbought conditions were happening in January 2018 as investor enthusiasm about the December 2017 tax reform got out of hand. Stock prices had moved too far above their long-term mean. The resulting corrective action in February and March was likely not the beginning of a bear market. It was simply a temporary price correction, without a change in underlying conditions, which does not call for defensive action.
When, during a correction, prices drop below the 20-week mean it can often simply mean that they have overshot to the downside. Often, because potentially millions of investors are involved, the corrective price response is sloppy and can often overshoot. Of course, this can frighten investors when it appears prices are headed further afield, below the mean. Fear can set in and visions of a bear market play out in the mind. That’s why quantitative systems, as we can build on P123, are mandatory for successful investing.
In the coming weeks, if nothing has changed affecting the underlying, fundamental drivers of prices, then that equilibrium level (20-week mean) will ultimately be re-attained. Markets have a consistent upside bias, so prices generally stay above the 20-week mean. When prices are below the mean, it can provide for a negative weight (out of a number of different factors/formulas) in a ranking system, which is how I have structured some of my RS.
My market regime systems, as has been reflected by others here with their timing systems, is still showing a bullish reading. Although that reading has recently declined somewhat because of a few binary factors ticking downward, so far it appears to be ‘full steam ahead.’
Using the 20-week mean as an indicator has to be taken in the context of the situation. If prices are dropping in a volatile manner to correct temporary technical issues, then not much weight should be put on it. On the other hand, if momentum is declining, earnings are declining, and the economy is steadily losing steam, then a breach of that 20-week mean could be your threshold to exit positions. As with most things in investing, the strength of its applicability depends on the context in which it is viewed.
Chris
By the way, my previous references in this thread were to the 20-week moving average being a ‘mean’ of the market. This is true, but note that it is the intermediate-term mean of the market.
The 50-week (one-year) moving average is the long-term mean of the market. This post is a supplement to my first post on page 1 of this thread. Stocks had gone past the 20-week moving average at the end of last week, which was the question asked of me earlier. What did it mean? I said that in the context of a fast correction, it didn’t mean that much. When millions of investors are participating in moving prices, it is quite common that they will temporarily overshoot equilibrium levels.
In this case, prices continued below the intermediate-term equilibrium and dropped directly to the long-term equilibrium (or 50-week mean). The chart below shows that stock prices reached 14.2% above the long-term, 50-week mean of the market in late January, initially dropped back to the 20-week, intermediate-term mean, and then began to rally. This more recent, subsequent drop went straight to the 50-week moving average and stocks appear to be rallying again.
The last time S&P prices reached a level of 14% or more above its long-term mean was five years ago, so that’s fairly noteworthy. Obviously, a sharp reversion-to-the-mean correction move from that level of overextension should be expected (which is another way investors could have avoided the selloff).

Note that using the Percentage Price Oscillator (PPO), as shown in the lower window of the above chart, is another good way to identify overextended conditions.
With the underlying drivers of equity prices still in expansion, this is likely to be the end of the correction. That doesn’t mean 100% over, but there’s a very high probability that it is. Prices returned back to their long-term mean after an extended rise too far above it - mission accomplished.
And with fundamental drivers intact, the rally should resume – at least for now. There are a number of indications that this nine-year economic expansion is getting long in the tooth. With volatility being a common calling card of market turns, expected a number of volatile situations, similar to February-March, occurring throughout the year.
- Chris
P.S. - By the way, those signals from oversold conditions provided by the RSI and breadth indicators in my page 1 post are now rising above 30 = Buy signal.
Thank you Cris and Walter.
Will stick to my system, it shows very high resilliance (much less vola then the market) and showed good alpha the last weeks.
Regards
Andreas
thanks chris!!!
what numbers do you put in your ppo? 12, 26 ,9 ??
As shown in the key in the lower window of the graphic, I used PPO(1,50,1) when I want to measure the percentage the market had climbed above its 50-week moving average. I recommend always using weekly charts (less noise, more accurate) with the key EMAs being 20 (intermediate-term mean) and 50 (long-term mean).
NOTE: There has been significant technical damage done by the turbulence in the market in February-March. Particularly, long-term momentum has seen significant deterioration following the overbought conditions in late January and the subsequent correction. I’m watching several indicators that are suggesting a market turn is upon us. However, so far, economic fundamentals remain constructive.
I will be watching the 50-week EMA (NOT the 200-day MA, which is an arbitrary number used pervasively by retail investors). The 50-week EMA is the one-year average (52 weeks in a year with 10 market holidays = 50 weeks), so it has meaning. If the 50-week EMA is broken by the 4-week EMA, then it might be wise to liquidate your long positions to prevent losses. You can always buy again when conditions improve and the market resumes a rally. However, this decision should be based on specific rules, which I’ll discuss when if the opportunity presents itself after the Sell rule is activated.
/Chris
Listen to what the market is saying about others, not others are saying about market. — Richard Wyckoff
When buy stocks use fundamental and technical when sell just use technicals, because fundamentals are in 6 months lags. — William O’Neil.
If the price dips below 200 day moving average, ATR and VIX are 52 week high, money is flowing out of stock market into different asset classes.
- Money may flow into commodity, energy, bond, gold, real estate, biotech, foreign stock, usd currency, utility stock and consumer staple stock.
- When interest rates go up bond price will go down.
Believe in asset allocation similar to Hardvard / Columbia university embowment will give 8% to 15% gain in uncertain environments.
Not sure how many have patient to read asset allocation which decides 90% of the investment growth every year.
Most of the time last year winner in asset class no longer winner in the following year.
Thanks
Kumar ![]()