I decided to construct custom series to observe “what factor currently works on the market” e.g value, etc
I am surprised by my results (nothing really works for any decent period of time over the last 2 decades!) and hence I wonder if I am getting my code or logic wrong?
Let’s use a simple one = size → SMB = Small Minus Big using the Russell3000.
(NB: I am aware of the debate as for whether size is a factor in its own right or a mere implication of risk and quality. This is not my point in this post. It just happens to be very simple in P123 using mktcap and hence makes debugging easy)
Create a formula to compute the difference → $Top_Bottom_R3K_MktCap
defined as close(0,getseries(“%Rtn Smallest 20% R3k Mktcap”)) - close(0,getseries(“%Rtn Largest 20% R3K Mktcap”))
You might want to start the chart in 2001 0r 2002 to avoid the huge spikes at the beginning. I made a comment on the custom formula but I deleted it as I just spotted the formula in your previous post.
What is surprising is that other than 2003, small does not really beat big for more than 2 months at a time (with 2003 ~ 6 months)
Yet, my general impression was that small caps did really well in 2016 and 2017 as shown by quite a few designer models that ended-up having a tough time since
It looks like something is not right. WHe the small outperforms it takes the form of a spike upwards not a gradual increase. I suspect that this must be some sort of artifact…
I think I understood what I did wrong in the approach.
I am building a list of small / big caps today. Then look at their returns over the last 12 months.
But: small today are the small of 12 months ago + those that became smaller over that period. Big today are those that were already big or have become big in the meantime. So I ended-up minimizing the 12m return of the Small group and magnifying the 12m return of the Big group by accepting new entrants in each group over the 12m period.
I need to lock-in the group of Small / Big 12m ago and see what has become of their return 12m later.
To do that I can define a formula → $Mktcap12mAgo = FHist(“mktcap”,52)
and the rule in the custom universe selecting the smallest 20% of the PR3000 becomes → Forder(“$Mktcap12mAgo”,#all, #asc) <=600
Jerome,
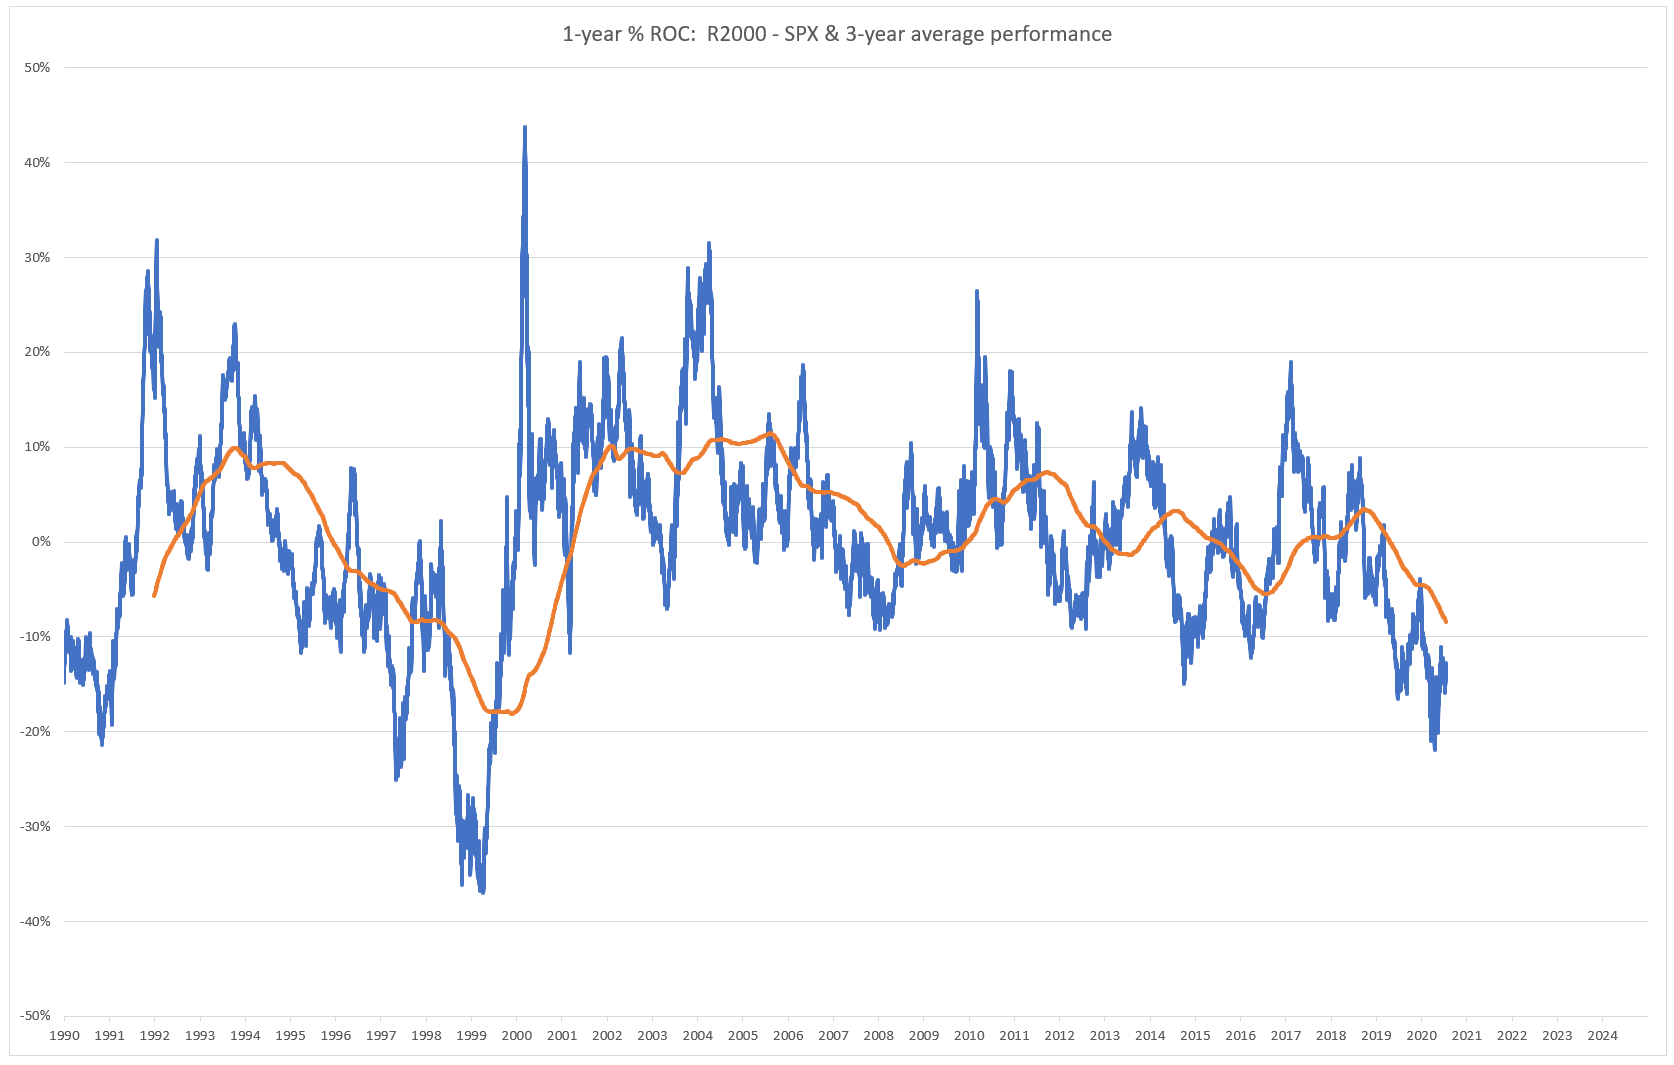
I’m not sure what the issue is, but I suspect that the way you define the universe is having a big impact on your results. I have looked at the 1-year percentage ROC of the R2000 minus SPX since 1990. I subsequently looked at the 3-year average of those returns and the R2000 outperforms a median 1.4% over the average 3-year period. However, if you cut the data in half, the median out performance is 5.2% for the first half and only 0.6% for the second half. I suspect Fed policy starting in 2008-2009 has had a substantial impact on this relationship.
Ihor
If you use FHist you’re going to have survivorship bias.
There’s an easy way around this: use the rolling screen backtests, then download the results and plot them in Excel.
Here are the steps. Create your two universes. Open a screen. In the settings, put in one of the universes. Go to the rolling backtest tab. Use a one-year holding period. Run the backtest. Download the results. Plot your graph in Excel. Do the same for the other universe. Subtract the columns and plot the resulting graph.
You can also do this without creating universes first by simply putting the FRank rules in the rules, or by putting the factor in Quick Rank in the settings and then using the rules Rank > 80 and Rank < 20.
Just create one index for small and one for big. Use average of Close(0)/Close(1). Then for the series chart use the product.Then you have two series and you can compare one against the other.