I want to be clear about how good of an idea this is.
Someone on their own—even with a review of the literature and other readings—coming up with the idea of bootstrapping and averaging simpler models together is absolutely INCREDIBLE!!! Full stop. No qualification.
This is what makes Random Forests popular in theory and in practice. I could share equations as to how this diversity of models (the independence of the models) is helpful. I could even quantitate how much this diversity does help. It is a function of the correlation of the models.
One need not be (should not be) tied to decision trees to use this basic principle. A Random Forest simply serves as a well-known example of where this is routinely automated. Parallel processors was mentioned because each tree can have its own (parallel) processor speeding the runtime by a factor equivalent to the number of core processors (up to 28 for a Mac Pro). But you can run 50,000 trees on a laptop (usually 4 cores maybe up to 8) overnight—the software is the good.
To show you what we are up against: de Prado has Python code that allows each THREAD which to be use is usually a lot of threads. The memory sharing can cause problems , theoretically, but not so much in practice he says. Also Amazon Big ML uses 32 cores and presumably has a lot of memory. This is not very expensive. If one wants to get it done they can do it.
This does work with a spreadsheet. However, bootstrapping multiple different models happens to requires an awful a lot of spreadsheets (arrays in memory for Python)—or you ain’t doin’ it right.
It is just me who would not want to try to do that—even if I thought I could.
[color=firebrick]Whether one prefers spreadsheets or Python, the principle behind this is wicked-smart and Yuval deserves credit for that.[/color]
Thanks for the kind words. I have to say I got both the bootstrapping and the averaging ideas from O’Shaughnessy. After looking into it, what I’m doing is now called “bootstrap aggregating.” There are no trees involved. And I don’t see how you could work decision trees into the process. Or if you’d want to. You can do bootstrap aggregating without using trees.
What’s important to me is to come up with a ranking system without overfitting. It strikes me that bootstrap aggregating might be better for out-of-sample results than creating a system that gets 70% to 90% annualized returns (my bootstrap aggregating system gets a rather small fraction of that). But the actual procedure creates a host of other problems that I’m trying to grapple with. I’ve only begun, really, and I don’t know how it will all turn out. In the meantime, I’ve started buying a few undervalued large-cap health-care stocks, which I’ve rarely done before . . .
There is also BRAGGING. Bootstrap ROBUST aggregation. You might like that. Robust in the sense that you use the median instead of the mean.
Yuval, let me just put this out there without a response. It would not be up to just you anyway, I think. There are a lot of different ways to implement some of this. More ways than you or I could come up with, in that proverbial lifetime.
But get Walter, others and new members using Python……there will be things that I, at least, could not dream of: with regard to designer models.
Just for future thought as you get a better idea of how useful you think this is.
BTW, a letter of intent (of how P123 and I both could benefit) and an NDA and I can solve some of your problems. Not that you won’t solve them on your own in your own way.
I have a model going myself: paper traded. One that uses bagging but may be different in a lot of ways.
[b]Always happy to discuss general ideas but only up to Random Forests (and analogous bagging) for now[/b]
Perhaps a new function that returns an unique stock ID would be helpful here. That ID could then be used in a hashing function to partition simulation universes.
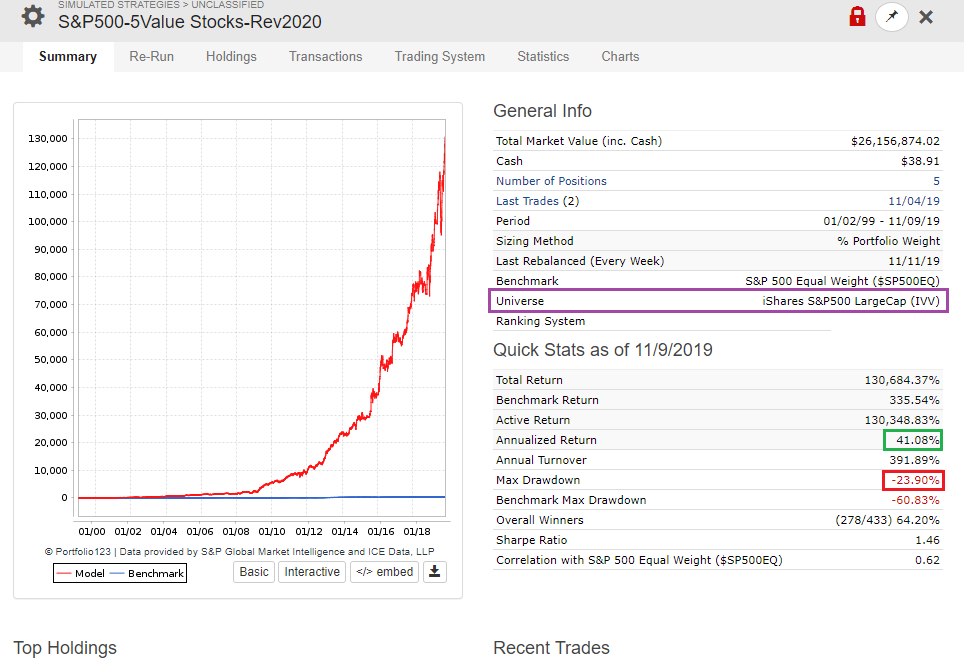
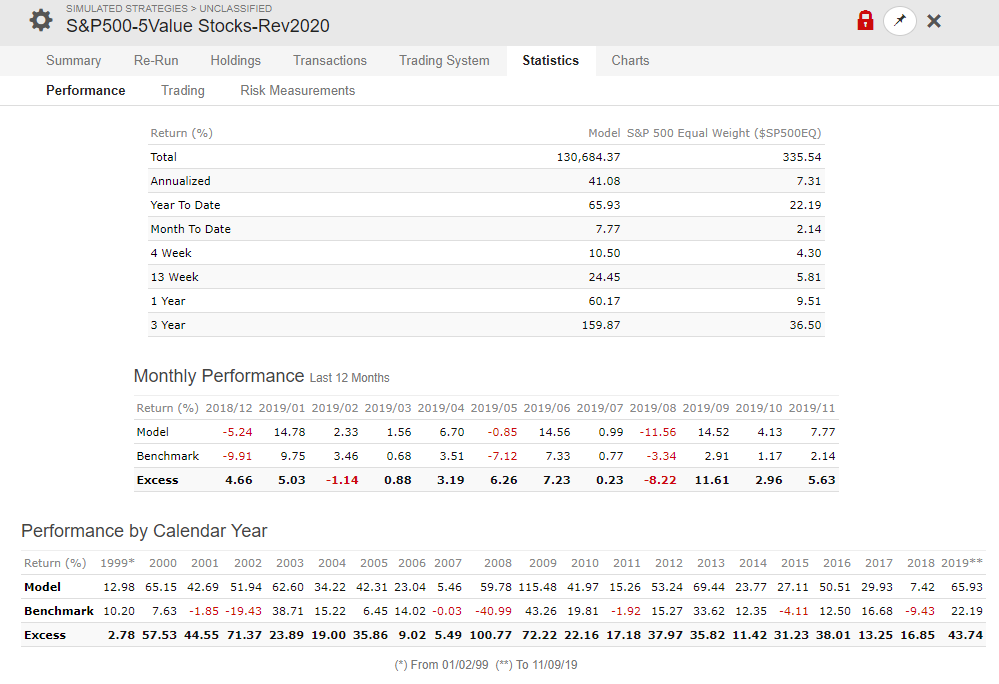
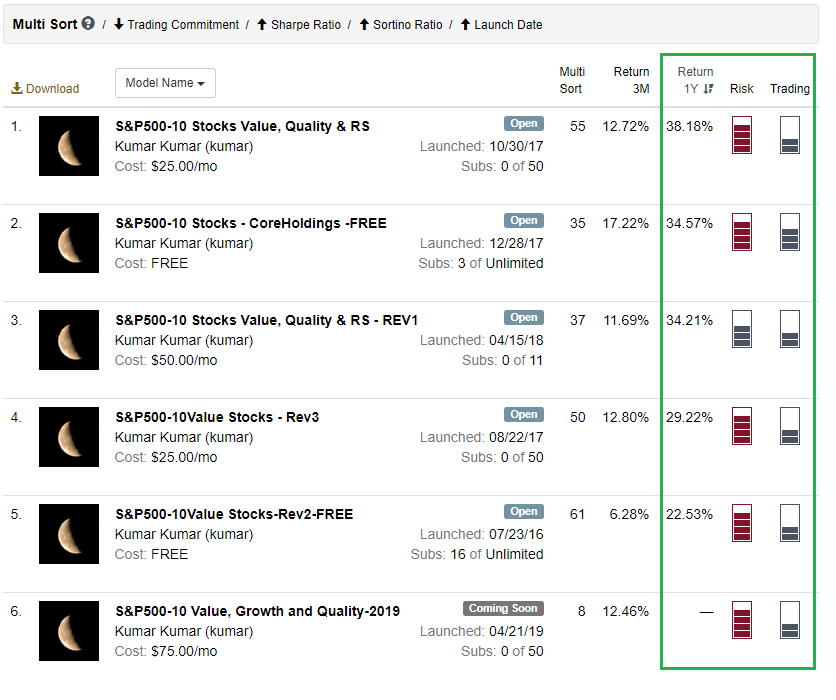
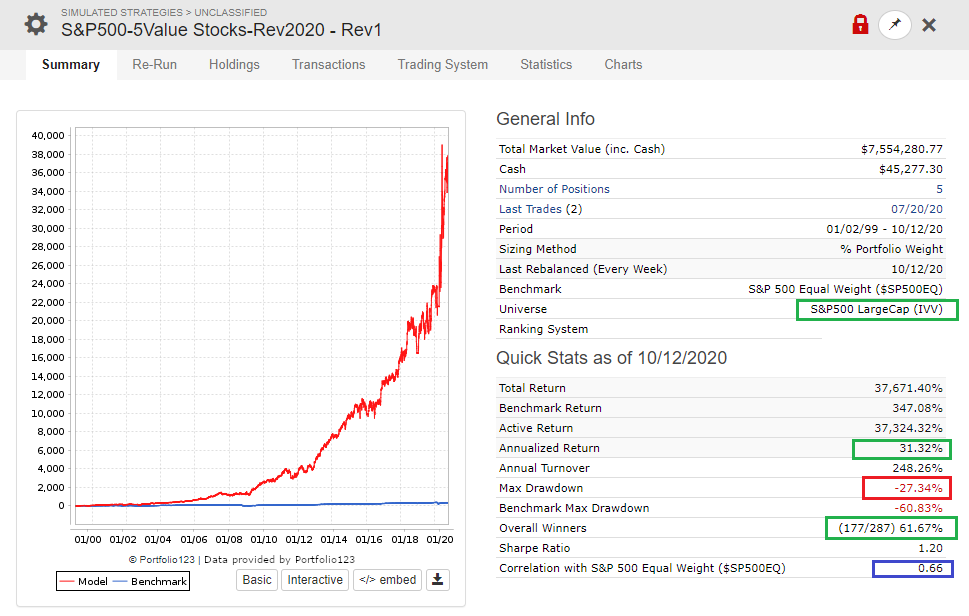
after designing SP500 10 stocks value model for around 4 years.
analyzing the model all of my model;
performance looks just matching benchmark.
and the draw down looks like can’t hold the investment during rough time.
As individual investor we are looking for better return. if we able to achieve 2X return every year consistently using 5 stocks, that is worth the effort, energy and time.
That is the primary reason we are with P123.
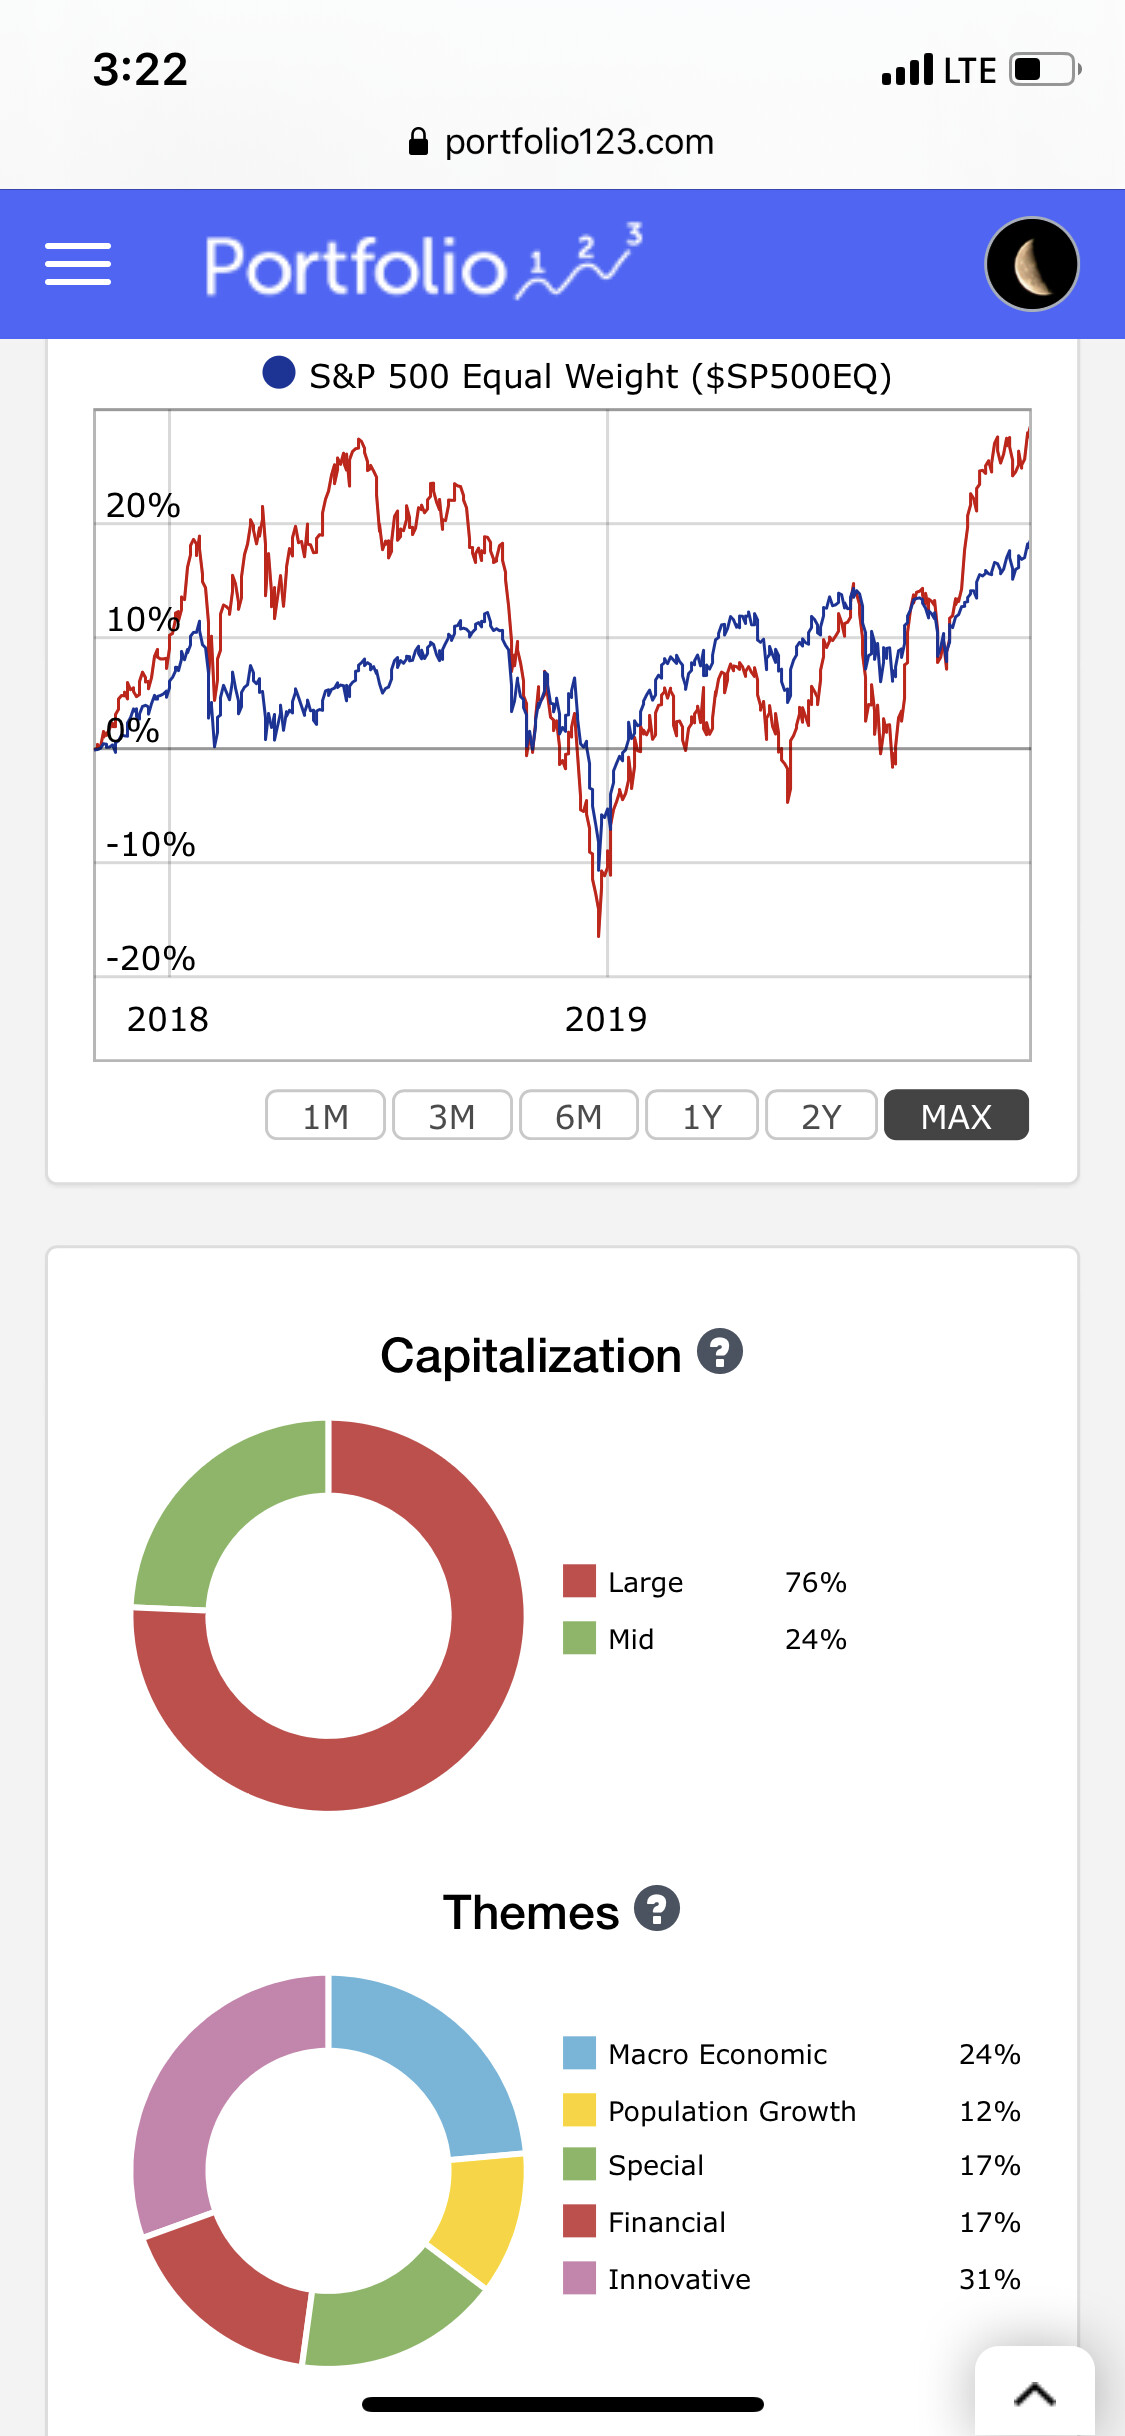
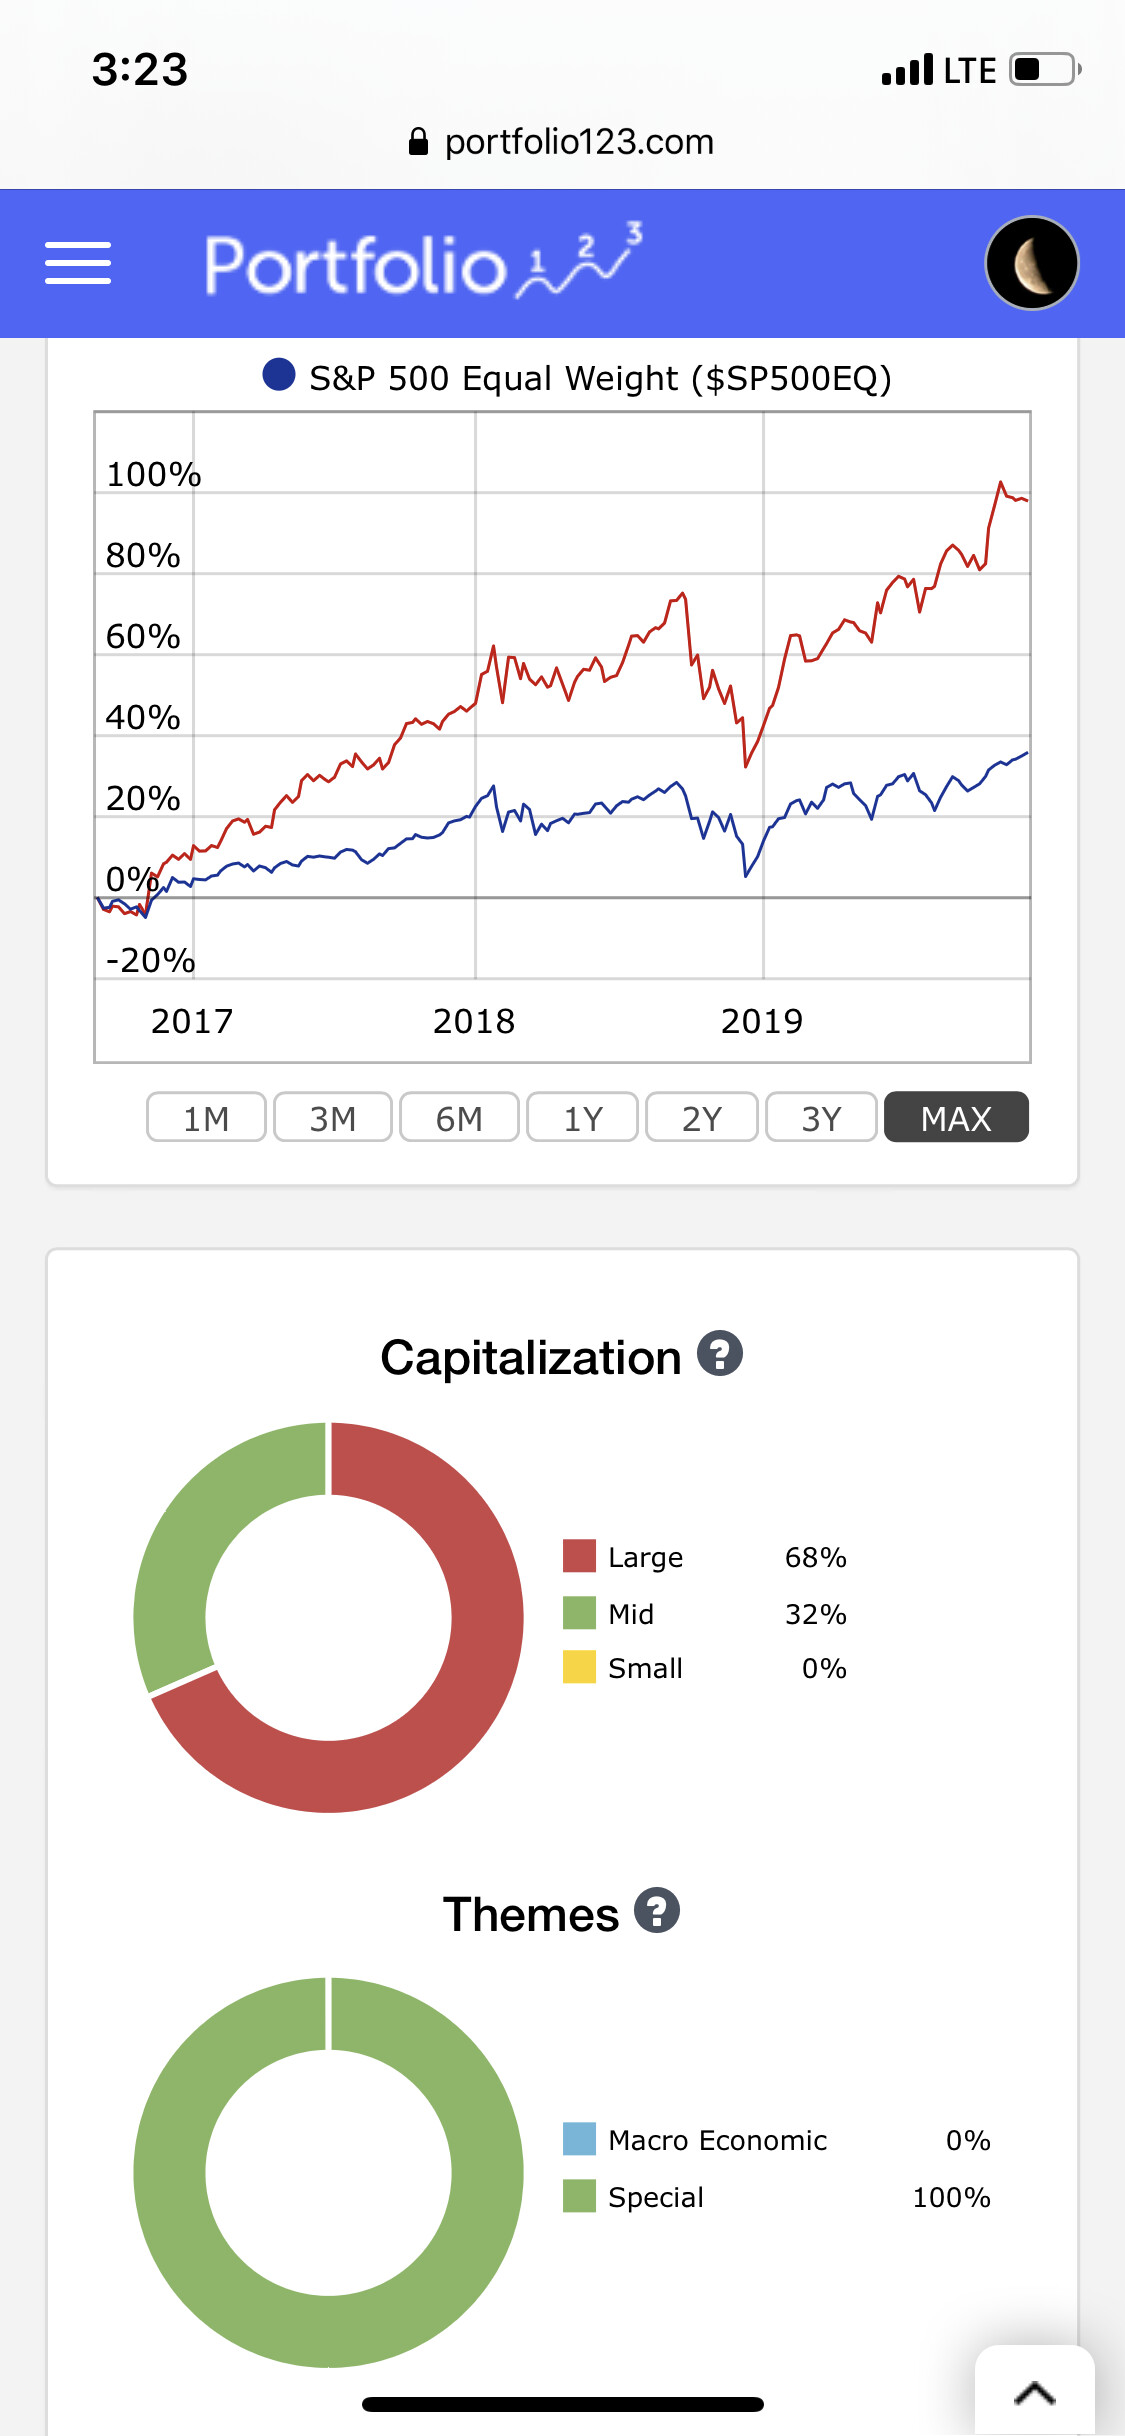
Large cap and liquidity models are working fine with long term holding.
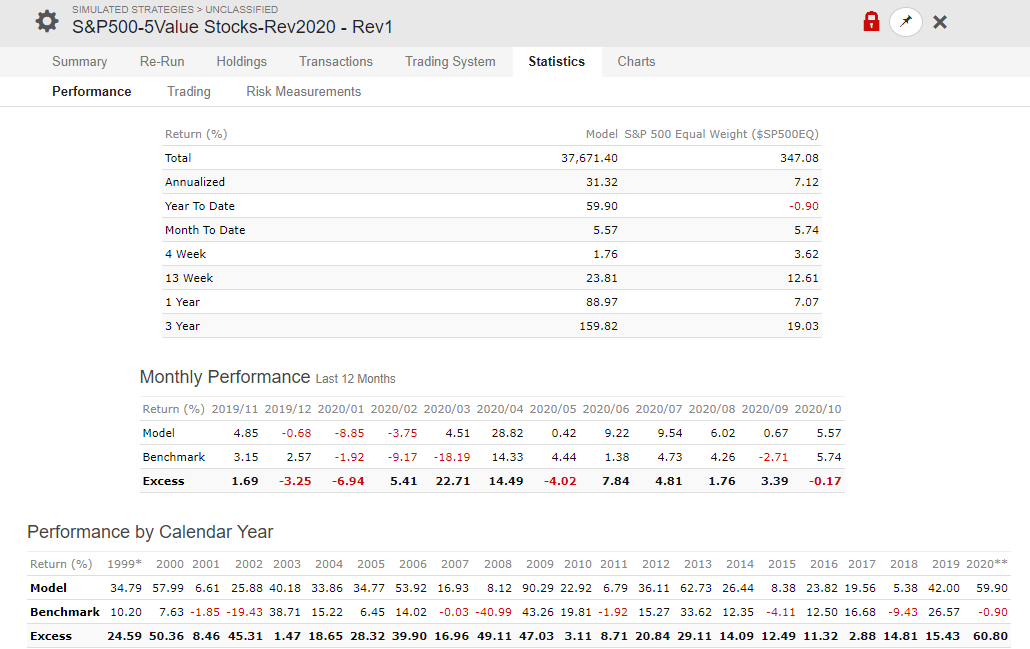
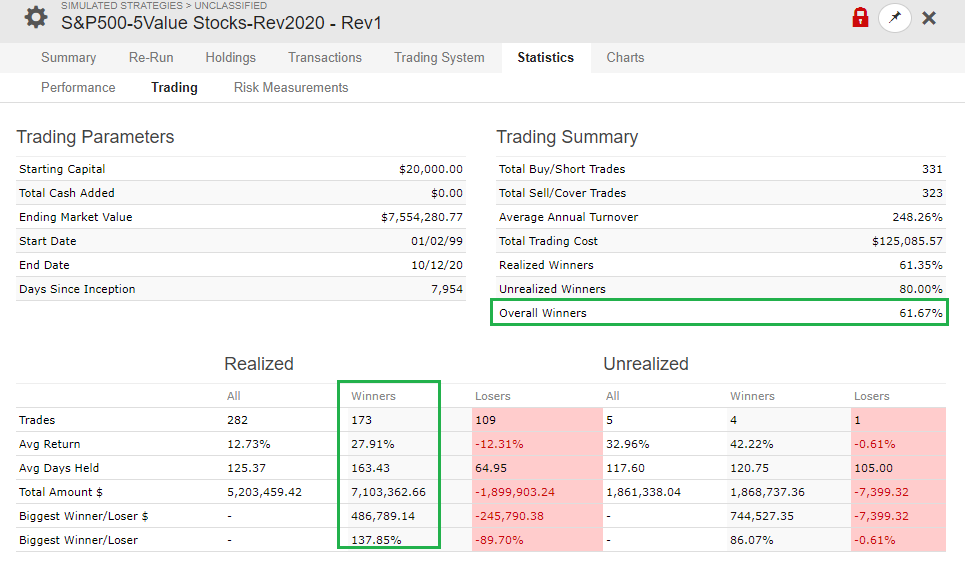
Here, I am attaching screen for reference.
Long term holding, Large cap and liquid models are asset protection and the return anywhere between 30% to 40% per year twice the performance of best mutual fund in the world 15% to 20% average return in 5 years.
Yearly 20 Stocks picks systematic manual pick as best stocks using all of my skills/knowledge. 100% Non Quant System. 12 months holding.
=================================================
If you have right skills and knowledge, I don’t think Quant and Non Quant system makes any difference.
When i was working in Singapore in 2000, I argued with my team lead, i have passed typewriting in lower and higher in first class;
So, I can type faster the program / word document etc.,
My team lead said it does not important how fast you type, the important is what you type (knowledge/wisdom).
My stock market skills is result of 6+ years with P123 and
5+ years dedication with SP500 universe and designing models.
and always kept my best simulation as designer model.
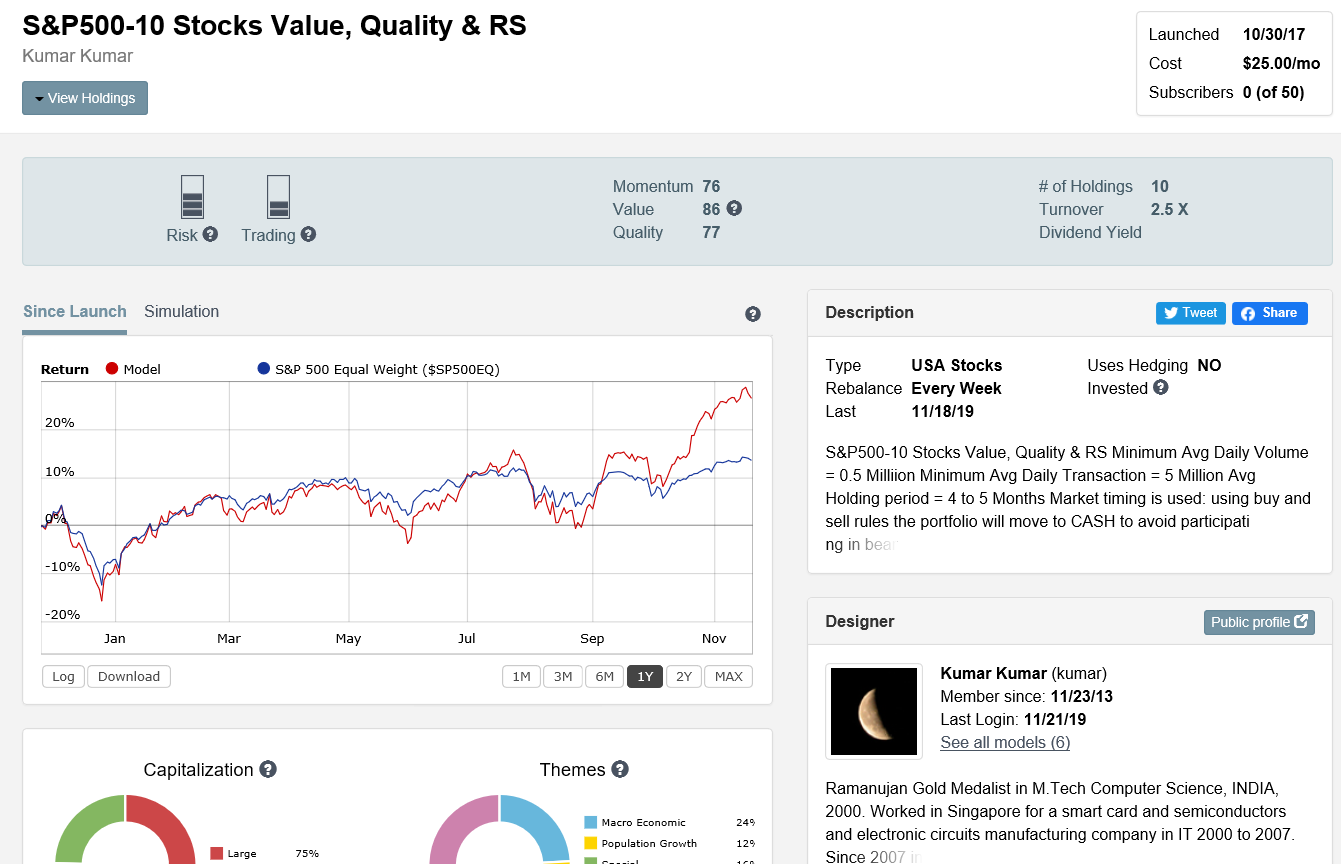
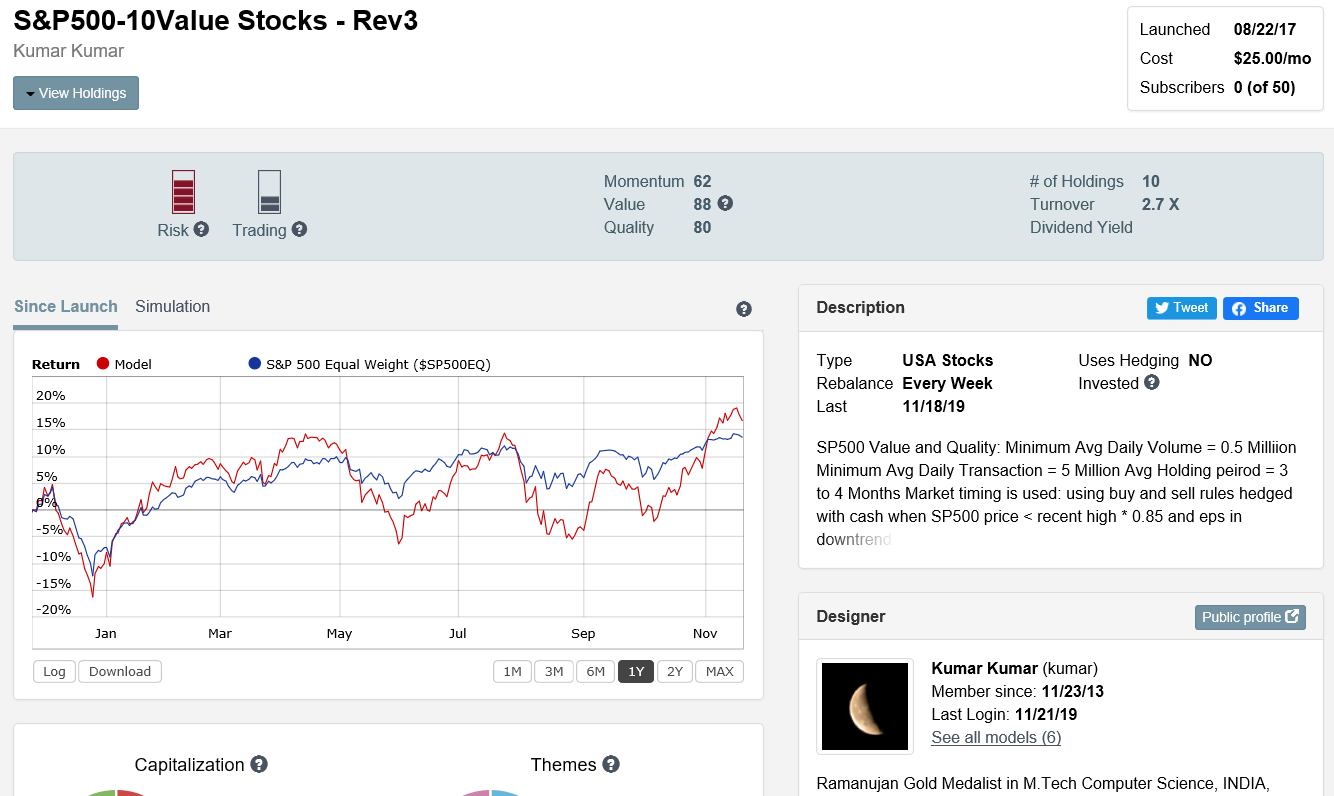
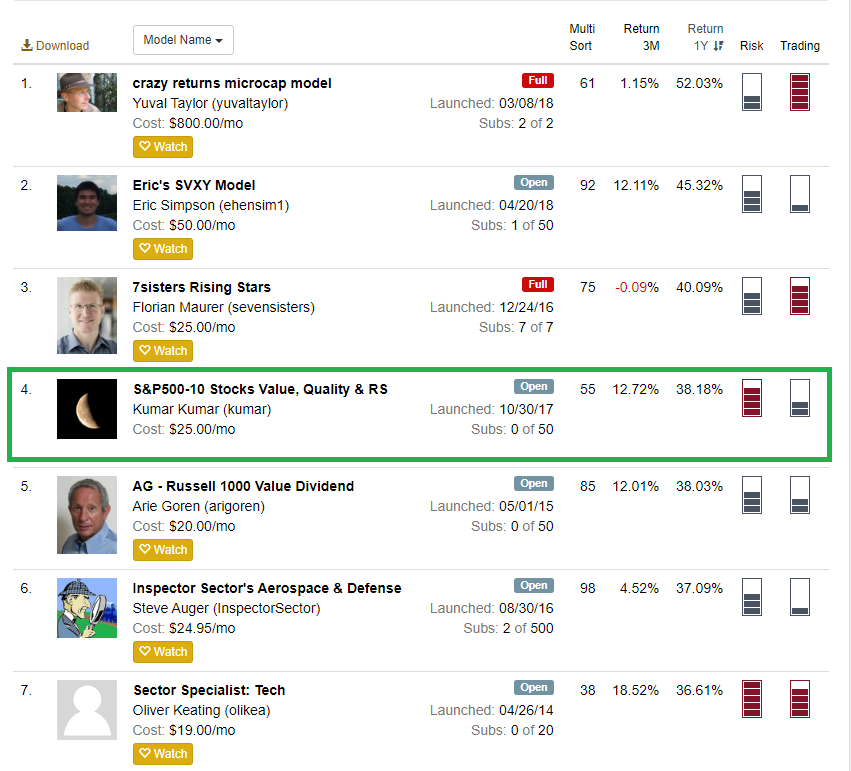
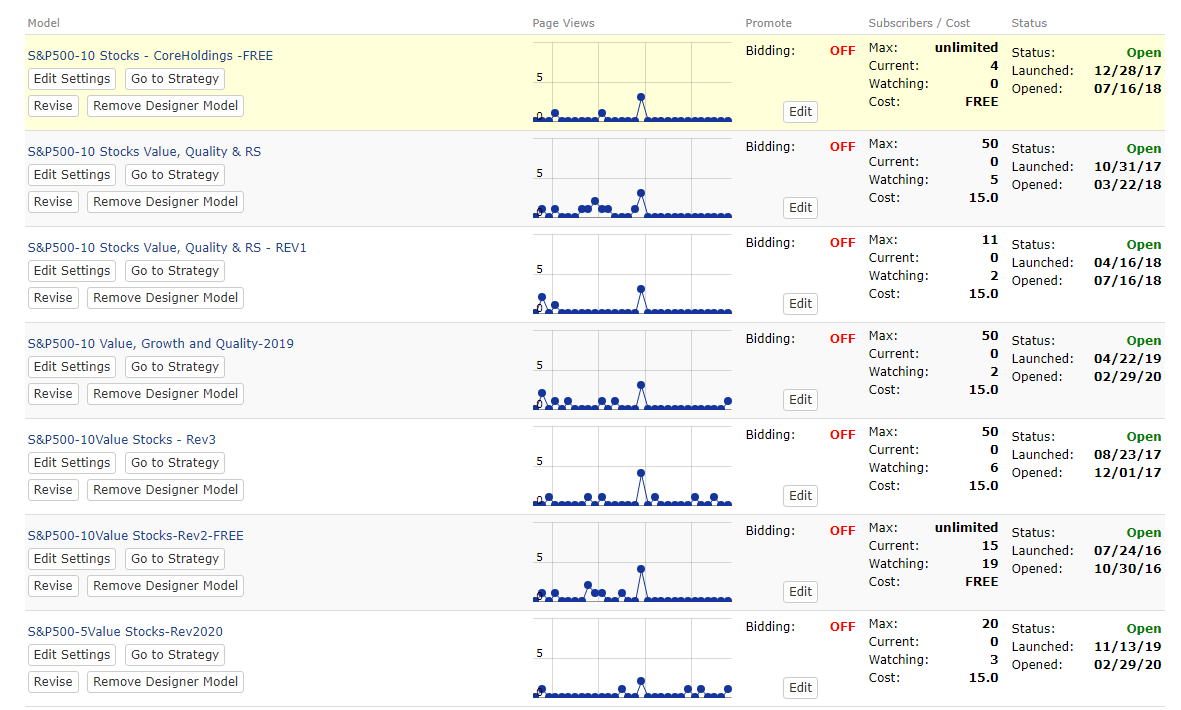
Kumar - I don’t wish to rain on your parade but the claim of “best liquidity models” doesn’t make sense. First of all, 10 stocks is not a relevant criteria. Why not 20? 50? 5? 1? Number of stocks isn’t something to base the selection of a system on. What is more relevant is Alpha, Beta, etc. Looking at the total history of S&P500-10 Stocks Value, Quality & RS, there is lot of Beta but it isn’t clear that there is any Alpha present. Compare this to Inspector Sector’s Aerospace & Defense, a 5-stock model. The indicators next to the model tell you everything you need to know in terms of risk and ability to trade. (See attached).
Your model is awesome with 5 high quality stocks and it is belongs to same sector/same theme. If this particular sector broke, not sure the model will swim against downtrend sector.
My model has diversification with 10 stocks. There is no filter on sector and industry. Only have avoid over weight filter on sector and industry.
If one company go to bank corrupt my model will loose 10% of assets, your model will loose 20% of assets.
In simulation your model took 4 years to get again all time high. My model in less than a year. From 2008 market melt down.
Definitely, I will Learn the quality and momentum from your model.
If you able to achieve same kind of out of sample straight performance curve with 5 sector theme diversified and 10 stocks; i will be your subscriber.
If your model has diversification then the benefits are not readily apparent. Repeating myself, you have high beta, but not high alpha. I reach this conclusion simply by looking at the equity curve since launch. It is not a question of how many stocks the model is holding.
That’s why it is limited to 5 stocks. This gives plenty of opportunity to diversify your investments across multiple models targeting industries with higher than normal growth expectations. The point is to not put all your eggs in one basket. You don’t want to hold one model with too many stocks betting on one strategy that may break at any time.
Investors should also consider the intelligent targeting of industries, not blind trust to whatever industries your model decides to diversify across. We are in a trader’s market and can’t afford to pursue strategies that are not focused.
Aerospace and Defense is a great place to allocate funds while a Republican president is in office. As an engineer who worked in that industry, I learned this the hard way that funding was not forthcoming through the 8 years of Obama administration. If Democrat POTUS arrives in 2020 then one should scale back on A&D. A republican POTUS on the other hand will keep the floodgates open.
Cybersecurity is another industry worthy of pursuing. Healthcare will be a bonanza if POTUS is a democrat in 2020. I can think of a few other industries worth targeting but I don’t want to give away all my ideas.
Your idea is best, it is backed up by your 4 decades of experience with the market and you are with P123 over 15+ years.
I am amazing to see, you are working on new designer model using new ideas. No Sunday to Sun and Steve!
Fidelity sector has 41 ETFs which is investing only 61 industry out of 155 total industry.
IBD50 find 20 industry as growth industry out of 155 total industry.
Still, I need to find a way how the Fidelity
find 1/3 as profitable industry.
In other words how the filtering out 2/3 as weed industries
Kumar - I know that there are momentum strategies out there that choose industry funds with the highest momentum. But it is probably best just to use common sense and I’m sure you have lots of that. Go through the funds and decide for yourself which industries will likely be strong for the current economic environment.
I have kept all of my existing designer model for $15 fees.
I am working on a hybrid model.
UNIVERSE: Manually filtered high liquidity large cap growth stocks;
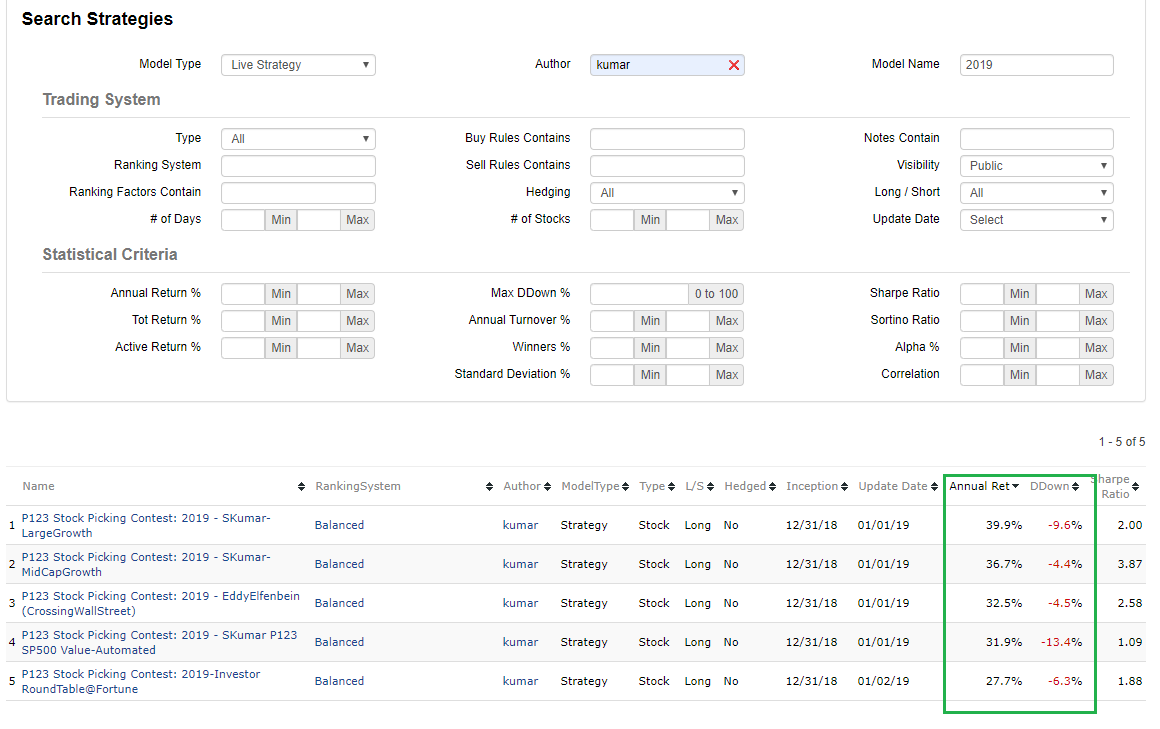
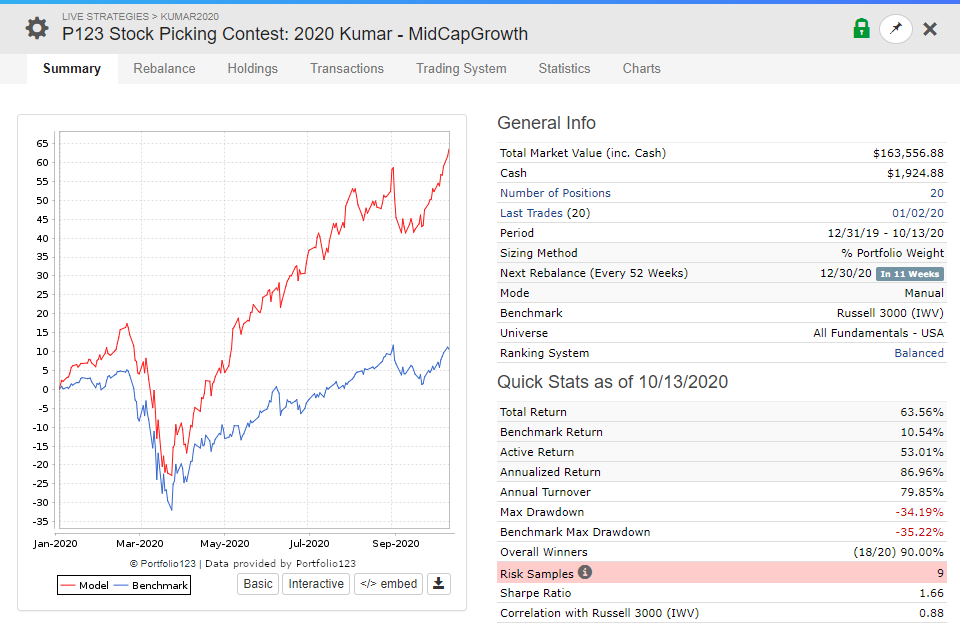
the methodology i have used in 2017 and 2019 in 20 stock pick competition.
it had 20% better return than benchmarks for 1 year holding in 2017 and 2019.
The universe will have 5%-10% changes every quarter which will align with mutual funds reporting date around 15th Jan, 15th April, 15th July and 15th Oct.
RANK: As it is growth stocks, CANSLIM / William O’Neil Rank will be used.
Believe, 20% better return than bench mark like QQQ will attract more investor in P123, the model will use high liquidity safe heaven stocks like AMZN, MSFT, V and MA.
==============
I am not lowering the price because of midst of last week market sell-off.
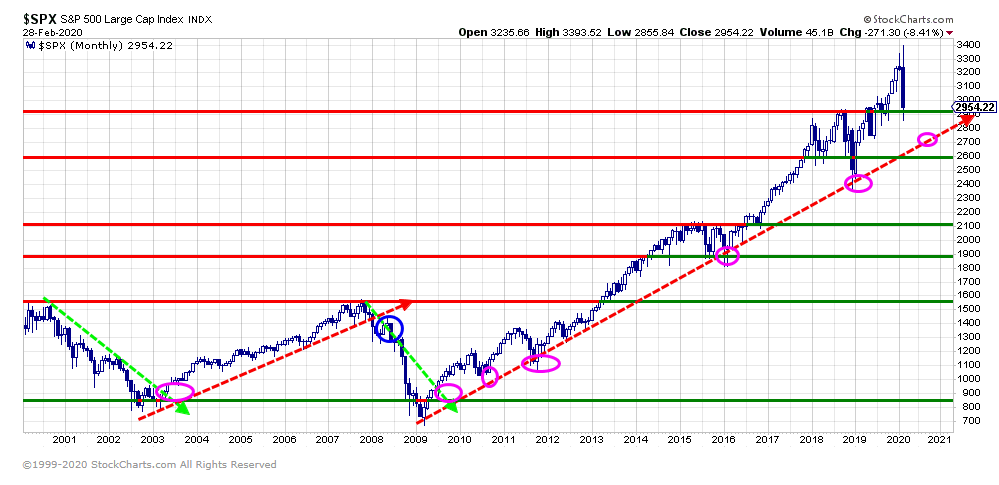
20 Years Monthly Chart is attached.
My personnel perspective: The market is in long term trend.
If the trend breaks in 20 years monthly chart; i will accept market in down trend.
If the price touches the monthly trend line,
need to eyes-open to decide market bounce back from the trend line to continue long-term bullish trend.
If the trend line break need to go to cash and stay in cash until new uptrend line forms and continue.
Sharing my personnel perspective about market dashboard (BULLISH/BEARISH)
makes me stay disciplined and refresh and retrain my mind to think as successful investment professionals and
opportunities always come at midst of difficulty like Feb 2016 and Dec 2018 in the Chart.
I was just recently thinking about resurrecting your thread to see what’s up. Your models have been under-performing tremendously in the last 3 years and you’ve barely posted.
In P123 designer model; except, handful of model; most of the models are underperforming the bench mark.
most of the value models are not working for last couple of years. including all of my designer model.
my annual 20 stocks pick performance is far better than my designer model performance.
I would like to be a investor with holding for 1 years; as i am growing in that domain.
I need to use those 20 stocks universe to pick 5 stocks or 10 stocks ; as designer model. So, i will have more control to choose stocks from
already manually picked 20 stocks universe after applying all the critieria for 1 year holding, which is already successful stock selection for 1 year holding;
success will not be blinder from unknown stocks/unkown company by 500 stocks universe which is very huge as individual can’t trust and can’t focus;
This posted simulation of 5 stocks performance on posted screens, looks promising in simulation i am not sure on out of sample.
I am very successful in manual stocks picking of 20 stocks for 1 years holding; in 2017, 2019 and 2020 i want to make use of those success to design designer model; by not believing on regressive backtest, ranking and buy and sell rules; believing on my 20 stocks picks and some market timing to avoid more than 20% draw down.
I would like to follow the path of P123’s Steve model. Keep the universe in InList and apply minimum buy and sell rule and some reliable ranking systems.
I can’t design automated trading system like 100% automated. I can design manual stock pick for 20 stocks; on top of that i can design 5 stocks and 10 stocks for better than 20 stocks annual holding performance.
I start to focus on out of sample performance from my designer model using what the successful experts do manually and implement that stuff in designer model;
rather than relying on back testing and simulation;
all the media and money making experts making fun of buy and holding investor are loosing; by stating SPY and QQQ performance;
introducing to amature beginner unproved trading systems for weeks; the performance will go south; they will collect their monthly fees.
My top performing P123 competition has very liquid large cap stocks; portfolio of 20 stocks returns 30% to 35% in 2017, 2019 and 2020.
Investing is like running 10,000 meter race. we have more time to relax and correct if we know what we are doing in investing on 1 year holding.
Trading is like 100 meter race. every fraction of second important to make decision; it is costly mistake; very few successful in long run; even the professional loosing shirts and pants in trading every years.
All the web; broker, youtube all are promoting trading; because they can keep the customer engaged in buying and selling without giving timing for thinking.
Dr.Alexander Elder has weekly competition around 100+ members; In top 5 performing annual return member barely beat SP500 every quarters. This is trading for living gang; every week; they need to perform
1 stock trading either LONG or SHORT. Trading is walking on a thread; if we miss timely trading to buy and sell; the profitable trade become a big looser; i prefer to be a invester with 6 months to 12 months
holdings.
I have read one book on investing; Alla Alla Panam - 1, (english translation on tittle: Take and take again More Money from Share Market)
(This book is written on Tamil Language; My mother tongue; One of the indian oldest language spoken in Tamil Nadu, Chennai olden days Madras). Our Vice President Running Mate Senator Kamala Harris’s mother language is Tamil. Google CEO Sundar Pitchai mother language is Tamil.
The important points on investing from this book;
a. Investor waits for opportunity like Feb 2016, Dec 2018 and March 2020 Market Sell-Off
b. Investor buys the best company in the world on market sell-off; ie., AAPL, AMZN, MSFT, FB, V, MA, etc.,
c. Investor has their own trading plan in written format as guidance and strickly will follow.
d. Investor never sell-off when market panic; The investor knows after bear market; bull market will follow; So they believe world will open again as normal again;
market will hit 52 weeks highs in few years;
Without written trading plan / business plan can’t do investment or business can’t blame the share market high and lows or news in website for my success;
My success is in on my written trading plan; need to trade based on the written trading plan with patience; market always come for 52 weeks low every couple of years once;
like Feb 2016, Dec 2018 and March 2020; if we are waiting for the opportunity we will not panic; we will invest for 1 or 2 or 3 years holdings;
As a trader; my mind will think to buy some stocks and sell some stocks don’t care about market high and low; definite way loosing money and scared about trading again for many years;
As a invester; i can keep basket of good stocks in 52 weeks high; when market sell off; i can buy those stocks for 52 weeks low in 6 months or 12 months times; those good stocks will
go for 52 weeks high; i can sell that time to make profit.
Many novice trader/investor including myself don’t know why the professional have watch list and waiting patiently for 6 months and 12 months;
instead of buying stocks in fraction of second by clicking on BUY button online broker account.
The professional investor has watch list as shopping list waiting to buy good business on market sell-off, like buying the best product on thanks giving discount price.
As Individual investor; we no need to be in the market 100% of the time; We can do far better than bench market performance by just following building shopping list and buy on market-selloff.
The other trading method is
Have a margin account; invest 100% cash in normal market; if market fall down more 20% or 40% have the trend line and support line in monthly chart; buy some more current holding stocks using margin.
Once the market is up with 52 week high; sale the stocks bought using margin account and book the profit;
Market going up using 100% our hard earned cash - It is good our money is growing.
Market down ; use the another 100% margin to buy stocks - It is very good; our account will grow in market-selloff 2 times faster than normal market.
This way we will benefit from both Bull and Bear Market. Market is same; how one approach the market with correct mind set make a huge difference.
Expert like CANSLIM, IBD William O’Neil will say buy the 52 weeks high; in an interview with William O’Neil; one IBD subscriber bought all the time 52 weeks high stocks; he talk to William O’Neil he not able to figure out how to make money using IBD stocks; he is buying news paper for last 20+ years;
The secret for the success is patience! more patience! some more patience.
Track the 52 weeks high stock good quality stocks; all the CANSLIM parameter applied; keep in watch list.
Look for the 52 weeks high stock to hit 52weeks due to industry sell-off or sector sell-off or market-sell then buy it;
==============================================
EXPERTS always says to public and in news paper BUY 52 WEEKS HIGH STOCKS;
But Experts will buy the same stock AT THE PRICE OF 52 WEEKS LOWS WHEN OPPORTUNITY PRESENTS. This method only can make consistence profit over period of time.
Any P123 member; please, share your thought on my idea/suggestions;