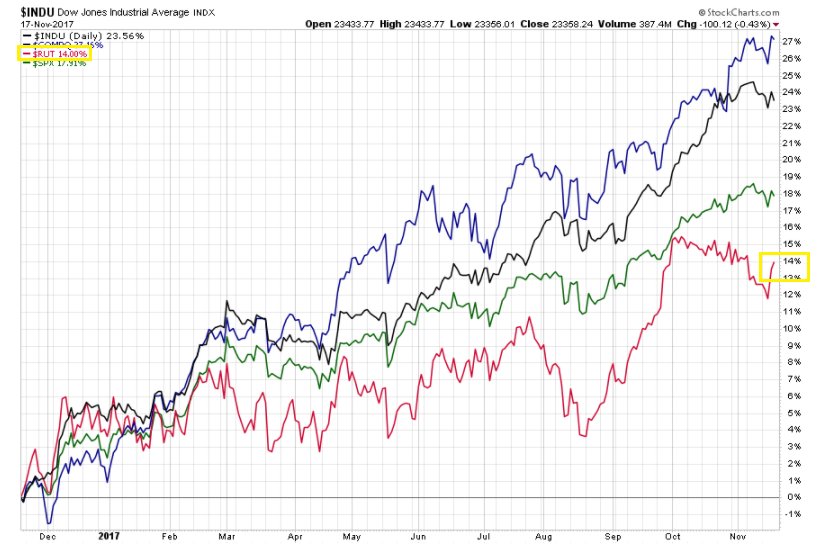
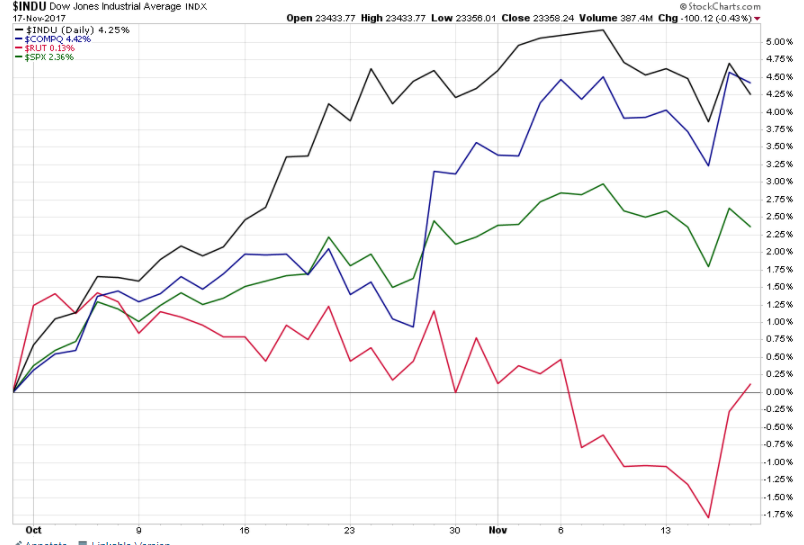
Throughout history, when this occurs it is referred to by pundits as a case of the “Generals charging without the troops” (or some such nonsense). More accurately, it is usually a sign that market breadth is thinning and this typically occurs at the end of bull runs.
However, as Kumar noted, this situation has existed for the last 4.5 years, so it is not “typical.” What is happening is that the historically low-interest rates have artificially favored large, asset-rich companies that can take on a tremendous amount of debt and buy back their stock, thereby reducing available shares and increasing the price. Nevertheless, it may be a setup for other signals to occur that are suggesting the end is near.
For example, while there have been no signs yet that a market downturn preceding a recession is occurring, all the signals are set up in a classic pattern:
1) The Unemployment Rate today at 4.1% is below the historical average where it has bottomed since 1948 (at 4.21%):
As Georg Vrba has shown us many times, when the Unemployment rate bottoms and reverses upward, it is a high–probability signal of a coming market downturn (and usually an imminent recession).
2) The Yield Curve is another high-probability indicator of a market reversal when it flattens (and sometimes goes inverted). For example, this image shows the yield curve in mid-2011. At that time, the three-month bond interest rate was scraping bottom at 0.01% while the 30-year bond stood at 4.4% – a 4.39% difference:
Today, the three-month bond interest rate is at 1.29%, while the 30-month yield stands at 2.78% – a spread of only 1.49%:
When we see the unemployment rate reverse and go higher for two consecutive months, look out! If we also see the yield-curve get flat or go inverted, that is a coincident indicator to reduce exposure to long positions and take defensive measures. Of course, these are classic, high-probability signals from the past. They are also very blunt tools since they deal with information (unemployment rate) or decisions (Federal Reserve on short-term interest reates) made on a monthly (or longer) basis.
Historically, they indicated that:
Historically, these signals indicated that:
1) Rising Unemployment: Employers are cutting back on hiring and are even beginning to lay off workers because of reduced demand going forward, and…
2) Flat Yield Curve: The Federal Reserve usually raises short-term rates to subdue an overheated asset market. In the current situation, it also means the Fed is looking for some room to lower rates to be able to ease monetary conditions when a recession does occur. Therefore, they are currently raising short-term interest rates to have some leeway in the future.
With the three-month rate at just 1.29%, that’s not much “accommodative easing” with which they have to work. It may only be about 3-4 interest rate cuts of 0.25% to 0.50%. Normally, at this point in the market/economic cycle, short-term overnight rates are around 5% or higher. When short-term rates match or exceed long-term rates, then the yield curve is flat. When short-term rates are a bit higher than long-term rates, it’s a classic harbinger of a significant downturn.
Most other economic and market indicators are still looking bullish, so don’t expect these warning signals to go off immediately. However, we are much closer to the end of this epic bull market than many went to believe.
Best of luck out there!
Chris