Denny, after this part “by your requirement that OOS performance over the last year should be at least 50% of the IS performance” there is only one recommendation to you: “spend significant time" to read what you are going to criticize. (hint: I said my stats presented for models with >360 days since launch).
Your analysis must be scrapped at this point. I will put some more thoughts for “less experienced investors”, designers and SEC are so much protecting, mostly with disclaimer statements.
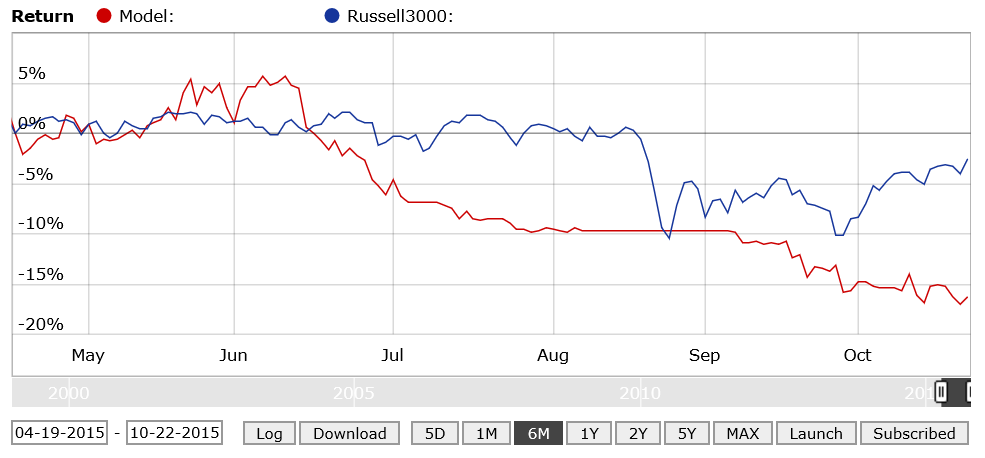
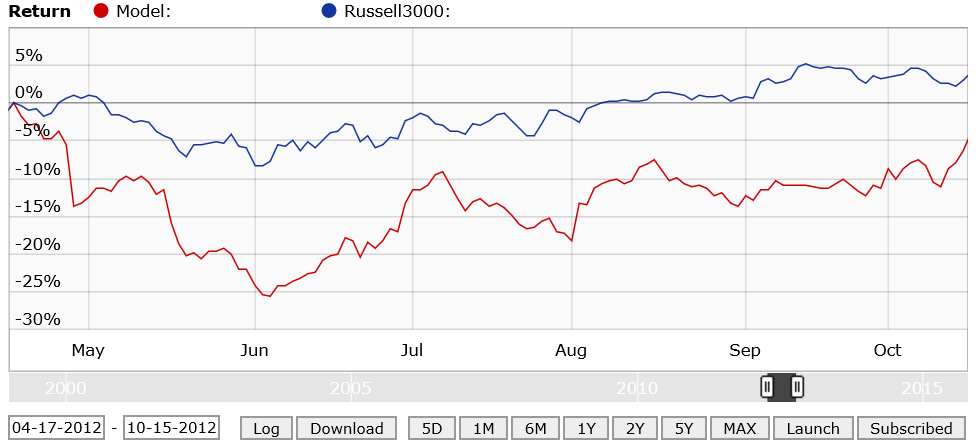
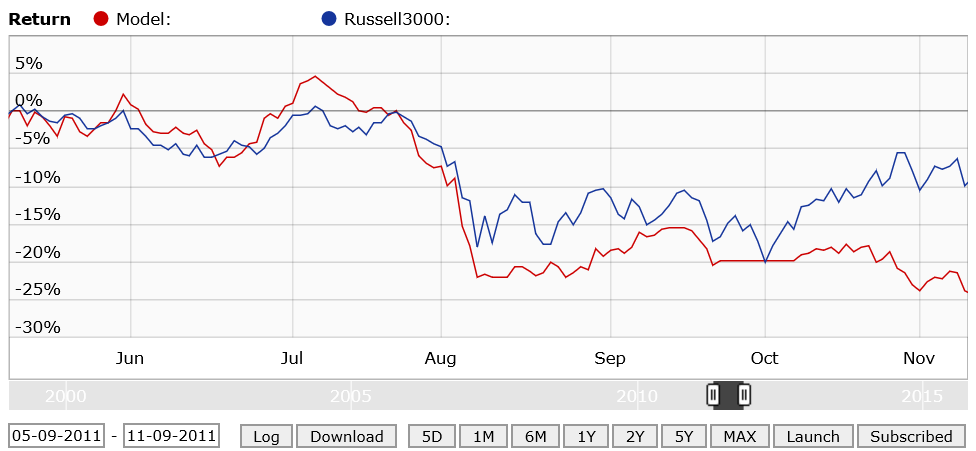
As for OOS, I presented the same sad R2Gs stats as of 2015-02-28, excluding past 6 month “difficult” market you are wondering about in you analysis.
As for comparable markets. While I do formally agree with you and Yury, there were no two equal days on the market in history and never will be, so were no exactly similar periods. And we don’t like R2G timing by subscriber, right? So there are averaging stats for the whole model period. There were a lot of arguments about “difficult” markets not in R2Gs favor. Let’s have a look at those “difficulties”:
SPY 1999.01.08 - 2013.02.22 Total ~23.17% CAGR% ~1.64% (Pre R2Gs launch, IS backtest period)
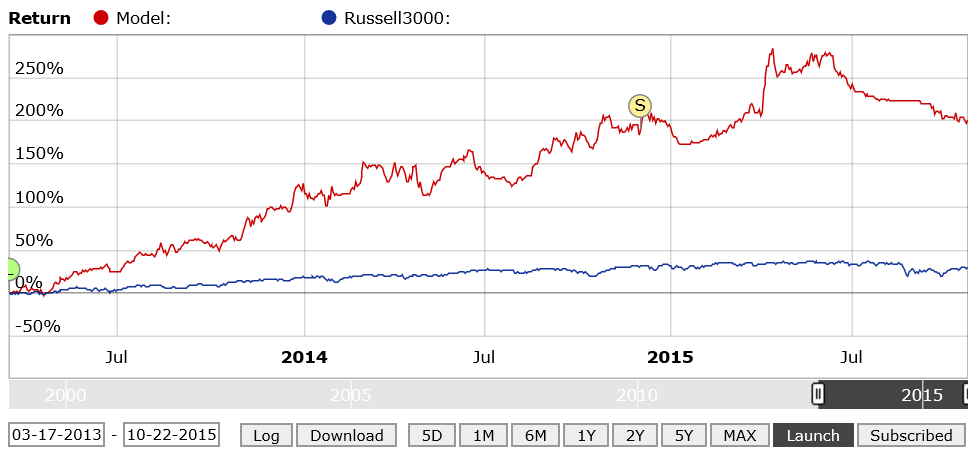
SPY 2013.02.22 - 2015.10.23 Total ~36.42% CAGR% ~13.67% (Post R2Gs launch, OOS period)
This is very approximate performance numbers and periods dates (Google finance data) but it is clear that R2Gs OOS period, including latest 6 month of “difficult” market, was >8 times (in CAGR%) more favorable than IS backtested period.
As for alpha comparision instead of return. Every model have it’s own benchmark, that is again formally correct, but is it what investor interested in? I am interested in model performance comparing to broader market, at lest to SP500, so do P123. There is R2Gs excess stats provided which I am monitoring in line with performance stats. R2Gs excess performance stats is even worse than return performance stats. No wonder having in mind SPY periods returns presented above.
The model you analyzed (TWY 5 stocks HG EMA 11 SYS) is low liquid, microcap, high turnover model. There is no disclosure (at least easy visible and accessible) of this model slippage and trading costs assumptions, so with high probably I suppose those costs accounts for larger part of (if not nearing to) the alpha presented. That mean it is hardly possible to live achieve model IS and even OOS performance presented. Not saying it is totally unsuitable for greater subscribers count the designers are dreaming about (R2Gs under-supply problem).
Denny, I am glad you are happy with 200% gain OOS and >45% alpha for last 3 years screen shots results.
I don’t know how my age corresponds to the investor “grown up” state, but with argumentation like past posts and all the personalities I feel myself like back into kindergarten. And I feel I am, and I think other forum readers, including unexperienced investors, thanks to “argumentation” outlined, getting more and more confident in that simple R2Gs OOS vs. IS analysis.