Steve, Konstantin,
Please stop! ![]()
Steve, Konstantin,
Please stop! ![]()
Andreas, your subscribers acts like any other timing investor, no surprise here. The worrying question here is why fundamental investors act as timing investors, and you too?
My answer is models need strong rethinking in all aspects (designing, expectations, disclosure, pricing etc.). In this respect I greatly support Marc proposals to focus not on different factors (even from different categories) but on factors “logical chains”, then you including sub-factors influencing selected factor (as I understand this, I can be wrong here as I am not a designer).
Konstantin - what I am trying to explain to you is basic. Please grow up and come back in 10 years.
Konstantin,
I recommend that you spend significant time comparing the actual time histories of the R2G Ports IS & OOS data before you conclude that individual Ports are not worth considering.
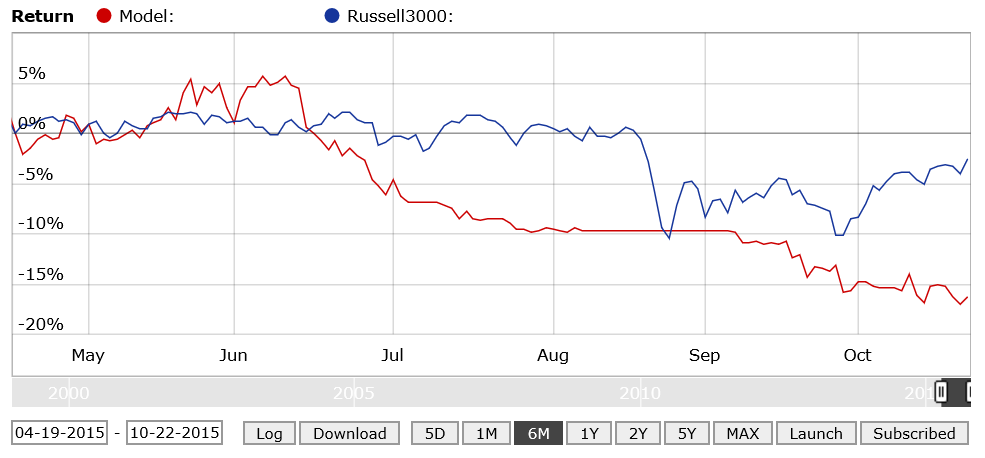
Here is a comparison of one R2G that I have been following for 2 years. It’s a small cap Port with a combined performance of 79% annual return. Since the largest % of the market’s loss over the last year has occurred over the last 6 months, I will compare the last 6 months.
The first chart is the last 6 months in which the R2G significantly underperformed its baseline by over 10% as of today, and has gained less than the baseline over the last year. So by your requirement that OOS performance over the last year should be at least 50% of the IS performance, this Port is a major failure and must be either over optimized or the IS performance is mostly due to luck!
However I disagree. Earlier I said; “It is not wise (or fair) to just state that a Port’s OOS underperforms it’s in sample performance. To make a valid comparison we need to look for similar market performance in the in sample data. If the Port underperformed during other periods when the market was flat or down, then it could just as easily be concluded that the OOS performance is similar to the in sample performance.” So let’s look back over the recent IS past to see if we can find similar underperformance;
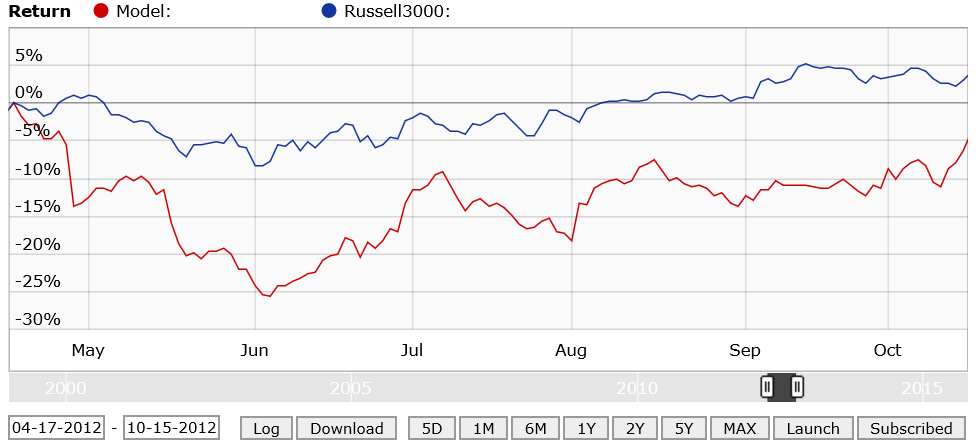
The second chart is the 6 months period between 04/17/2012 to 10/15/2012. The Port was down 17% below the baseline in June 2012.
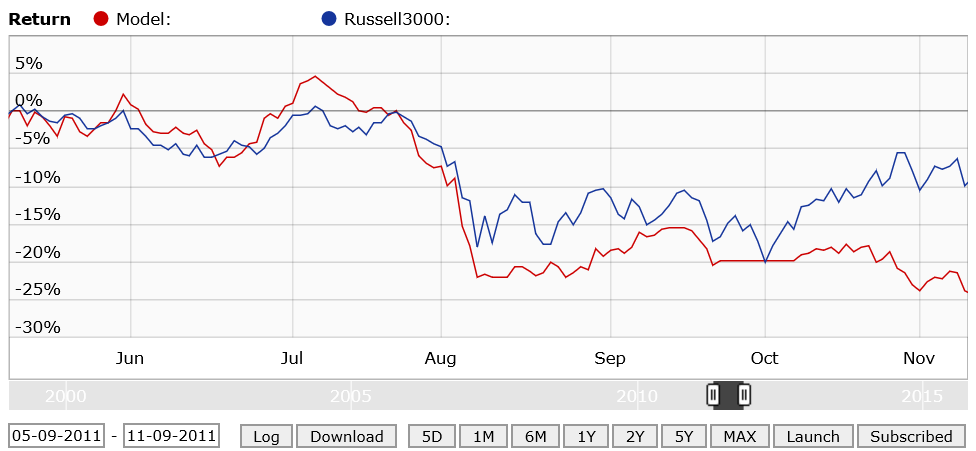
The third chart is the 6 months period between 05/09/2011 to 11/09/2011. The Port was down 14% below the baseline at the end of the period.
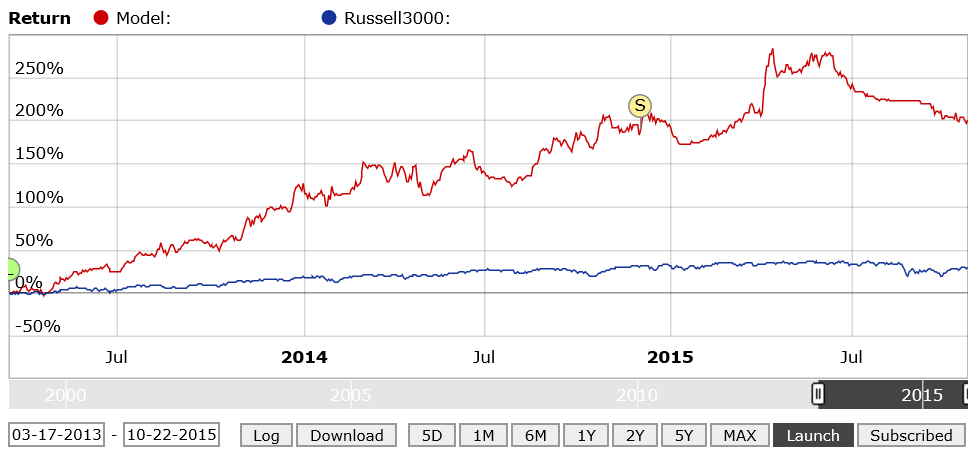
The forth chart is the 2 ½ years + since the R2G was launched. So obviously, your contention that to be considered, a Port over the last year of OOS data should have at least 50% of its IS performance doesn’t hold up in this case. A 200% gain OSS is good enough for me! ![]()
“To make a valid comparison we need to look for similar market performance in the in sample data. If the Port underperformed during other periods when the market was flat or down, then it could just as easily be concluded that the OOS performance is similar to the in sample performance.”
That’s correct, I will add only that performance should be considered on risk adjusted basis (the graphs have to show cumulative alpha not simple return, that’s critical point. For example, after 2008 crash we see that high volatility stocks recovered much faster than low volatility stocks, but if you look on it in terms of alpha it may be conversely. Buying that stocks is maybe the same as buying with leverage, there is no alpha in it.)
Considering this particular graph it is hard to say anything for sure (because we don’t see alpha again) but it looks like it is very small maybe 5-10 stocks system. The correlation to the market is lost during OOS. For the long only systems with 80%+ time in market (when hedge is off) correlation can’t be less than 0.5. It is inevitably. So it is the first sign of stochastic process. Lucky from launch till 2015 year and unlucky after.
Not all the R2G I have selected have worked as well as I would have like, but the 3 books of 5 R2G I have deployed via TRADE with decent dollars invested are tracking well relative to IS tests. Some strategies have held onto losers far too long and are review for termination as I cannot reconcile how the strategy is working based on the disclosure.
I am reviewing my use of R2G because the pricing on many R2G is simply too high relative to the amount of money the vast majority of users will deploy, outside of very bullish periods where a great deal of the return in beta.
If I put $50k into an R2G then I want to pay $17/month based on targeting 0.40% or less. For a profound R2G with market timing and good private disclosure from the designer, then 1.00% cost is appropriate, which is $42 per month.
Yury - here are two examples of 10 ports x 1 stock books. They have close to 1 year OOS. Each port consists of a separate sector and each is highly optimized, independent of the other ports. The R1000 book is up 14% over the benchmark. The R2000 book is up 10% over its benchmark. Both have similar drawdowns to the benchmark.
https://www.portfolio123.com/port_summary.jsp?portid=1263403
https://www.portfolio123.com/port_summary.jsp?portid=1260837
This approach eliminates much of the systematic risk involved with one design, ranking system or multiple ranking systems based on similar factors or similar fundamental models. By using separate sectors, there isn’t the danger of stock overlap that makes multi-ports difficult to analyze. Perhaps when I complete Marc’s fundamental tutorial(s) I will be able to produce even better results. Who knows?
In any case, I think you are over-analyzing the R2Gs. The more demanding you make your requirements, the more optimized the end product must be, and for what? Covering a multitude of market environments, most of which we will never see again. The important requirement is to outperform an appropriate benchmark over time. And remember it is a marathon, not a 100 meter dash.
Steve
Yes, this approach is much more reliable than the previous model. And it should be in R2G section (books should be there).
P.S. I didn’t understand how is that possible that the second system shows negative sharpe while the total return is positive (P123 calculation errors again. They still didn’t fix this problem in books calculation parameters?).
The Sharpe is negative because the equity curve is very volatile. That is one area that I want to improve for the second book.
Steve
Konstantin,
For the Port I presented above, the alpha for the last 3 years is 45.25% (since the Port is 2 years and 7 months since launch the 3 year alpha is a reasonable approximation for OOS). There is no market timing, but the buy rules are fairly restrictive for stock purchases. The Port currently holds only 2 stocks.
The Port has an average gain/stock of 16.6%, with an average days held of 38, and an average turnover of 912%. It has been 947 days since launch, so with Avg days held of 38 there have probably been over 100 stocks traded (accounting for an average of about 78% invested over the period)(It is not my Port so I don’t have the actual OOS trades). Since the performance was not due to a dozen or so high gain stocks, there is a low probability that luck created that much alpha.
Steve, are you serious?!![]() St dev is positive in any case by definition, return is positive too, if we use risk free rate at zero sharpe couldn’t be negative.
St dev is positive in any case by definition, return is positive too, if we use risk free rate at zero sharpe couldn’t be negative.
From one of Marco’s other posts;
Walter
Denny, after this part “by your requirement that OOS performance over the last year should be at least 50% of the IS performance” there is only one recommendation to you: “spend significant time" to read what you are going to criticize. (hint: I said my stats presented for models with >360 days since launch).
Your analysis must be scrapped at this point. I will put some more thoughts for “less experienced investors”, designers and SEC are so much protecting, mostly with disclaimer statements.
As for OOS, I presented the same sad R2Gs stats as of 2015-02-28, excluding past 6 month “difficult” market you are wondering about in you analysis.
As for comparable markets. While I do formally agree with you and Yury, there were no two equal days on the market in history and never will be, so were no exactly similar periods. And we don’t like R2G timing by subscriber, right? So there are averaging stats for the whole model period. There were a lot of arguments about “difficult” markets not in R2Gs favor. Let’s have a look at those “difficulties”:
SPY 1999.01.08 - 2013.02.22 Total ~23.17% CAGR% ~1.64% (Pre R2Gs launch, IS backtest period)
SPY 2013.02.22 - 2015.10.23 Total ~36.42% CAGR% ~13.67% (Post R2Gs launch, OOS period)
This is very approximate performance numbers and periods dates (Google finance data) but it is clear that R2Gs OOS period, including latest 6 month of “difficult” market, was >8 times (in CAGR%) more favorable than IS backtested period.
As for alpha comparision instead of return. Every model have it’s own benchmark, that is again formally correct, but is it what investor interested in? I am interested in model performance comparing to broader market, at lest to SP500, so do P123. There is R2Gs excess stats provided which I am monitoring in line with performance stats. R2Gs excess performance stats is even worse than return performance stats. No wonder having in mind SPY periods returns presented above.
The model you analyzed (TWY 5 stocks HG EMA 11 SYS) is low liquid, microcap, high turnover model. There is no disclosure (at least easy visible and accessible) of this model slippage and trading costs assumptions, so with high probably I suppose those costs accounts for larger part of (if not nearing to) the alpha presented. That mean it is hardly possible to live achieve model IS and even OOS performance presented. Not saying it is totally unsuitable for greater subscribers count the designers are dreaming about (R2Gs under-supply problem).
Denny, I am glad you are happy with 200% gain OOS and >45% alpha for last 3 years screen shots results.
I don’t know how my age corresponds to the investor “grown up” state, but with argumentation like past posts and all the personalities I feel myself like back into kindergarten. And I feel I am, and I think other forum readers, including unexperienced investors, thanks to “argumentation” outlined, getting more and more confident in that simple R2Gs OOS vs. IS analysis.
Whatever, annualized return is about 13%, risk free < 3%
P123 calculates Sharpe as the average of (portfolio return for the month - risk-free return for the month) divided by the standard deviation of the monthly returns. Even if you assume a zero % RF return for the port in question, about half of the months appear to have a loss. It’s hard to tell the exact average monthly gain, but I wouldn’t be surprised if it were zero or slightly negative.
Best,
Walter
No, if you calculate arithmetic average it will be even higher than geometric mean that is 13%. So in any case return is positive no matter how you count it.
If it is processed from Jan 1 to Oct 1 then the Sharpe is negative. i.e. month by month.
Inception Date 12/10/14
Last Rebalance Date 10/19/15
So it can’t be negative if it calculates correctly anyway.
What I am saying is that since the numbers are calculated monthly, the algorithm might start on the first day of the month or last day of the month and recalculate on the same day of each subsequent month. Just speculating.
Steve