Konstantin / Yury - My understanding is that backtest simulation will be removed from R2G. I heard this a couple of months ago… things may have changed (who knows?). You should never have had simulations to look at from the beginning of R2G. Backtest is meant to be a development tool, but is instead being employed as a marketing tool. That is wrong. And it puts pressure on R2G developers who want (or need) to make money from R2G.
You will never likely be able to filter based on backtest or past performance for that matter. The required warnings “past performance is not indicative of future performance” should be taken to heart. These are not boiler plates to be ignored. As I said before, you can only filter models with any ability based on the model strategy and what you know about the author, his track record (OOS performance), your “trust” in him or her.
Steve, designers want money and use tools wrong and… results should be hidden from investors?! If backtest is that bad, let’s take this to the heart “past performance is not indicative of future performance” and disable it completely! I agree and good luck to R2G designers, I’ll come back in 10 years looking for OOS.
Having in mind all the overoptimization discoveries backtest is primarily an investor tool. Because investor put in real money! I’d say this is important even for designer to show backtest, because it seems, large part of model overoptimization unintentional and unconscious.
“Past performance is not indicative of future performance” is not disclosure, it is disclaimer and this is the motto for crap selling.
Mark Twain is credited with one of my favorite quotes of all time: “There are three kinds of lies: Lies, damn lies and statistics!”
Draw from this what you may. This post with 122 contributions (not counting this one) has really come full circle. If you’ve read the entire post can see the kind of backlash Chris Michael’s received with his inflammatory title: “System with 100% accuracy over 55 years…” This kind of headline grabbing doesn’t pass the smell test. Hence the universal backlash from so many prominent users of the site.
Konstantin,
Clearly you feel that some unscrupulous R2G designer has fleeced you for several months of subscription fees. As a fledgling designer, I feel bad that has happened to you. Could it be you didn’t give the model you were subscribed to sufficient time to do its job? My one published R2G model - which is holding on by its fingernails to maintain it’s lead over the benchmark. This model does tend to be very closely correlated to the benchmark in down markets. So really, it’s acting as I would expect it too and as it back tested. The published annual return was around 24% per annum with market timing. About half of the alpha generated comes from market timing (which was not triggered this summer) and the other half comes from stock selection driven primary from the ranking system.
However, since being published, the R2G peaked at a grand total of 2 subscribers. Both have since fleed to higher ground. One stuck around for only 1 month, the other for 3 months. 3 Months? That’s not really making a commitment to an investment strategy, is it? Sadly, the only remaining subscriber is me. I invested about 35% of my retirement fund in this model and intend to stick with it for the long run. Make sure your R2G designer has their own money invested in the models they are trying to sell you; Make sure the chef eats his own cooking.
Lastly, being invested in stocks is a miserable, painful proposition right now. Especially in light of all the Monday-morning quarterbacking going on. Loosing money at equity investing is easy. It takes absolutely no skill or discipline to do that. To earn money at investing, now that takes patience, discipline, the ability to push through the pain. I would also recommend you need to have a finely tuned sense of smell. And for sure, make sure you watch out for those damn lies and statistics.
Konstantin - Designers want money as compensation for the use of their intellectual Property. Otherwise what is the point? Marc provides free models because he works for P123.
Most designers don’t use the tools wrong. I have explained what is wrong and I don’t need to keep repeating myself.
Again. Backtest is not results. Results are OOS and should be displayed as they are the designer’s track record.
I guess we will see you in 10 years then?
The problem is that the IS results become a marketing tool once it is accessible by the subscriber. There is no escaping that.
Yes, most designers unconsciously over-optimize to some extent, myself included. It is human nature. However, exposing backtest results is not likely to change that. But publicizing backtest does mean that designers are forced into designing in a certain way, which I think is wrong.
It is legally required, and for good reason, not crap selling. Konstantin, you are getting emotional, for what reason? Are you losing money on R2G models?
chris355, I like this particular quote of Mark Twain too because this is very true.
As of my feelings about R2G designers, there are a number of facts I could provide but don’t need to, as there is no one fact presented supporting your guess. I joked to Steve once: I can’t loose my money with R2Gs, I am not a designer!
Steve, I am totally defeated, I have nothing in response to your demolishing arguments… just emotions. LOL
I get the sense from some of the comments in this thread that only investments which have recent OOS performance that is similar to its simulated IS performance should be considered. To share my own experiences, I have been using R2Gs for a couple of years now with mixed results. But, the funny thing is that the biggest loss I have had (to date), no joke, is with a Vanguard ETF (VEA) that I bought over a year ago. Its performance is worse than its historical performance by a margin greater than any losses I have had on R2Gs. So even well known ETFs can have their own problems.
Seems like I was a little bit too late with this topic. I just want to add my 2 cents. Please don’t take it serious, I’m just a student and I understand that I still have a lot to learn. Thank you very much for all your contributions to this great topic.
My thoughts on market timing: Unless marketing timing involve going to 100% cash (i.e. sell all your holdings and stay in cash), I support it completely. I just cannot think about staying in cash. Suppose you have a 20 stocks ports and $20M portfolio, moving those money in and out will be a pain.
Yes, you probably can argue that almost all of my alphas were generated with market timing and I have no stock picking abilities. I’m fine with that. My personal beliefs is that I would love to have my portfolios hedged (i.e. somewhat protected) as many times as possible. I just don’t want to miss the big downturn of the market. With the existence of Leveraged and Inverse ETFs, we can minimized our cost to the minimum. For example, shorting SPY will sometime put you in very dangerous position if your shares being called back by your brokers (it’s rare, but possible). In addition, the cost associates with shorting SPY will probably higher than if you borrow 30% of your current holdings and buy SPXU on margin, or 50% to buy SDS on margin, the 3x and 2x Inverse SP500 ETF respectively.
So, in all my ports, I added market timing for the hedge part and a lot of alphas were generated due to the existence of hedging.
This may be out of topic, you guys are welcome to stop reading and ignore my s***
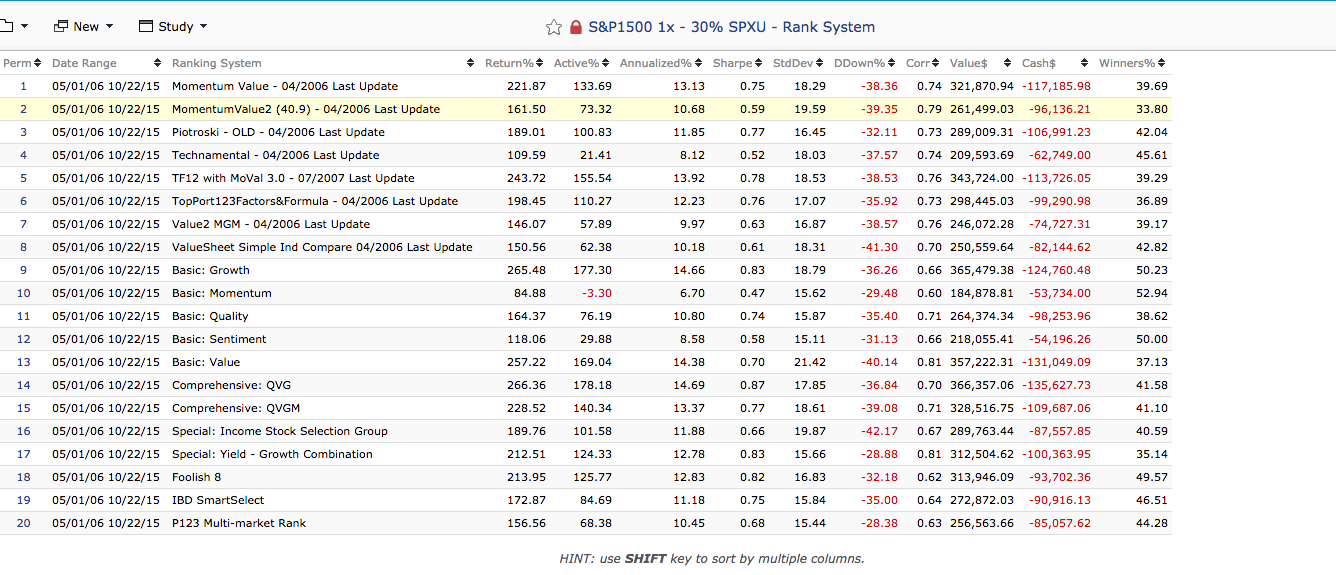
Recently, I think (yes, just think) that with a good sets of buy rules, sell rules and a sensitive market timing hedge, we can generate alphas with, let’s say, any ranking system. I have tested my rules with 20 ranking system of Portfolio123. The portfolio consists of 20 stocks of SP1500 index, my set of buy rules, and only one sell rule “RANK < 25”. That’s it. I think my test can be reliable since I was able to find the last edit date of some ranking system in the public ranking system search. So, with some ranking system, we have nearly 10 years OOS to play with. Pictures is attached below.
Be very careful when dealing with “Chris Michaels” or “Intelligent value”
I spent several hours last time he tried to plug his website on here invesigating him and came to the conclusion that at best he was a liar and untrustworthy.
The first thing I noticed was that he was downloading random photos from the internet and posting them on his website as ficticious “happy customers”. My posts trying to warn other P123 members were deleted by admin.(Very unprofessional)
He also claimed earlier in this thread to be a member of the Better Business Bureau. Yet the link he gives himself doesn’t work and BBB has no record of him. He used to have their logo on his website but has since removed it.
Back to Topic: I think it is too early to say, R2Gs in General “Do not work”, lets wait 2-3 more years and the dust will settle.
There are a lot of small cap models out there and smal caps had a very bad time the last 1.5 Years, and the market
this year has been difficult. Remembers me for 2011, nothing seemed to work then too.
Big Cap Momentum and micro caps work right now, not much more.
I believe that momentum, value, earnings momentum and size worked in the past and will work in the future.
So I stick to my r2Gs and trade the even I am down 8% for the year and have been down 20%.
I called it a a year, hopefully small caps awake in 2016 and I have a good one.
Andreas,
I think we may be paying too much attention to the present time or present circumstances.
I am old enough to have lived through several stock market crashes and many boom times. Does anyone talk about the crash of 1987 today? Or of the Asian / Emerging Markets crash about 10 years ago?
In each case the “current view” was, that the sky is falling, the world coming to an end and the stock market in a downward spiral with no end in sight and the best idea to get out at all cost.
Those were all great BUYING opportunities.
My strategy is simple:
Diversification of portfolios, invest only in iquid stocks, concentrate on value. Not buying with margin, ever.
Expect twice as much drawdown as your backtests show and have a long term view.
Those simple rules have served me well, including this year.
David, I get the sense from some of the comments in this thread that there are too much fear about IS vs. OOS performance inconsistency. Personally I never stated the bold’s: "only investments which have recent OOS performance that is similar to its simulated IS performance should be considered. See how much different your only sentence from what I share as my personal findings.
My previous experience with R2Gs was successful, that is why I am so worrying about the probable luck nature of this performance. And we all see there are a lot of issues to worry about. The question is if the designers address those issues or just keep focusing on subscriptions fantasizing excuses.
Andreas, agree, much more time needed for R2Gs. But is it excuse not to look at the model performance before you can get confident to invest with it? All the investors looking for emerging possibilities. The question here if this fits the designers expectations? (hints: graveyard, pricing)
Werner, the difference is that, it seems, R2Gs looks worse under clean sunny unpredictable skies than under well known mixed weather.
Read the first few pages of disclaimers then skip to page 18 where the warnings go on and on. These disclaimers are forced by the COMMODITY FUTURES TRADING COMMISSION. Many ETFs involve futures. In any case this particular statement is relevant to all models:
Mt position hasn’t changed since the launch of R2G. It isn’t about fantasizing but about the integrity of R2G and protecting inexperienced investors. Now I thought I wasn’t going to hear from you for 10 years
Konstantin, I absolutly agree, but actually that is not how subscribers behave, they jump in my models when they have all time highs and get
out almost at the bottom of the DD, the other way around would be better (though I am not better, did change from a very
sucessfull 3 Month strategy with 100 Stocks (I would be up now 10% for the year instead of -9% right now) to a book of 5 5 Stock modells
at in June (worst time I could have picked) (know I want to ride it out and stick to it…).
Steve, may not ≠ must not, may – mean that an item is truly optional, must – mean that the definition is an absolute requirement. This is primary school (if not kindergarten) logic level and you fail it. You are getting boring.
I don’t know what exactly you don’t understand in the word dis-claimer meaning. It’s not about investor, it’s all about crap seller protection. The real investor protection would be R2Gs overfitting risk disclosure.
P.S. Steve, I find your last thread posts are just out of context quotations, meanings manipulations and false logic. This is the road to nowhere, there we have already been 5 month ago. No need to repeat this, please stay on topic.
Andreas, your subscribers acts like any other timing investor, no surprise here. The worrying question here is why fundamental investors act as timing investors, and you too?
My answer is models need strong rethinking in all aspects (designing, expectations, disclosure, pricing etc.). In this respect I greatly support Marc proposals to focus not on different factors (even from different categories) but on factors “logical chains”, then you including sub-factors influencing selected factor (as I understand this, I can be wrong here as I am not a designer).
I recommend that you spend significant time comparing the actual time histories of the R2G Ports IS & OOS data before you conclude that individual Ports are not worth considering.
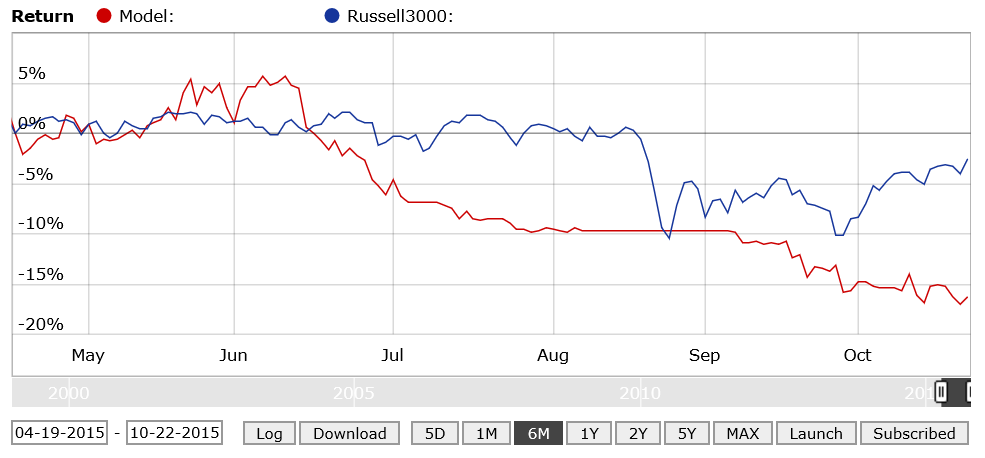
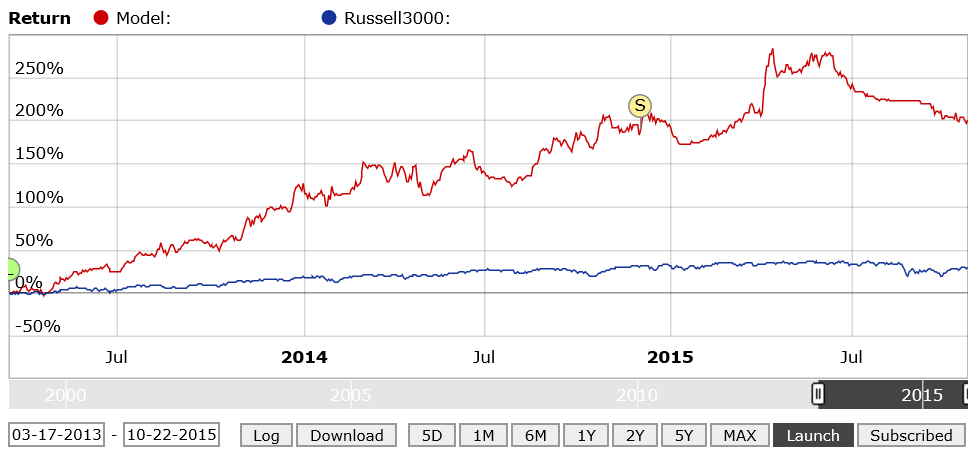
Here is a comparison of one R2G that I have been following for 2 years. It’s a small cap Port with a combined performance of 79% annual return. Since the largest % of the market’s loss over the last year has occurred over the last 6 months, I will compare the last 6 months.
The first chart is the last 6 months in which the R2G significantly underperformed its baseline by over 10% as of today, and has gained less than the baseline over the last year. So by your requirement that OOS performance over the last year should be at least 50% of the IS performance, this Port is a major failure and must be either over optimized or the IS performance is mostly due to luck!
However I disagree. Earlier I said; “It is not wise (or fair) to just state that a Port’s OOS underperforms it’s in sample performance. To make a valid comparison we need to look for similar market performance in the in sample data. If the Port underperformed during other periods when the market was flat or down, then it could just as easily be concluded that the OOS performance is similar to the in sample performance.” So let’s look back over the recent IS past to see if we can find similar underperformance;
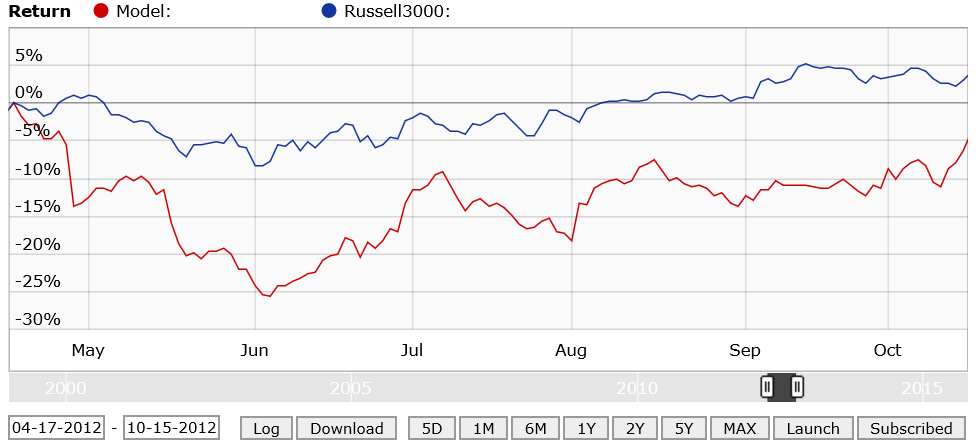
The second chart is the 6 months period between 04/17/2012 to 10/15/2012. The Port was down 17% below the baseline in June 2012.
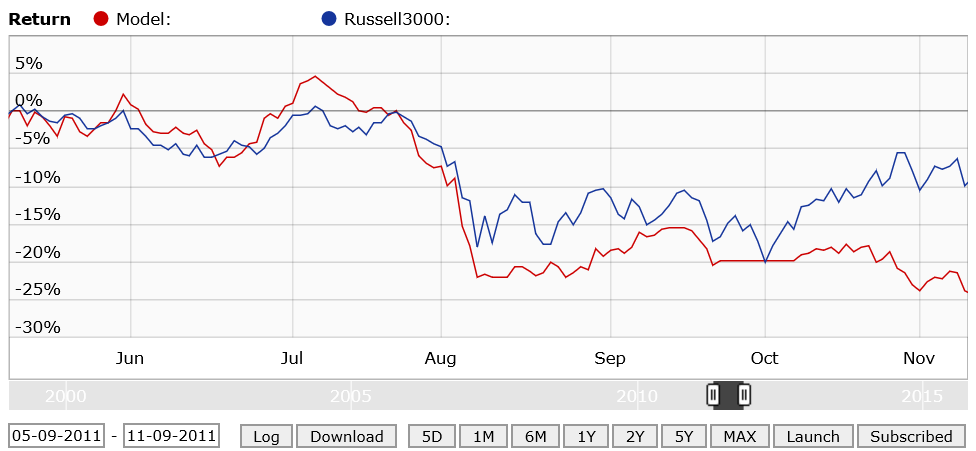
The third chart is the 6 months period between 05/09/2011 to 11/09/2011. The Port was down 14% below the baseline at the end of the period.
The forth chart is the 2 ½ years + since the R2G was launched. So obviously, your contention that to be considered, a Port over the last year of OOS data should have at least 50% of its IS performance doesn’t hold up in this case. A 200% gain OSS is good enough for me!
“To make a valid comparison we need to look for similar market performance in the in sample data. If the Port underperformed during other periods when the market was flat or down, then it could just as easily be concluded that the OOS performance is similar to the in sample performance.”
That’s correct, I will add only that performance should be considered on risk adjusted basis (the graphs have to show cumulative alpha not simple return, that’s critical point. For example, after 2008 crash we see that high volatility stocks recovered much faster than low volatility stocks, but if you look on it in terms of alpha it may be conversely. Buying that stocks is maybe the same as buying with leverage, there is no alpha in it.)
Considering this particular graph it is hard to say anything for sure (because we don’t see alpha again) but it looks like it is very small maybe 5-10 stocks system. The correlation to the market is lost during OOS. For the long only systems with 80%+ time in market (when hedge is off) correlation can’t be less than 0.5. It is inevitably. So it is the first sign of stochastic process. Lucky from launch till 2015 year and unlucky after.
Not all the R2G I have selected have worked as well as I would have like, but the 3 books of 5 R2G I have deployed via TRADE with decent dollars invested are tracking well relative to IS tests. Some strategies have held onto losers far too long and are review for termination as I cannot reconcile how the strategy is working based on the disclosure.
I am reviewing my use of R2G because the pricing on many R2G is simply too high relative to the amount of money the vast majority of users will deploy, outside of very bullish periods where a great deal of the return in beta.
If I put $50k into an R2G then I want to pay $17/month based on targeting 0.40% or less. For a profound R2G with market timing and good private disclosure from the designer, then 1.00% cost is appropriate, which is $42 per month.