What stats do you want for the Model Leaderboard?

There was some confusion as to which Designer Model is the leader in this post: We have a new leader in the designer model competition

The current default for the Composite Score is calculated by combining in equal weights the following stats:

5Y Return - Higher Better
Trading Commitment - Lower Better
Sharpe Ratio - Higher Better
Sortino Ratio - Higher Better
Launch Date - Lower Better

How many and which stats would you like to use as the default? Please explain why as well.

Below are all the stats we calculate. We also have 10Y return (we will add button soon for the Multi Sort). However, if use 10Y for the official leaderboard only the models that have 10Y+ history will be included.

Thanks

I think it would be great if the default composite score were established with a 10-year retrospective, as it will take a long time for the models to actually demonstrate their value. It is too easy to overfit the model or simply delete old models and let the best ones remain. Therefore, older models—specifically those with a 10-year history—would be very good in the default mode.

I also think, as the discussion in the forum thread indicated, that it should be possible to revise the model with respect to the use of the currency. If not, it should at least be possible to a greater extent to isolate the currency gain, especially against major currency pairs. If not, I could quickly add currency performance in the model and then overfit to the extreme. For example, what if a user uses SEK, EUR, or NOK in a USD model? This does not only provide overall better returns, but the "safe haven" effect will also boost the Sharpe.

And if P123 is to expand to Asia as well, these effects will be even greater, making it even more important to address...

1 Like

If these metrics are going to be used, I’d suggest combining them into a single measure using Sharpe Ratio × √(number of years). This is equivalent to a t-score, where:

t-score = mean return ÷ (standard deviation ÷ √n) = Sharpe Ratio × √n

(n = number of years)

This provides a standardized way to evaluate how likely a model is to continue to outperform by incorporating return, volatility, and the length of the track record in a statistically meaningful and standard way. It also allows for more meaningful comparisons between models with different out-of-sample periods. For example, is a better-performing model with only a short track record truly more reliable than one with a lower Sharpe Ratio but a longer history? This approach gives a widely accepted, standard method for answering that question.

Using excess returns (and the standard deviation of those excess returns) would provide an even better basis for comparison of models across different out-of-sample periods.

Additionally, providing a download of each model’s excess returns—similar to what we already have for our own live models—would allow users to construct their own evaluation metrics and statistical tests before subscribing to a model. A Monte Carlo simulation is an example of what someone might want to do on their own.

1 Like

Sortino Higher better, I guess @marco ?

Number of live systems removed in Designer Models it would be and interesting data as well.

1 Like

With regards to stats, I would like to see a simple consistency metric — for example, the proportion of months/years with positive returns.

Also, what about rearranging the panel a bit? The main grouping could be by period (3m, 1y, 2y, 3y, 5y, 10y). Within each group, models could then be sorted, or even multi-sorted, by other metrics such as CAGR, Sharpe, Sortino, etc.

EDIT:

  • categorise models by using AI ranking or not.
2 Likes

I think Pitmaster has a point here. People should be able to choose their own benchmark, of course. Maybe they have a model that is heavily weighted with growth features and want to use a growth benchmark. This can be important information for a sub looking to use the model for investing.

But if it is a competition, which it seems to be for fun, maybe each “player’ should be forced to use their universe for excess returns (in addition to their selected benchmark) for comparison to other models in the competition..

In that case, I would think information ratio (IR) or even IR * sqrt(number of years) would be a fair comparison. Where IR is calculated with excess returns relative to the universe.

For sure that would carry a lot of statistical meaning as well a being a fair/objective comparison, perhaps. It is a common metric in financial analysis.

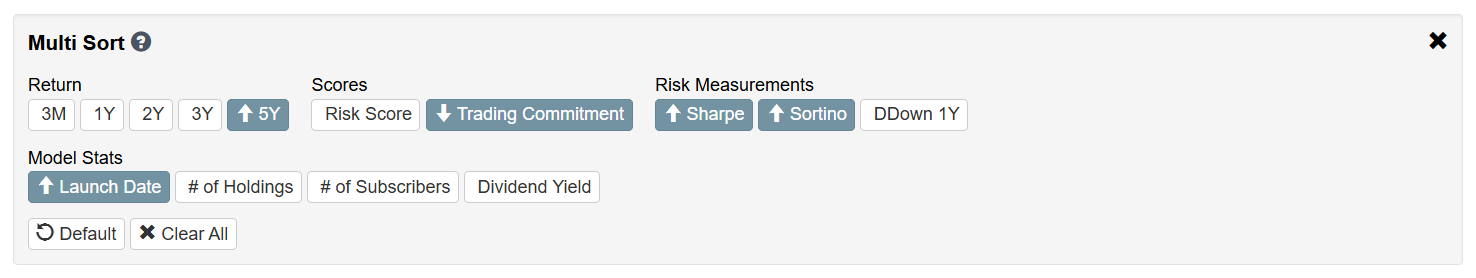
Sharpe and Sortino ratios are still useful, but they can be misleading if the benchmark itself had a higher Sharpe ratio during the period—like now, when the S&P 500 has surged. The IR helps distinguish between doing well and outperforming your universe, which is a key distinction for subscribers and competition scoring alike.

For the record, I don’t currently publish any models or subscribe to any. This is just a suggestion. But I can say that if a model approached a t-score of 3.0 with this metric, I’d probably start watching it daily—just like Pitmaster—not just for competition purposes, but potentially as a candidate to sub.

A bit in the weeds, but the biggest issue in model selection is the multiple comparisons problem. If you test enough models or factors, some will appear to perform well purely by chance and most of those will regress to the mean out of sample.

One way to address this is by controlling the False Discovery Rate (FDR)—that is, limiting the proportion of models you select (or even consider) that are likely false positives.

And while this is a simplification, using a t-score threshold of ~3.0 or higher (which corresponds to a p-value < 0.003) is a statistically conservative rule of thumb. For a moderate number of comparisons (say, 100 factors models), this is typically enough to keep your FDR under 5% in practice.

That may be a reasonable simplification for our context, given that there are roughly 100 Designer Models with meaningful out-of-sample performance to evaluate. It puts the t-score > 3.0 threshold on firm statistical ground, without being overly strict or impractical.

This is just a back of the envelop calculation of the FDR with t-score > 3.0. People would be free to use their own calculations or thresholds, of course.

1 Like

I think you’ve identified the primary stats, but why would a lower Sortino ratio be better?

2 Likes

Some risk ideas:

  1. Downside Volatility (Volatility of negative returns).
  2. Max overall historical drawdown- to help assess potential downside volatility. Max monthly or quarterly negative return could be insightful too.
  3. Average bid/ask spread of stocks in simulation. The lower the better. Generally a model that performs the same but with higher liquidity should be more desirable

Remove Sharpe:

Flawed metric as upside volatility is not necessarily a risk.

If you want a substitute then downside deviation relative to the universe or benchmark can be chosen.

How is the risk score calculated?

“Risk Scores range from 1 to 5, with 1 being the least risky. The model's Risk Score reflects the combined impact of three criteria:

  • three month volatility (lower is better)

  • three month maximum drawdown (lower is better)

  • number of positions (higher is better)

The scoring of each criteria and the overall score is done on a relative basis: the values are sorted then assigned a percentile depending on the order (not the magnitude).

(i) Since scoring is done on a relative basis, using only three months for statistics like volatility was enough to correctly classify models.”

Thoughts:

Is it just three months of performance for the stats or is it over a longer period with 3-month samples? If it is just three months total then:

  • three month volatility (lower is better) (should be at least a year or more and use downside volatility. Ideally it could be over the entire live period, but it should be more than 3 months)

  • three month maximum drawdown (lower is better) (Should be over a longer timespan too)

  • number of positions (higher is better) agreed, but perhaps should only penalize under a specific number of stocks say 50 or 100 without extreme reward for say a 500 stock model. In other words, cap the score if a model has a high enough number.

1 Like

Yes typo in the post. It's fixed. Thanks

2 Likes