Recent drawdown 6%
Overall YTD 22%
Number of holdings 9
% of cash invested: 90%
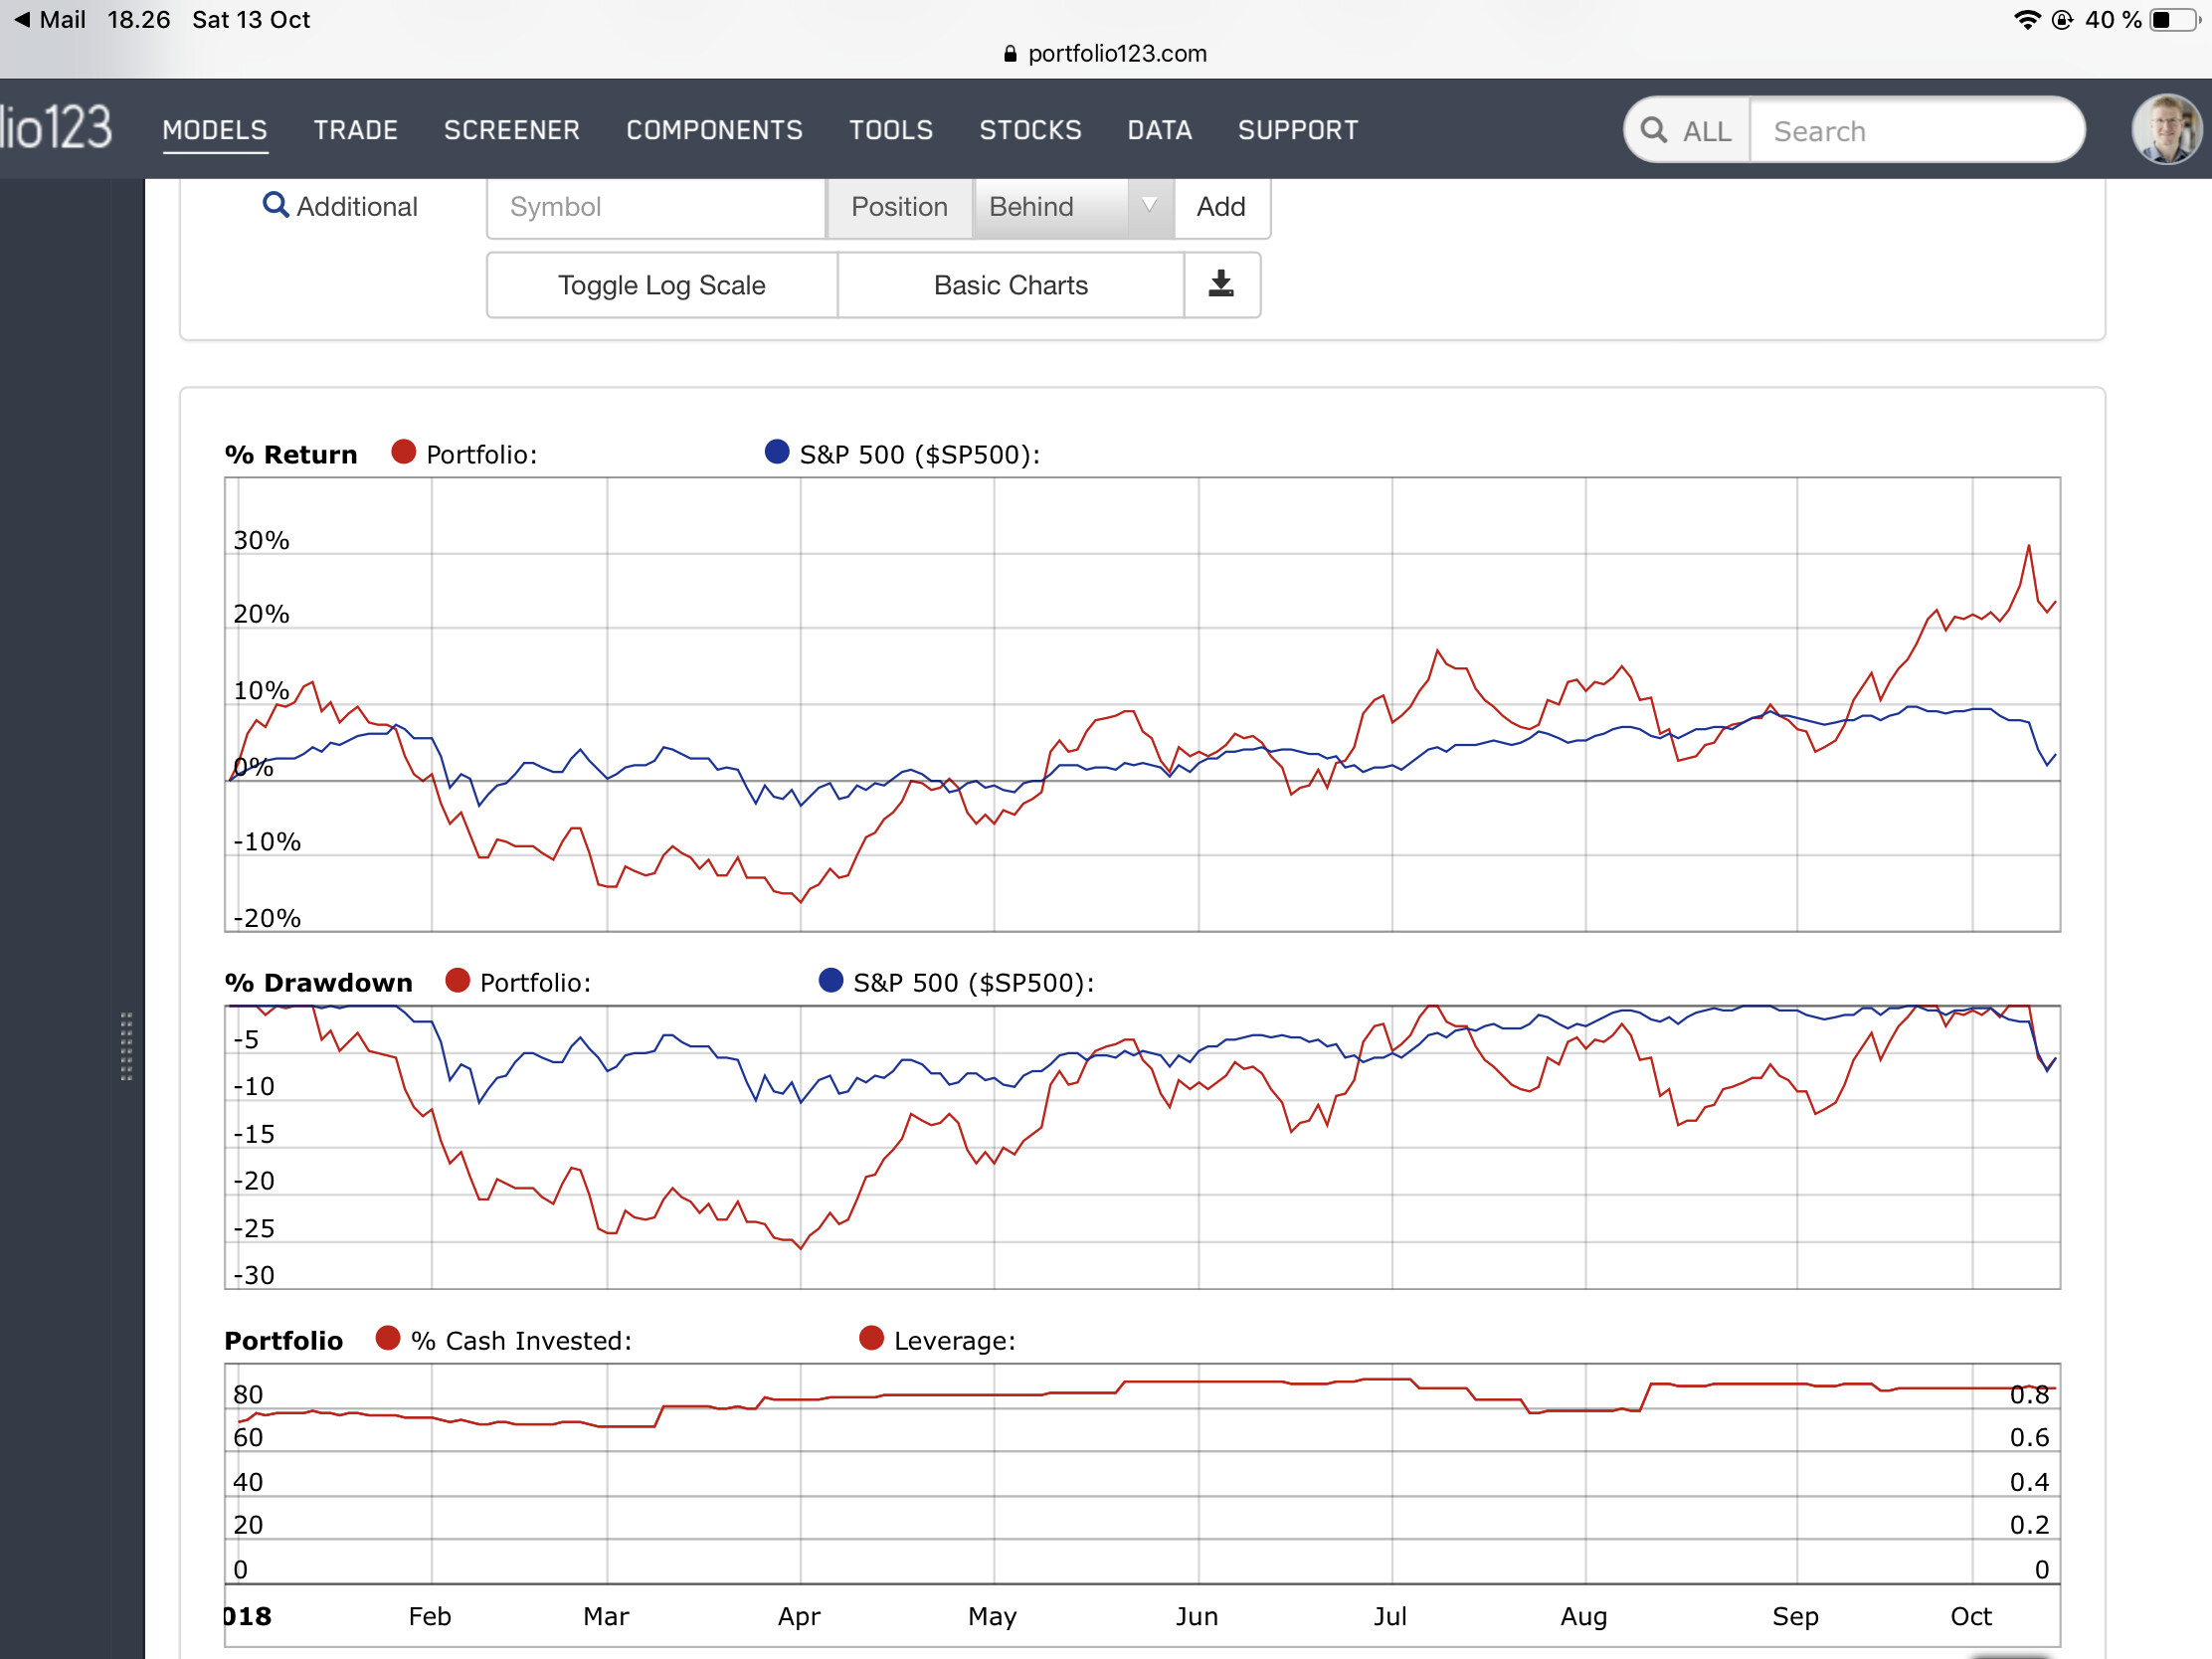
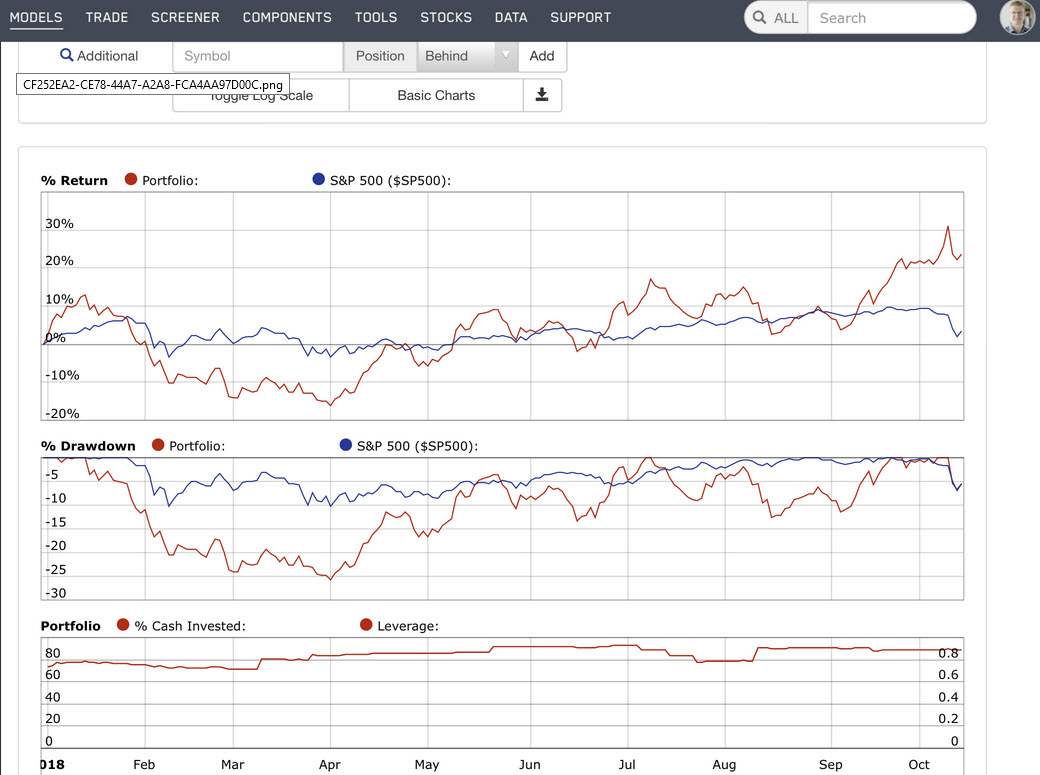
Up 17.57% ytd. Drawdown is -6.34%.
Probably just a run of the mill selloff.
But I personally haven’t forgotten the 2007/08 financial crisis. Particularly, I remember how its solution wasn’t to address the major problems that result in asset bubbles, but rather to inflate them away at the expense of ordinary taxpayers. I reckon that one day there will be payback for the loosey-goosey fiscal and monetary policies which fueled the last ten years worth of asset price appreciation. I think it’s easy to forget that low interest rates portend low future economic growth and that quantitative easing is basically borrowing from future growth.
And in the next credit crunch (due any time now), what is the federal government’s big move? Defer to the federal reserve. What is the fed’s big move? Lower interest rates by 3%. But, wait a second… How can you lower interest rates by 3% if they’re already less than that?
There are no free lunches.
Again, this recent selloff probably isn’t that event.
My max drawdown was -9%, back up to -8.13% as of last close. YTD up 22%. Microcaps have been hit especially hard: IWC is down 11.7% since end of August.
We aren’t out of the woods yet.
The selling started in earnest when Powell signaled that he was probably going to go past neutral (3.0%).
One reason why is that there is record corporate debt on the books, and at interest rates exceeding 3% the increased debt service consumes all free cash flow growth.
For the first time in years, the 10-year yields more than the average S&P dividend. Rising bond yields serve to reduce the appetite for equity risk. Not to mention negatively affect company valuations based on discounted cash flow.
To compound matters, large/mid cap median Q1 sales surprises peaked at over 1.5% and have begun to decelerate. Peak median sales surprise percentages above 1.5% often lead to deceleration and market sell offs as expectations for future surprises are grim at that lofty level.
Fun fact - three of the last 5 Fed Reserve chairs brought stock market crashes/extreme bear markets with them into office.
The aggressive posturing with regards to interest rates implies higher fiscal deficits into the future, something the U.S. can’t afford with the government already generating annual $1T+ deficits.
Parker,
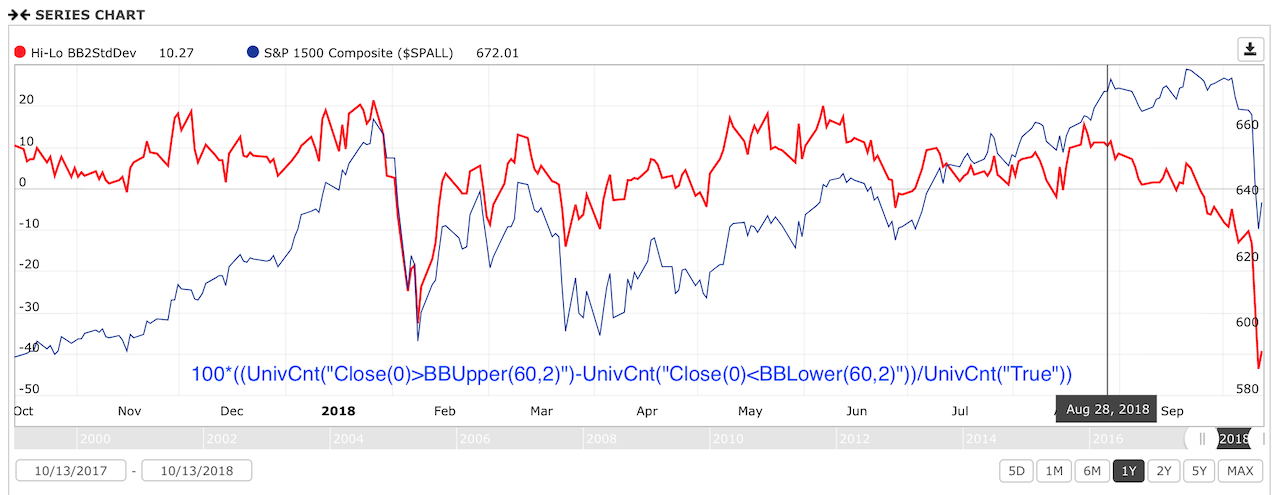
Did Powell signal higher rates in late August? My Hi-Lo indicator started to go negative about around then - chart attached.
I’ve also been reading about high corporate debt recently, but my custom series for aggregate debt/sales and debt/income don’t show anything alarming - at least from a historical point of view. But I do agree that between increasing interest rates and the ongoing US/China trade dispute, income growth may be hard to find. Add Georg’s seasonality w/ the mid-term election cycle kicker and, to me, the investing environment looks riskier.
Walter
Cool results, Thank you!!!
Got lucky with a stock that was taken over (+136%), so the DD ist still tamed: 5,5%
About 6% YTD Performance (with Dollar Effects 11%).
Regards
Andreas
I know it looks bloody out there, but I simply do not have a sell Signal, the rule: SP500 below 200MA (which is the case) and earnings trending down in real Terms (n. only slowing growth, which is the case). Up 7% YTD (in Euro Terms), DD -8.3%. also no lower low on capital curve
How are you doing?
much much worse
the Thing is my much worse could well be on the way…
But hey, I doubted the be Long in the beginning of 2016 and followed the System and it played out well, so I just follow it, no matter what my discreationary impules tell me…
My primary goal is to beat RSP, and YTD I am a bit over 3% ahead and slightly positive (RSP down about 2.4% currently). I’m okay with that since it is without hedging or timing. I have 4 varied timing models that I watch but currently don’t act on, and they all use economic, profit, yield, and interest rates (no price momentum), and one of those has been out of the market for a few weeks. It is the simplest and if the market continues down I may regret not following it. But for now this looks to me like a “fear of what might happen” market drop rather than a reaction to poor conditions.
“…so I just follow it (model), no matter what my discreationary impules tell me…”
Wise move.
After all, why do we have models, if we don’t follow them? It is easy to follow a model if things are shining golden. Easy to watch a 10%-20% drawdown in a model. Difficult to go through that kind of drawdown one if real money is on the line.
I am up for the year about 3%, drawdown 8%.
Hi-lo indicator (Thanks Georg) gave a nice and timely sell signal in October.
I didn’t follow it, because of other timers that did not signal a sell.
The market is now totally dependent on politics (Trump/Russia/China) and political stockmarket turmoil is usually short lived. But of course: Under Trump’s erratic and irresponsible behavior anything crazy can happen, including a full blown crash/bear market a la 2008.
On the other hand: Interest rates will soon come DOWN imho, probably Q2 next year. That may give a boost to stock prices.
Anyway, I will follow my models and stay put for the time being.
Werner
Drawdown: -10.8%. YTD: +18.4%. Even though I almost exclusively invest in microcaps, I’m doing a lot better than IWC, the microcap ETF, which is down 18.8% since the end of August, and down 6.8% YTD.
hi judgetrade,
Thanks for sharing your performance. I checked your Designer model performance. Recent 3 months performances are around -10 to -30. Just curious why your real performance DD -8 is much better than your designer’s model. Maybe the entry price in designer’s model is worse?
BTW, my DD is around -15%.
Gs3
DD -11%, Up YTD ~12%.
Was heavily exposed to energy, but not any longer.
Hi, I am not trading my designer modells, I trade a 50-100 stock nano cap value Momentum System, which I can not publish as a designer model because of low liquidity.
Regards
Andreas