This might be a little out of scope, but I thought others here could be interested in diversifying their equity portfolios:
Mebane Faber builds a portfolio composed of 5 different asset classes (REIT, bonds, US stocks, commodities, emerging markets) and sells (buy) each asset class when the index crosses below (above) its 10 months SMA. The result is a portfolio that never incurs a negative year since 1972 with a CAGR of 11.92% and a Sharpe of 1.2: http://papers.ssrn.com/sol3/papers.cfm?abstract_id=962461.
I would like to backtest the strategy, including some variations I have in mind but I don’t have access to Global Financial Data. I subscribed to Reuters Datalink but their data is only available from 2000. CSI could be an option but they don’t have the specific indexes used by Faber. It’s around $400 for 20 years of data subscribing to their budget bundle offer. Are there any other options? Ideally I would like to use the same indexes used by Faber:
Standard and Poor’s 500 Index (S&P 500)
Morgan Stanley Capital International Developed Markets Index (MSCI EAFE)
Goldman Sachs Commodity Index (GSCI)
National Association of Real Estate Investment Trusts Index (NAREIT)
Hi,
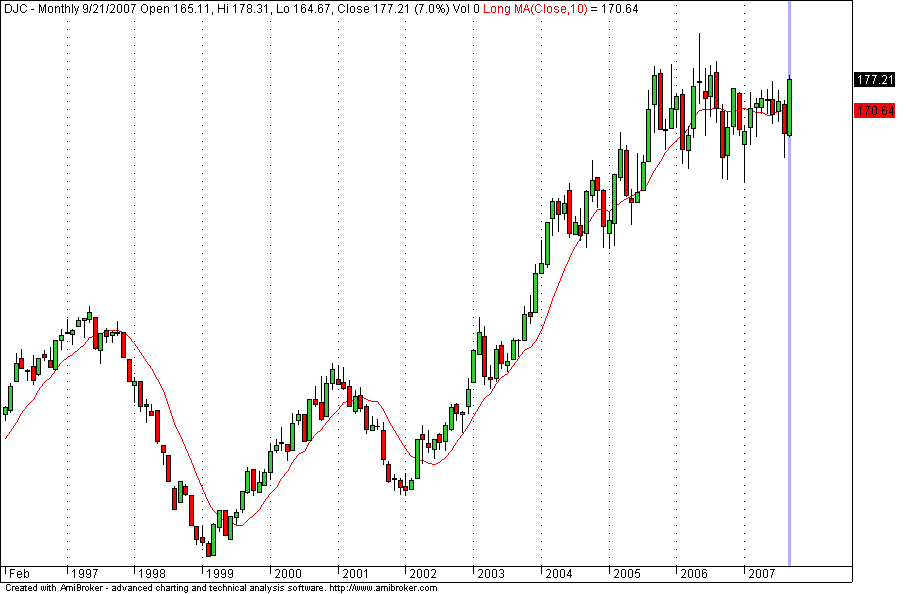
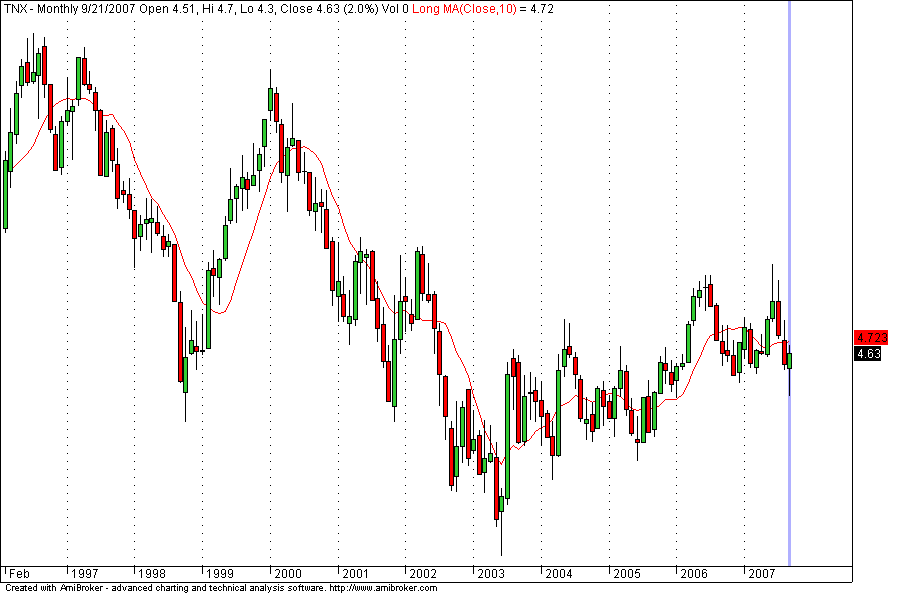
Yahoo Finance has data for a number of indices going back decades. I don’t see exactly what you are looking for but they have the 10-yr treasury interest rate ^TNX and the DJ AIG Commodity index ^DJC. I didn’t see historical data for EAFE but they have a number of indices under World Markets. Perhaps you can find something useful.
You can get the data from GFD on a per series basis for relatively modest amounts. Or, you can travel to your local graduate business school and get it for free.
I’m still short of MSCI EAFE or another equivalent index with at least 15 years of historical data. I’m considering purchasing CSI data but strangely the EAFE is not included in their database.
Monthly data for the MSCI EAFE is available back to 1969. Just click on the index you would like to download. First time users are required to register which is free.
If I remember correctly the Barna data is especially useful because one can get foreign indexes in local currency or in USD. If you are planning to do sector rotation you probably want to use foreign indexes in USD values (which I assume takes into account exchange variations).
Helmuth,
Thank you! I don’t know how I missed that page on the Barra site.
Meb,
The last 4 years resulted in a lot of whipsawing in commodities and 10 years bonds. It makes the strategy look a bit impractical compared to the previous years. Did you use any filtering to reduce the number of signals?
I used Dow Jones AIG Commodities index in place of GSCI and TNX for govy notes.
I don’t use the timing model on bonds unless they are levered up ie risk parity. It just doesn’t make that much of a difference. Substituting more volatile bonds like high yield or emerging works better…
Whipshaws are a part of trendfollowing systems. There are measures to reduce whipshaws (such as a % filter around the moving average ie has to fall 1% below the MA to sell, then rise above the MA to buy) that can be effective.
I prefer to just use a longer term moving average instead of a % filter on the moving average to reduce whipsaws. It is a little cleaner approach and a lot easier to back test. The tradeoff for reducing whipsaws is almost always reduced total return. So try a few different moving average lengths and pick the best compromise. Whipsaws come with the territory.