Adjusting a ranking system for European (semiannually reporting) companies

Greetings all,

Let’s say you have a ranking system that you previously ran on US based universes. You now want to test the same ranking system on Europe based universes. I understand that this is not as straightforward as one would hope it is, as a lot of European stocks report semiannually instead of quarterly.

I understood from this post (European data now available on beta site - #47 by yuvaltaylor) that in the case of adjusting the lookback period, one way of approaching things is to double the amount of iterations for companies that report semiannually. This means that the standard ‘US factor’

loopsum("epsexclxor(ctr,qtr) > epsexclxor(ctr+4,qtr)",12,0)

becomes:

eval(interimmonths(0)=3,1,2)*loopsum("epsexclxor(ctr,qtr) > epsexclxor(ctr+4,qtr)",12,0)

to generalize to European (semiannual) stocks. Also, to compare semiannual statements with quarterlies, one way of approaching things is to adjust the standard factors of the form

opincq/asttotq

to:

eval(interimmonths(0)=3,1,0.5)*opincq/asttotq

Similarly, as discribed in this post (Extreme number of nodes (300)– does it damage the ranking system? - #5 by yuvaltaylor) you want to prevent using PQ and, in general, (ctr+1,qtr) in European ranking systems and instead use PYQ, TTM and (ctr+4,qtr) figures with the above mentioned adjustment. I believe this means that - for example - a standard stability factor of the form

loopsum("abs(EPSexclxor(ctr,qtr)-EPSexclxor(ctr+1,qtr))",12,0)/loopsum("EPSexclxor(ctr,qtr)",12,0)

would be adjusted to:

eval(interimmonths(0)=3,1,0.5)*loopsum("abs(EPSexclxor(ctr,qtr)-EPSexclxor(ctr+4,qtr))",12,0)/loopsum("EPSexclxor(ctr,qtr)",12,0)

I was wondering if others had encountered difficulties when looking for companies outside of the US. Are there other adjustments to take into account to adjust a ranking system for semiannually reporting companies?

Best,

Victor
2 Likes

Victor is correct. To summarize:

  1. Test every stock with InterimMonths(3). If it’s true, it’s a quarterly, if not it’s a semiannual.

  2. If a stock is semiannual, quarterly values for non-balance-sheet items should be divided by two to compare to other stocks. For example, a ranking mode that looks at quarterly free cash flow to assets might read Eval(InterimMonths(0)=3,1,0.5)*FCFQ/AstTotQ.

  3. If a stock is semiannual and you’re using LoopSum with a true/false statement and Ctr,Qtr, multiply the result by 2 to compare to other stocks. For example, a ranking node that measures consistency of growth might read Eval(InterimMonths(0)=3,1,2)*LoopSum(“EPSExclXor(Ctr,Qtr) > EPSExclXor(Ctr+4,Qtr)”,12,0).

  4. For semiannual companies, odd-numbered quarterly offsets will be NA, so avoid them whenever possible. This includes all the PQ factors.

The one thing that this does not address is semiannual vs quarterly estimates. There are a number of companies that report only semiannually but have quarterly estimates and actuals, especially for sales and EPS. For taking this into account, there’s a factor called ConsMonths. It returns either 3 or 6 depending on whether a company’s estimates are quarterly (3) or semiannual (6). My advice for users who rely on quarterly estimates is similar to my advice for users who rely on quarterly line items: use an Eval statement to divide all quarterly estimates and actuals by 2 if ConsMonths = 6.

6 Likes

Do you include semiannual stocks (InterimMonths(0)=6) in your systems, and has it improved your performance?

I adjusted my custom formulas for semiannual reporting, but that doesn't solve the issue with pre-computed factors like BeneishMScore or SUEY1. Furthermore, my best guess is that these companies often report partial earnings quarterly anyway, meaning there will still be a practical lag/delay in analyzing/backtesting.

I do indeed include semiannuals. I do not know what my performance would have looked like without them.

I think there is still risk in mixing quarterly and semiannual reporters that the adjustments don't address

I was thinking about thiis exanple: On 1 December, quarterly reporters are ranked on September data (most of them) , while semiannuals are ranked on June data . If anything negative happens in June-Sept, quarterly reporters reflect it immediately while semiannuals still show pre-shock figures (except for sentiment data, etc) — ranking artificially high as a result.

I try to figure out if separate ranking system for semiannuals would be a better alternative. Or some sort of penalty for semiannual reporters

I’ve been looking at this in a very similar way—trying to understand how the differences between quarterly and semiannual reporting affect overall performance and rankings in Europe. Your point about the timing gap is very valid, especially when market conditions change quickly and quarterly reporters reflect negative developments much sooner than semiannual ones.

I am also analyzing these nuances carefully to see how much this reporting frequency impacts comparative performance and ranking accuracy. This kind of insight is very important, and I will definitely take all of this data and expertise into account as I continue improving my approach for the future U.S. data market modifications in that aspect.

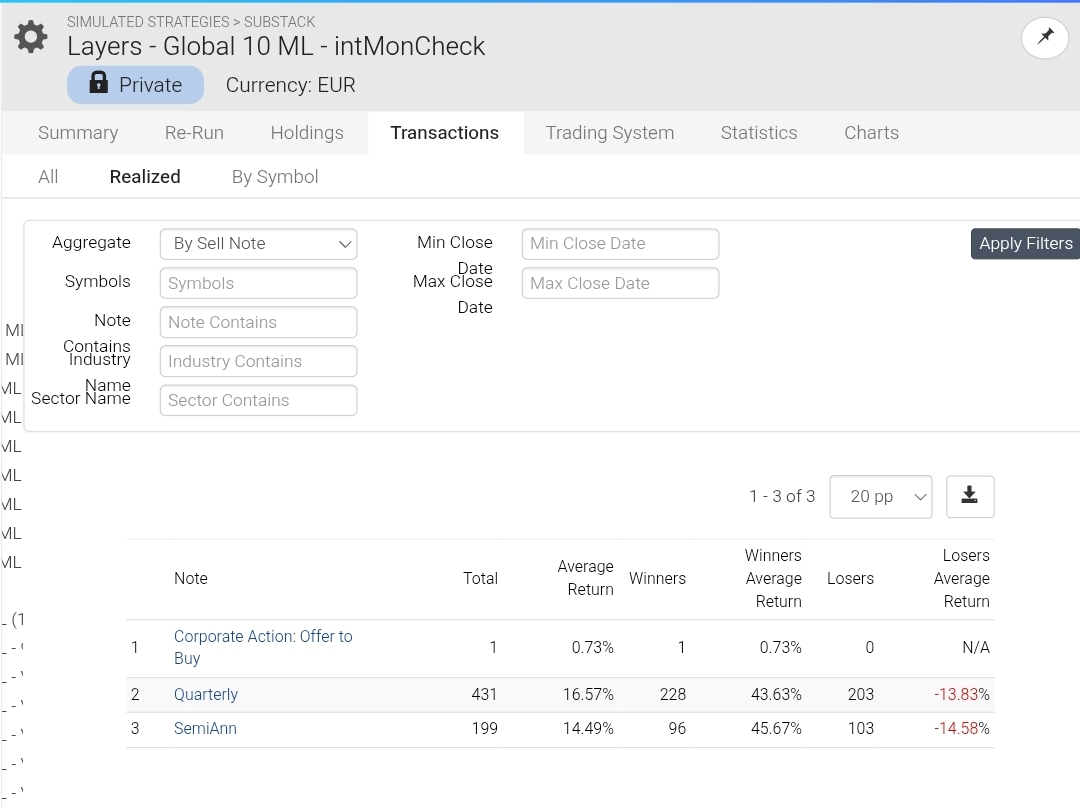
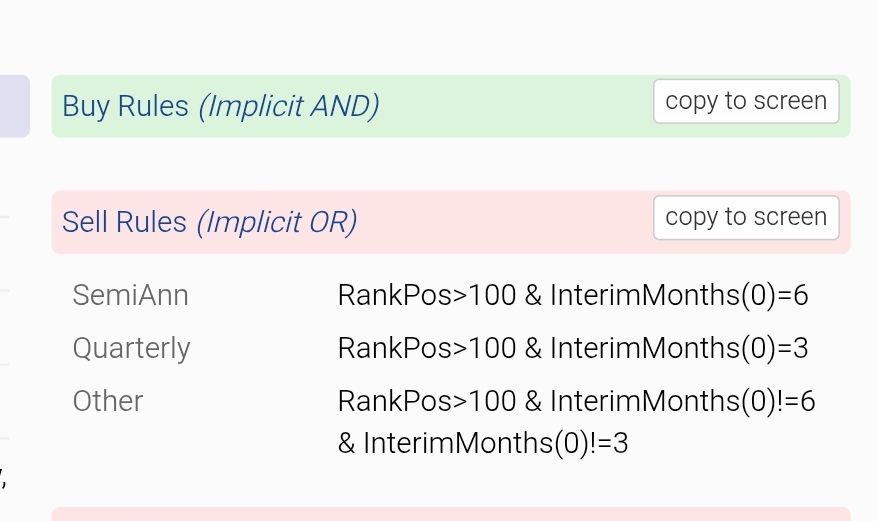
You can check it in Simulations by

  1. splitting your sell rules (if simple enough) into conditional subrules covering all cases you want to analyze + rest
  2. Go to Transactions → Realized → Aggregate by Sell Note

In my case InterimMonths didn't matter. You can of course also check a re-run excluding stocks from either camp, but this could lead to false conclusions by introducing noise, timing luck etc.

2 Likes