AIFactorValidation() is free; except for the training cost of course.
Allowing AIFactor() except for most recent year is interesting... if the use-cases and demand justify the R&D to make it work efficiently since you can do most everything with AIFactorValidation(). Just few things are not going to work with AIFactorValidation(), like "Force Positions into Universe". The technical reasons why it's limited to 1Y (we are going to allow 5Y soon) are a bit challenging. In short, it was timing out and very slow in backtests.
Also AIFactor() will not allow you to predict using training data, so more R&D needed to make it work for a 20 year backtest.
Ah, that's great to know, and wasn't immediately clear to me from the AI Factor Dashboard page, but it makes the ML features much more compelling as I was only planning on using AIFactorValidation().
On the topic of monetization, would still love to see p123 eventually expand into selling alternative dataset add-ons (e.g. news or sentiment data, etc.) that some of its competitors like QuantConnect and QuantRocket already do. This dovetails nicely with the new ML functionality, which makes it a lot easier for users to assess and integrate new features from these datasets.
But please, feel free to completely ignore my above paragraph until we have linked trading rolled out for Canada/EU
I wanted to follow up on this, as I’m still unsure about the profit potential given the limited time we had during the beta launch—about two weeks to validate anything using the screener. Additionally, we still don’t have an easy way to test in a simulation environment.
At the moment, I'm exploring how to short stocks and understand the associated costs. A lot of the edge seems to be in illiquid securities or stocks, where I’m unsure if they can even be borrowed at a reasonable expense. I've noticed that even when using Prussell 3000 stocks, most of the shorting edge is in stocks under $5. Now, I need to develop a way to determine whether these are shortable and, if so, whether it's at a reasonable cost. It seems I have more questions than answers, and now, potentially more cost without answers.
Before committing to more research, I need to assess the expenses involved. Is there a way to review what our costs would have been without the beta or the free compute charges? This would give me a better understanding of what it might take to continue digging deeper.
I still think we need a risk model, fyi, perhaps even more with the AI factor feature. Who knows what's going on under the hood.
Overall, I think it was a great job so many kudos on the hard work and launch! Thank you for keeping the predictions page free as for my level as that enables me to check out the borrow costs.
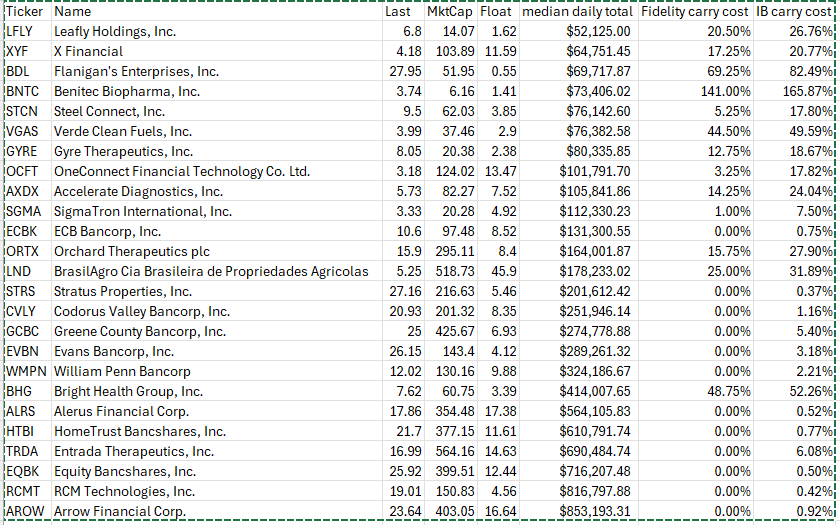
Borrowing costs vary hugely from broker to broker. You can borrow most stocks free from Fidelity while IB charges fees for every single stock. It would be very unusual for me to find a stock that was more expensive to borrow from Fidelity than from IB. Below are the results of a study I did about a year ago.
Hi @yuvaltaylor, thank you so much for this! It's incredibly helpful. Which tool did you use at IB to gather this information? Based on your list, it seems we're exploring similar territory—market caps under $100 million and stocks with single-digit prices. Not a place I'd like to tread for many reasons!
For some of these, the borrowing costs completely wipe out any potential edge, especially with double-digit costs.
Do you happen to know if those borrowing costs take into account the cash rate earned after selling these stocks?
Are you using Trader Workstation? If so, type in a ticker and click on it so that the window populates. Underneath you'll see a little green dot and the word "Shortable." Hover over the little green dot and you'll see the fee. There's also a link there to the SLP tool which will provide you the fees over the last few days. The fee for DJT is 22.56%, FWIW. The borrowing costs are annual, so if you only plan to hold a position for a week or two, it may not be so bad. The borrowing costs do not take into account any cash earned after selling. If you can transfer some money to Fidelity, you'll be able to short stocks more cheaply there.
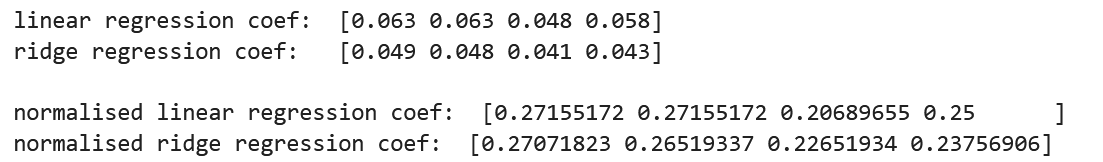
Generally speaking shrinkage reduces the magnitude of coefficients / weights, spreading the effect more evenly across features preventing any single feature from having too much influence on the predictions.
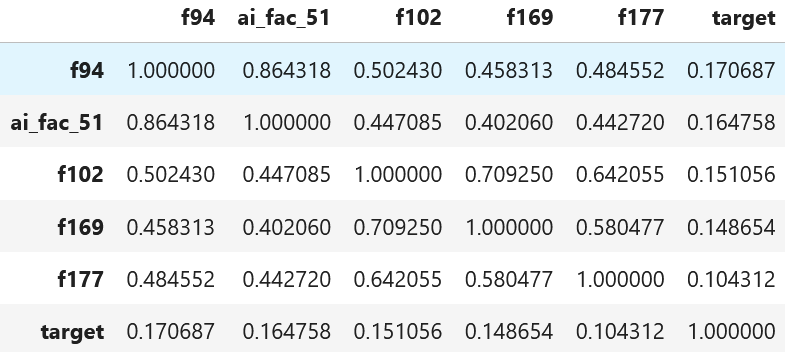
Here is a real example using p123 data, with first four features (based on the correlation table below). I used alpha for Ridge =10,000. Features: [f94, ai_fac_51, f102, f169], Rank (0,1) is used for normalisation of features and target.
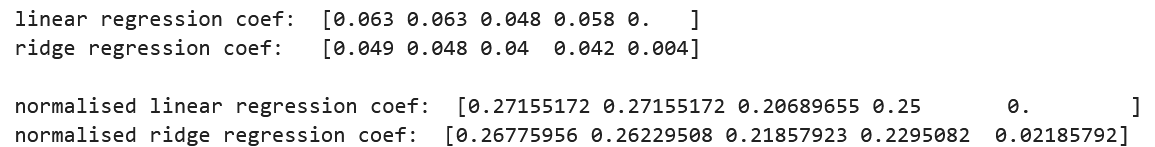
Below is shown effect adding f177 and when positive coefficients are enforced (positive=True). For linear regression last coef would be negative (when positive=False), even if correlation with target is positive (0.1043). Ridge shrank coefs of other features and add some positive coeff for f177.
I posted earlier that research has shown that averaging the results of the LASSO model with the ones from historical models and then averaging them with the combination of the simple one-factor model is much better than the simple LASSO model. That said, even simple linear models suffer from a lack of shrinkage.
Since short sides are so much more predictable than long sides, hedge funds would have gotten super rich by shorting long ago if not for borrowing cost constraints. However, it is actually much harder to short than to long.
For us it is probably most useful for reducing the weight of correlated features (also called collinearity or multicollinearity).
As an example, suppose you wanted to do a regression and had just one growth feature like say EPS Acceleration. But your regression also had 4 quality features that were correlated like say: ROI%TTM, ROI%5YAvg, ROE%TTM, ROE%5YAvg.
The regression would not be balanced. It would be placing too much weight on quality and not enough weight on growth. You could address this with these linear methods:
Ridge regression would shrink the quality factors more than the growth factors to achieve a better balance. A type of L2 regularization if one wants to get wonky.
LASSO regression might remove one or more quality factors. L1 regularization
Elastic-net regression might remove a quality factor and shrink the other quality factors. L1 and L2 regularization.
The result of each of these shrinkage methods is a better balance of features. A random forest does some of this automatically with its algorithm. The optimization methods many of us use with P123 classic will do this also, in my experience.
You can also add L1 and L2 regularization with non-linear models such as LightGBM. For LightGBM the hyperparameters are called "lambda_l1" and "lambda_l2".. The Sklearn Extra Trees Regressor uses ccp_alpha with a default of 0.0. This is a method of shrinkage (not L1 or L2 regularization). Neural-nets use "weight decay" which is a type of L2 regularization.
Shrinkage is useful for addressing collinearity. To be complete, I should probably note that shrinkage also helps prevent overfitting even when the features are not correlated. Shrinkage reduces variance at the cost of introducing some bias.
try Quantconnect, they have a free point in time US short availability dataset going back to 2018. You can link the P123 stocks via FIGI. I would focus on the Russell 2000, the "interesting" Russell 3000 constituents are impossible to borrow.
A risk model is essentially VaR (expressed in std in the case for Barra) and Beta vs common systematic risk factors (factor loadings). The later could be calculated with regressions in the P123 AI framework.
For anyone who is interested here a slightly outdated version of Barra (Descriptors from Page 93 onwards).
In Trader Workstation, in the "Classic TWS" tab, you can add a column named "Fee Rate" under "Short Selling". The value specified doesn't take into account the interest you earn by shorting a stock.
For instance, LFLY can be currently shorted for 32.17% But the real cost would be only 26.84% (called rebate rate) since you will also earn interest just by shorting this stock.
You can also download a daily list of all stocks with the fee rate and rebate rate by following instructions here: ibkrguides.com/kb/article-2024.htm
What is that status of getting 5Y backtest with AIFactor()? I'm not very comfortable of taking my AI startegies live before I have managed to properly backtest them in a Simulation.
Hi all,
I've become more curious about the AI Factor tools after reading many of the community posts, and regret a little that I didn't think to opt in during the beta period! Is there a set of estimates somewhere that shows roughly the cost of performing certain actions? Maybe a matrix showing a handful of common configurations, ie. period length, # features, universe size, model, time to run
Of course that's probably never going to be exactly the same but it would be interesting to have an idea in advance.
Separately, are the Target Information Regression scores specific to the exact configuration you run each time? From watching the launch video, what do the different Sample % settings do?
For cost estimates the average validation is around 2 minutes. But there are outliers that run for 10 hours! Depends what people are doing with hyperparameters too; they can easily exponentially increase the compute time. So best thing to do is to start small with predefined models only.
We will be adding some P123 predefined AI factors soon to give users a starting point.
The "Sample %" for the Target Info Regression is a way to reduce the rows used to calculate it since it could be very time consuming. So for example if your dataset is large, using only 20% of the dataset (picked randomly) should give you the same results. Note that we have also have Feature Importance in the Predictor pages which might produce more meaningful results for doing "Feature Engineering".
Sorry it's all so vague. We're still developing missing pieces and there's not much for new AI users. We're finishing grid search, categorical, macros, and few other things. We'll shift focus soon to help people use it. And we'll likely offer more credit $s which, btw, never expire.
I'm wondering on what the update is here on all these projects. Can you provide something?
I recently signed up for another year at p123 but am realizing that even with AI, there's not much alpha to be had outside of micro-caps and small amounts of money, especially outside of taxes. This may be my last year after over a decade here.
Almost all my AI research ends up with the alpha being on the short side in sub $1bn market caps - and that excludes borrow costs. The traditional liner methods continue to be fine (the old system) and exhibit similar behavior to others (good years, great years, bad drawdowns, - long periods of factor under performance).
Perhaps we need alternative data sources? Does anyone have ideas they are willing to share?
I attempted to upload risk factor from portfolio visualizer. It wasn't a trivial exercise - and required code for daily updates. It's alot work for a half baked research process.
I think the p123 engine is great but we're missing a few key components (risk factors, covariance matrix, etc.) that I've expressed in the past. I noticed my previous posts requesting evidence had very limited responses.