The Risk Model project kicked off two weeks ago, and is led by a great team. We enlisted the help of a professor to oversee it, a practitioner from a hedge fund, and a data scientist. None of us inside P123 has actually used one in practice, so the new talent will help us focus our efforts for an MVP.
Phase I will create the factors and quantify the risk. Phase II will mitigate risk with overlays. And so on; six phases have been defined so far. More info coming when we are readying to launch something, hopefully by end of the year.
There's also a big release for AI this week: categorical, macro, grids, and a great new way to specify features (longitudinal instead of cross sectional). We'll then take a break from AI and focus on risk model.
Yes On my MacBook Pro. Unique method with my code (Python). My ideas.
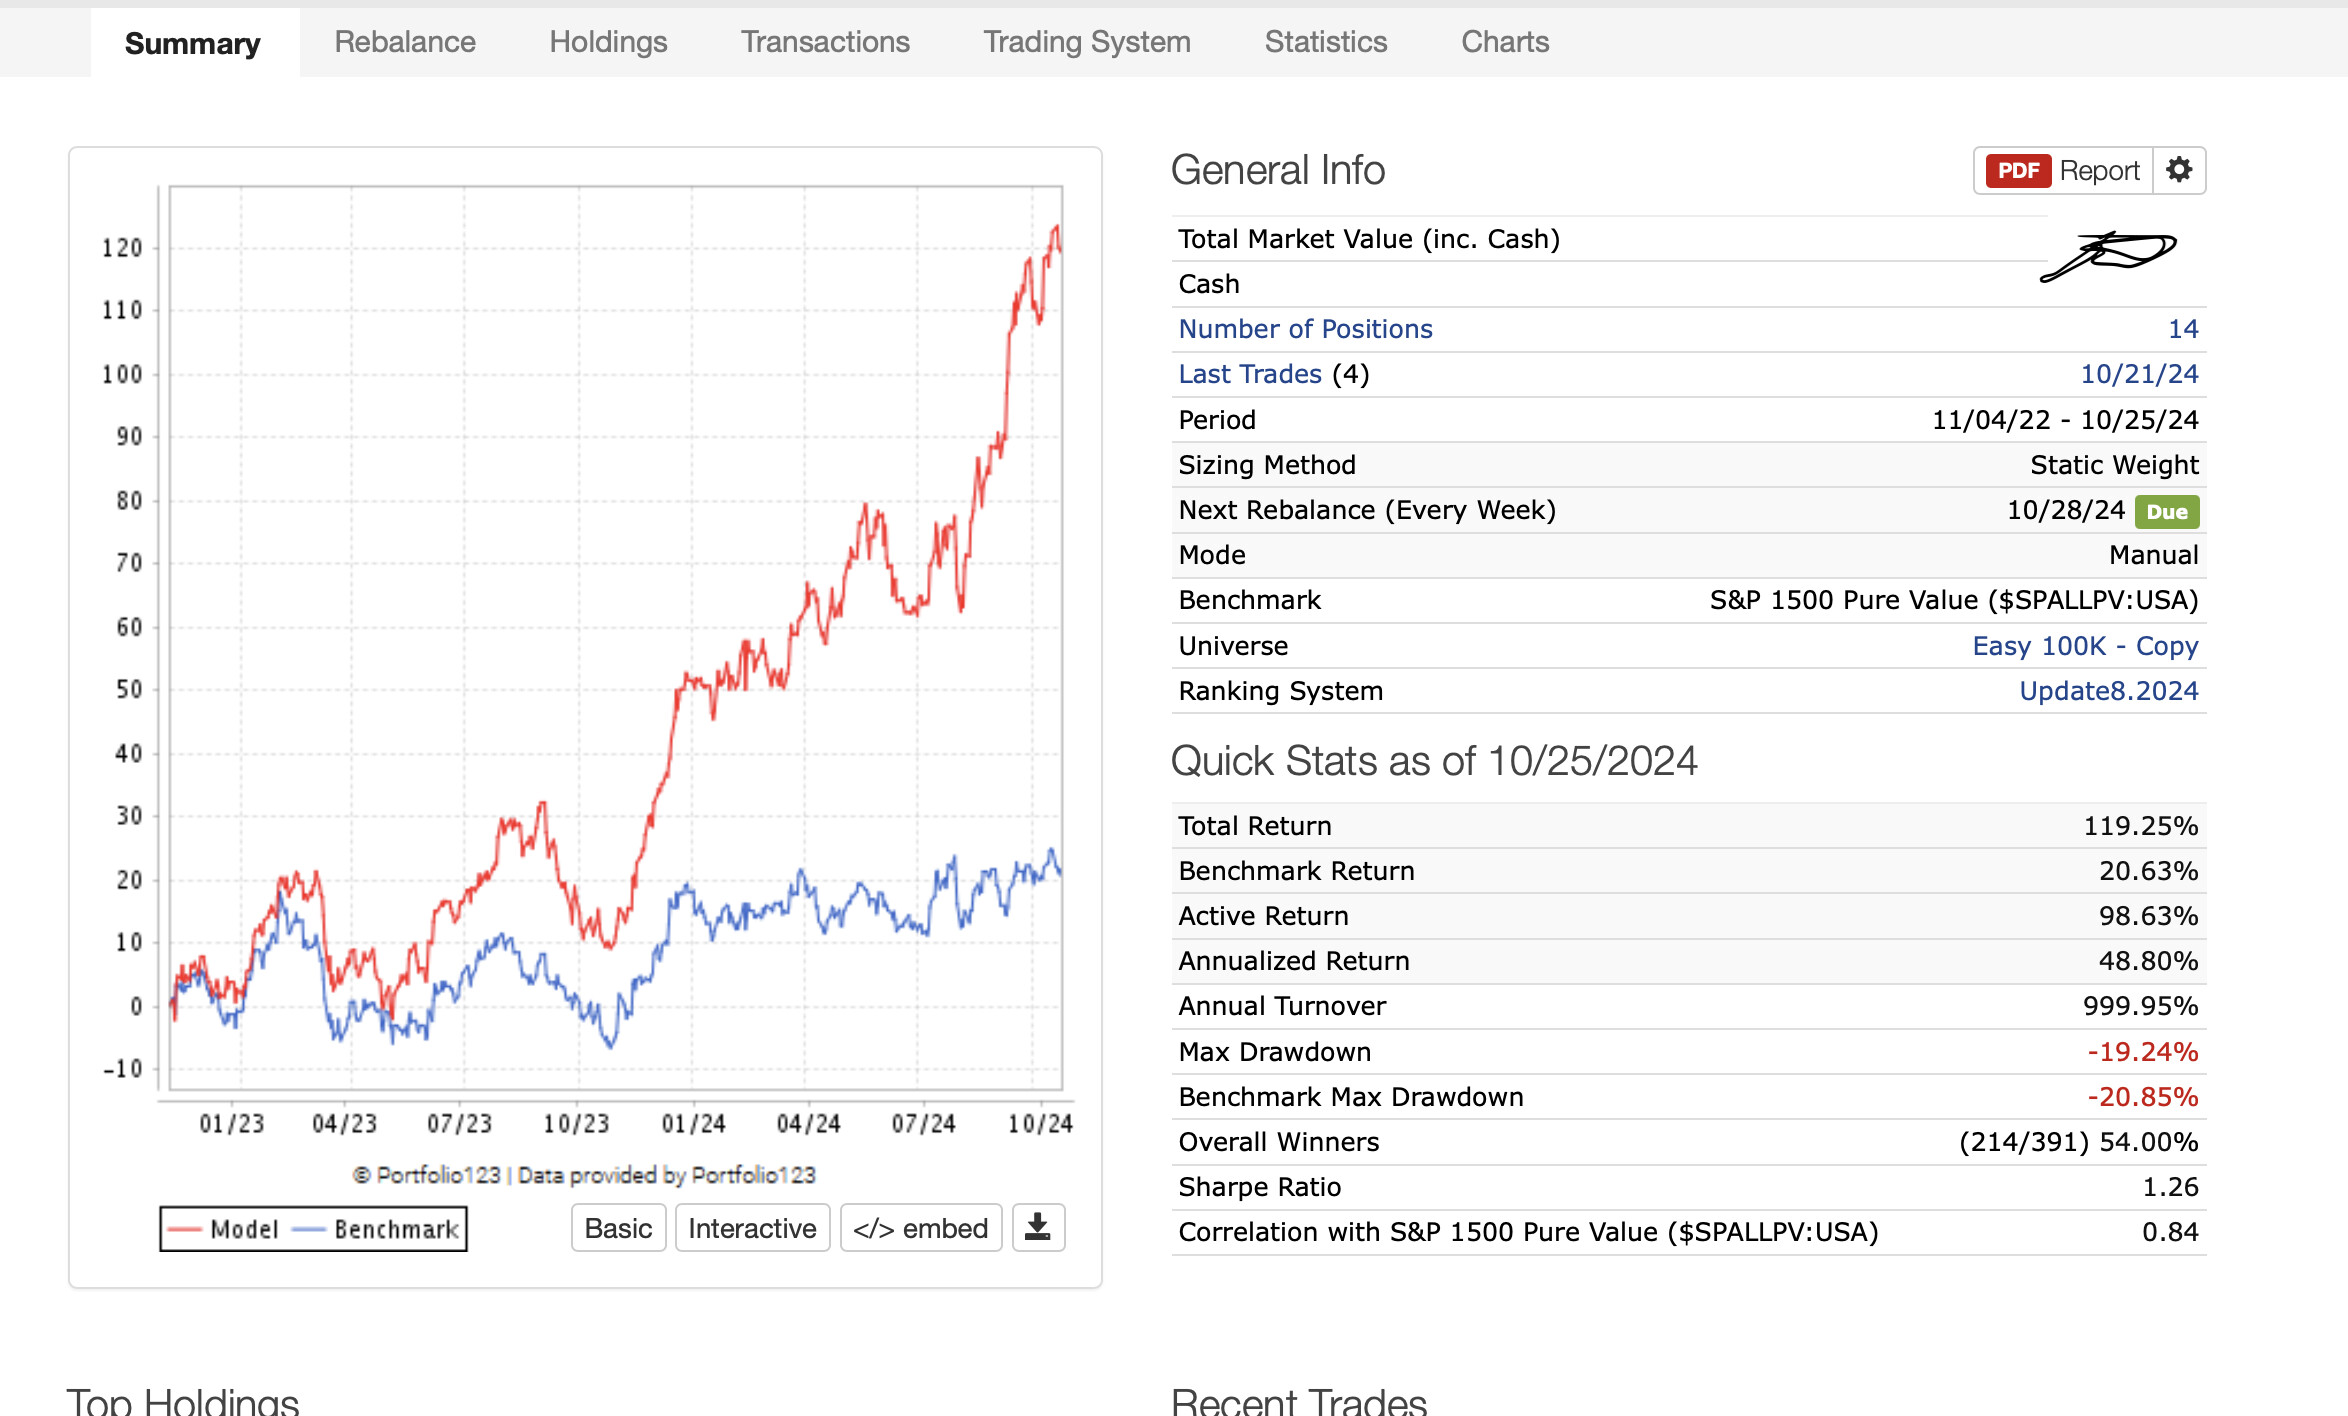
So as you can see in the port above by the name of the ranking system, it was updated 8.2024.
I plan to updated it at least annually around the holidays. Maybe around the 4th of July too. Depending on how many new factors I am looking to add. It is stable when I have not added new factors. Maybe what you would expect considering I use an expanding window and not a sliding or rolling window. I don't have a preference for either other than that is what has worked best with my cross-validations using my factors (so far). I keep looking at that. But a few months of new data does not change my model much when I am looking at 25 years of data.
When I started using the benchmark it was the most highly correlated to my model. But there are other benchmarks with good correlation to my model.
How can I incorporate sensitivity to real interest rates and VIX levels into an AI study alongside standard stock factors?
I’d like to analyze whether decision trees assign different weights to these factors based on varying levels of real interest rates and the VIX. I’ve already experimented with individual stock volatility but would like to explore the impact of these additional macro factors.
Additionally, I’m looking for guidance on setting alpha (stock return adjusted for beta * market return) as the target for the "easy to trade" universe. Any insights on a good formula that properly covers the large universe would be greatly appreciated.
Working on the formulas still and data cleansing. There are outliers in the historical MktCap data from Factset that would wreak havoc to a risk model. More on this soon and how we plan to circumvent it. This project will help up in several ways it seems.
I’ve been exploring workarounds since what I’m trying to achieve isn’t fully possible. Portfolio Visualizer falls short of meeting my needs, particularly when it comes to optimizing around specific exposures (e.g., minimizing or controlling exposures like USMV).
This serves as yet another powerful reminder of why having a robust risk model is essential.