I took a look at the P123 S&P500 & 1500 AI Factors and strategies - those look like they’ll be very useful examples! Thanks for that.
With the AI Factor S&P1500 live strategy, I saw one of the buy rules was
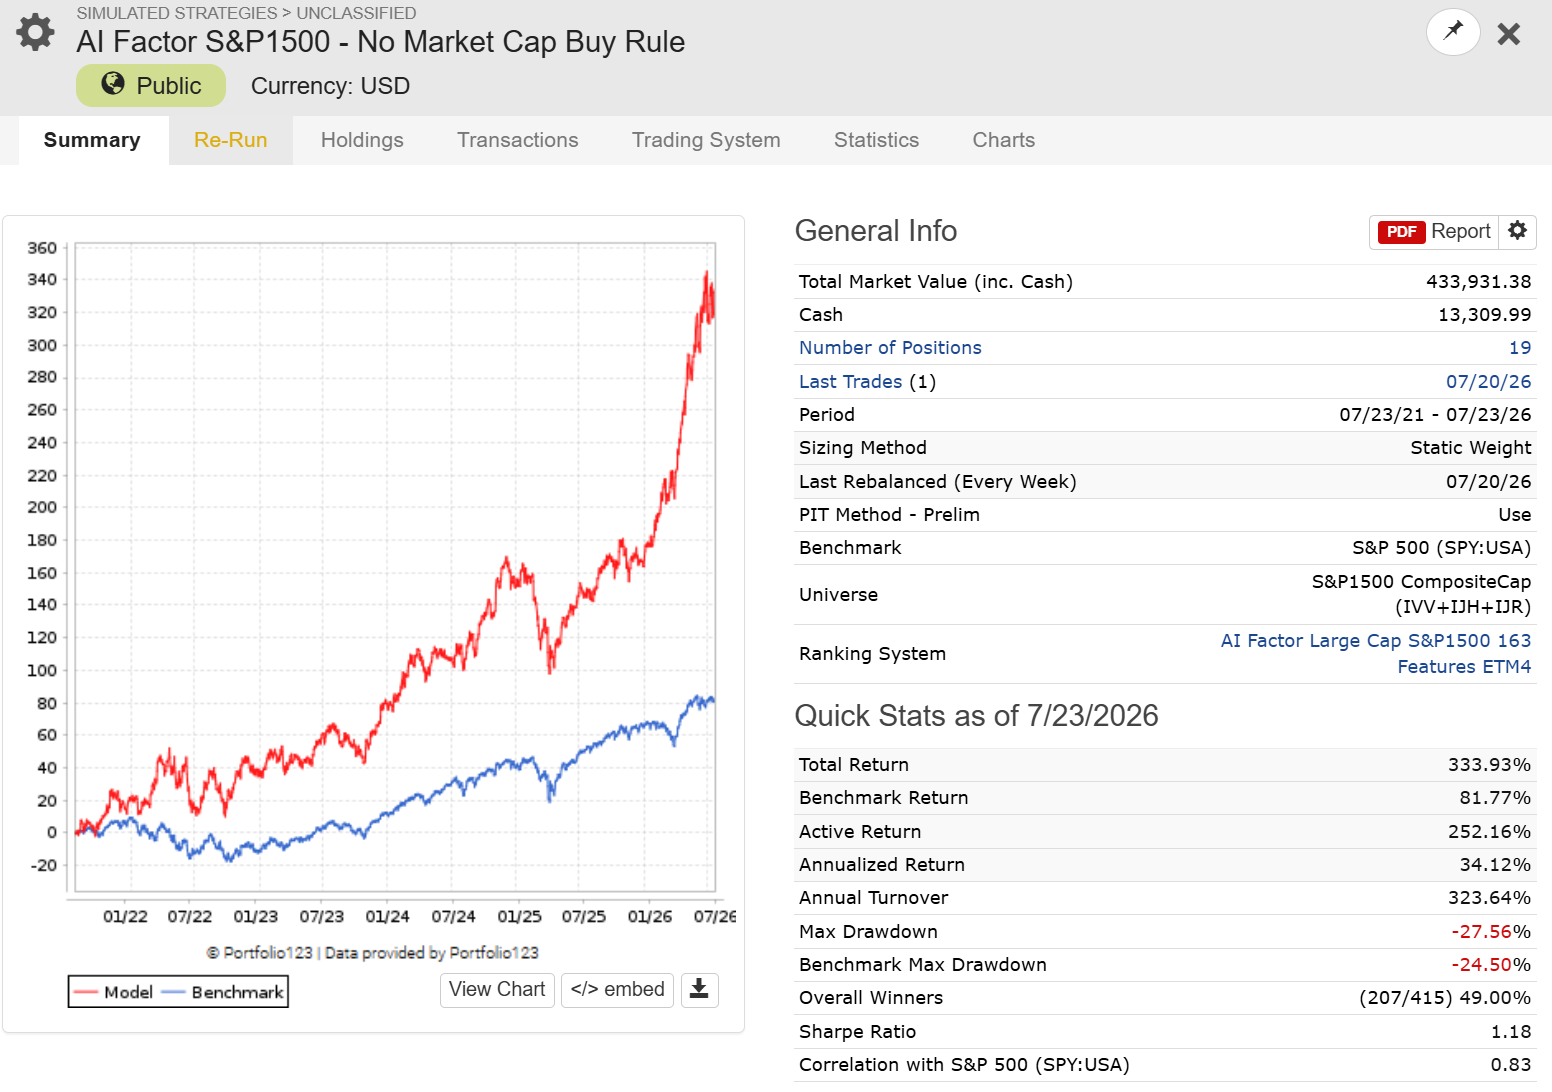
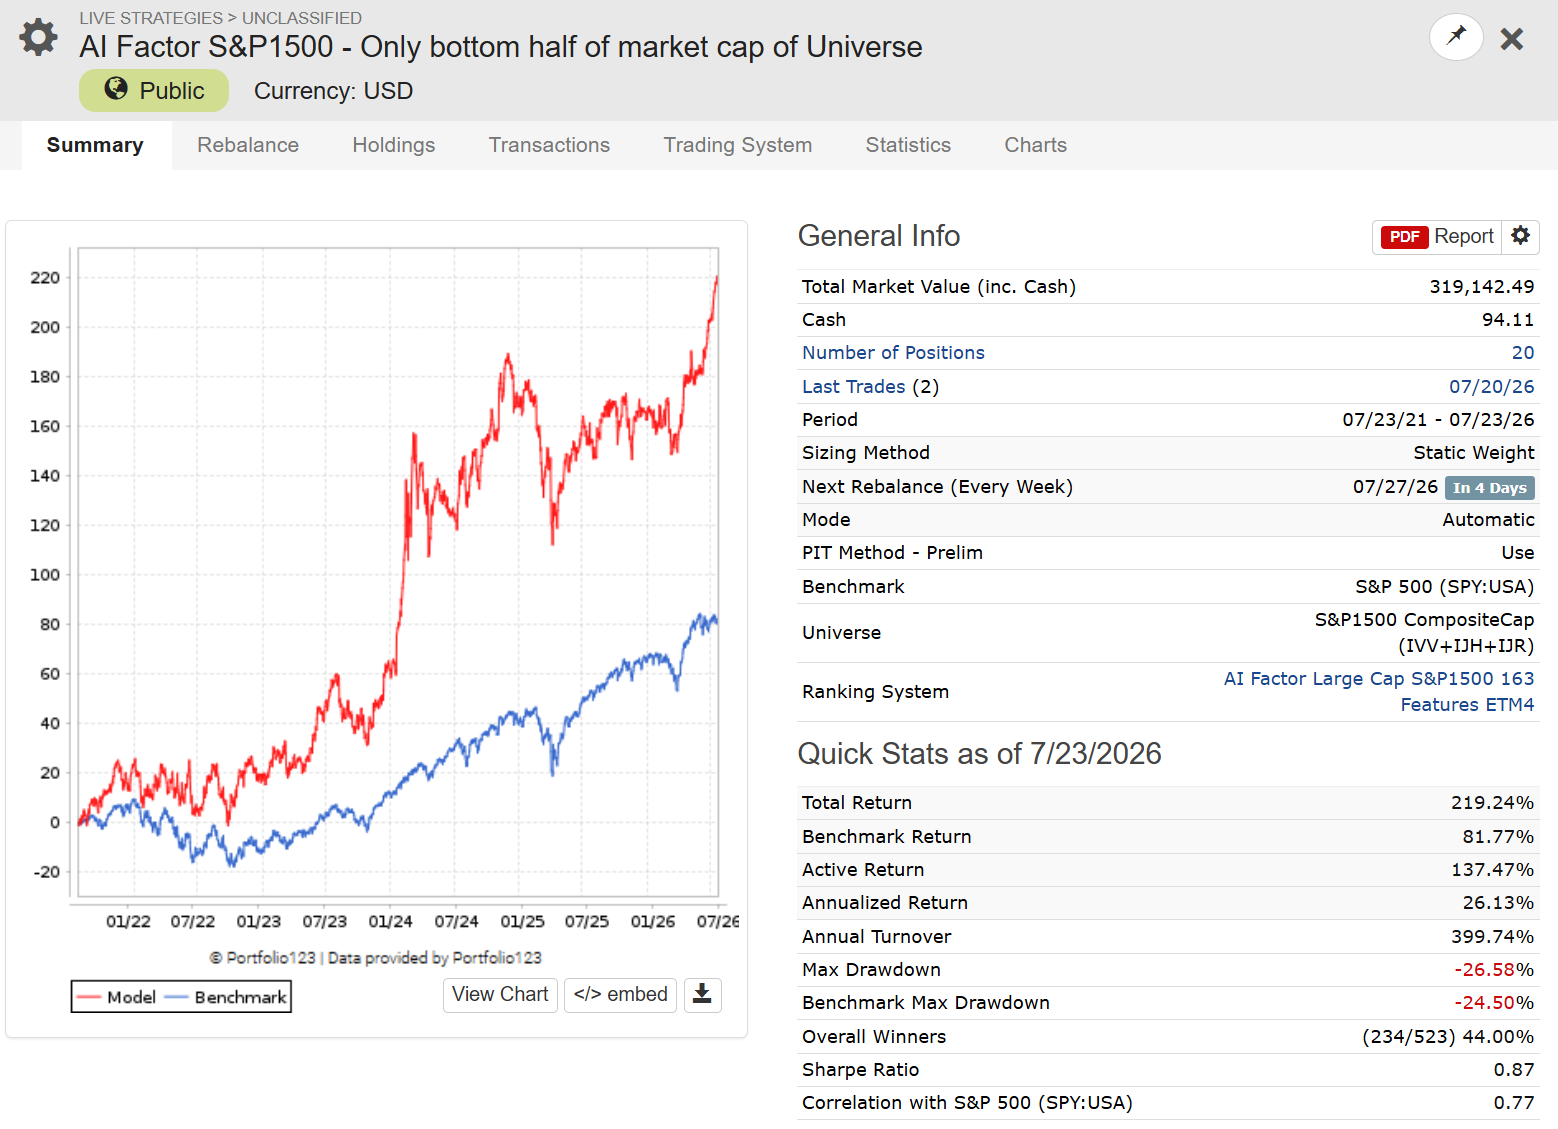
FRank("mktcap",#All,#DESC,#ExclNA) > 50
I believe this this would effectively mean that S&P600 small caps would never get added. Is that intentional? I was a bit confused by why the universe would include names that were not really selectable. Or did I misunderstand that rule?
Why the universe is the full S&P 1500. In the AI Factor, the Prediction Universe setting has two options: "Must be the same as training universe" or "No restrictions (advanced)." This one uses the first, so the strategy's universe has to remain the S&P 1500.
Because the predictor is trained on the full S&P 1500, it's a general-purpose component you can drop into other strategies, including small-cap-tilted, low-volatility, or any approach where a market cap floor isn't wanted. Had the filter been baked into the training universe, you'd need a separate predictor for each of those. In other words, it's a Buy rule rather than a universe restriction precisely because that's the layer you can experiment with, which is exactly what bobmc just did.
What the rule does.FRank("mktcap",#All,#DESC,#ExclNA) > 50 ranks within the simulation universe, the S&P 1500, so it keeps the top half by market cap, roughly the S&P 500 plus the larger mid caps. So yes, in practice S&P 600 names are mostly screened out.
Thanks for the replies! I’m glad to know I understood what that rule was doing since I’m still newer at this.
I thought about these replies some more - I’m not saying it’s bad at all, nor am I saying there’s anything wrong with targeting certain subsets, but based on these responses it seems that maybe the strategy’s name doesn’t accurately reflect what it is. It’s not an S&P1500 strategy. If you’re expecting a mix of large, mid and small, you won’t get the third part. The results look great! I think it just could use a new name. That’s just my minor feedback, though, and I could be alone on that. Great job overall!
I appreciate explanations here. But one thing I keep coming back to, though: the >50 rank cutoff conveniently drops exactly the segment (S&P 600 the worst performing part of the universe) that would've hurt performance. I get the liquidity argument for favoring larger names in general public strategy, but I'm curious whether the specific threshold (50, rather than say 30 or 70) was chosen for an independent reason, or whether it was tuned by watching backtest results. Not saying it's wrong, just think it's worth being explicit about, since 'the cutoff that happened to work best' is a pretty common way curve-fitting sneaks into otherwise sound designs.
Want to add that I always train on wider universe than I intend to trade on my AI strategies, but that is a choice I do before I build my strategy. Given the name of this strategy, it does not seem to have been the case here.
“chosen for an independent reason, or whether it was tuned by watching backtest results”
–> no I did not optimize the parameter to find the “perfect” cutoff, e.g. it was not tuned by watching backtest results
The strategy also works (not stellar but o.k.) via
FRank("mktcap",#All,#DESC,#ExclNA) < 50
Summary:
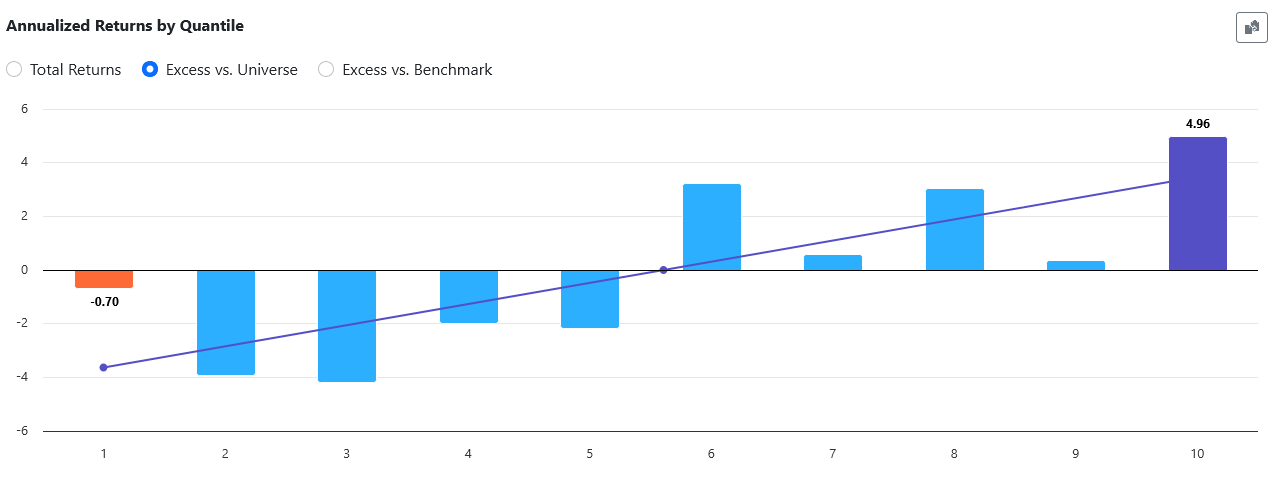
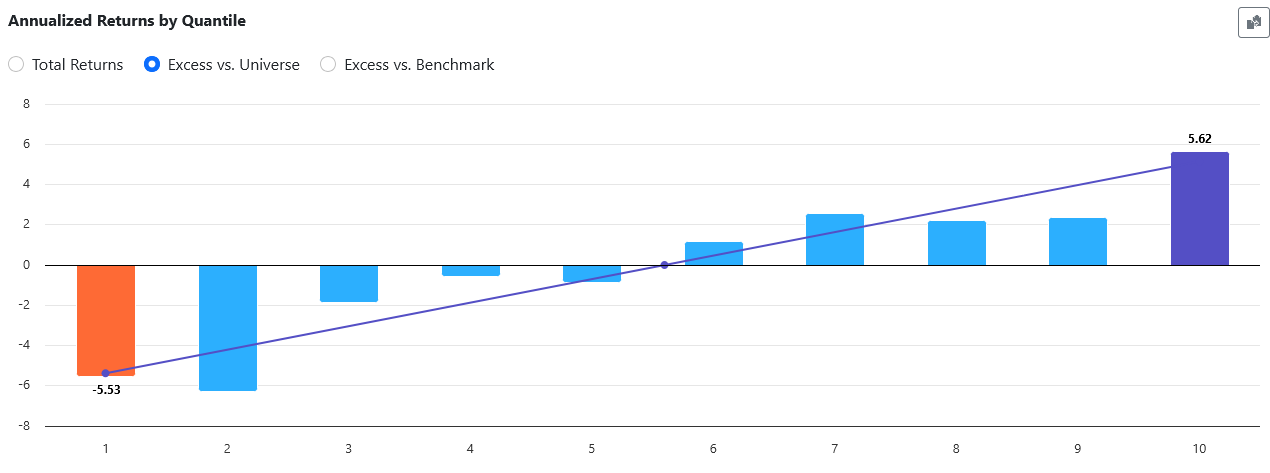
It backtests well without the rule, it It backtests well with the lower half of the market cap of the universe and it It backtests well with the Top 50% of the market cap of the universe.
So I compared that to a ranking system that I created more than 5 years ago which has not been updated during that period and which was not created with the S&P 1500 in mind.
My own ranking system had far better out-of-sample performance on exactly the same universe.
Obviously, this is just one example and proves nothing, but I thought it was interesting and worth sharing. Unfortunately, it reinforces my personal skepticism about machine learning algorithms.
A while back, I finally came around to trusting traditional ranking models enough to implement them. Ever since AI Factor arrived, I've had a nagging sense of missing out, partly because these models seem to span cap space in a way the systems I trade don't.
I've yet to find a large-cap model that fits my mix and that I trust, so a good AI model feels like it could kill two birds (satisfying the AI Factor pull and covering the full cap space). But I still haven't come to terms with how to trust one. For those of you running AI Factor models with real money: what got you over that hump?
Edit: The hardest part for me is that the training window spans a decent range of market conditions, but the holdout period is essentially one regime — the post-COVID liquidity era. Even with 2022 in there, it has no protracted bear, no full credit cycle. So I can't tell how representative holdout performance is of what the model will do in whatever comes next.
That said, there are many I respect on here who seem to be strongly down the AI path, so I am interested in continuing to find my way. I hope to see more DM models appear.
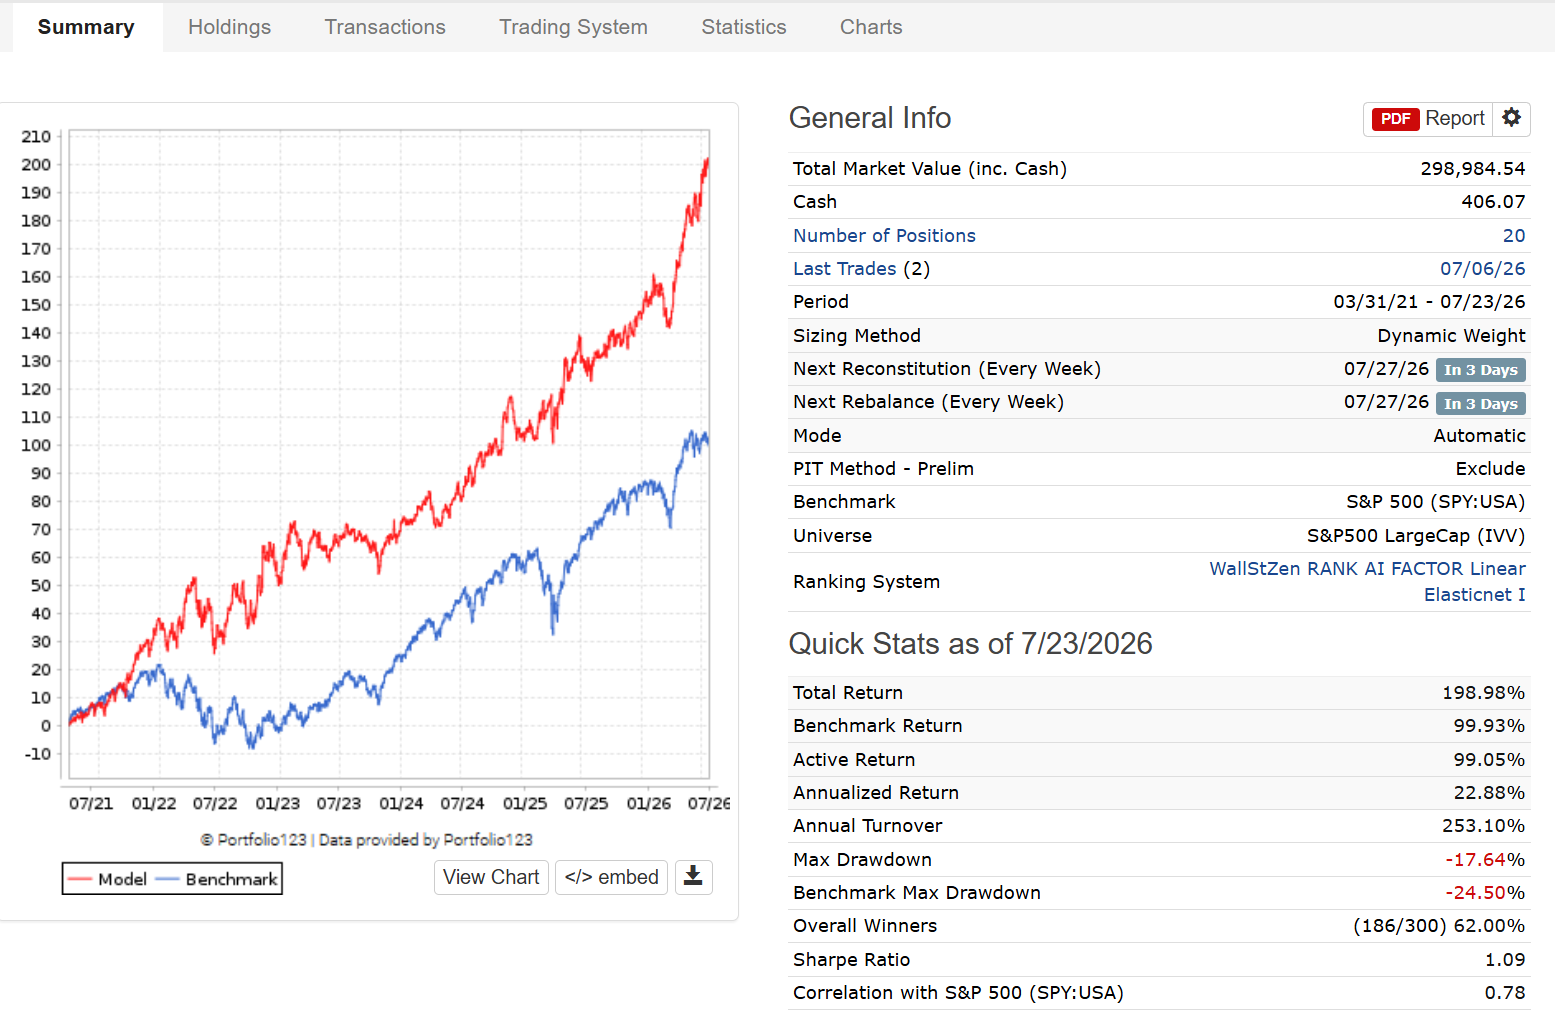
Yuval, can you run it with the exact buy and sell rules of the model? Would be interested to see the results. Also, I would love to work together with you “translating” one of your existing ranking system to the AI Factor World (using the Factors one to one as Features, test on SP500 / SP1500 and small cap universes)
We did this with some existing customers with great success:
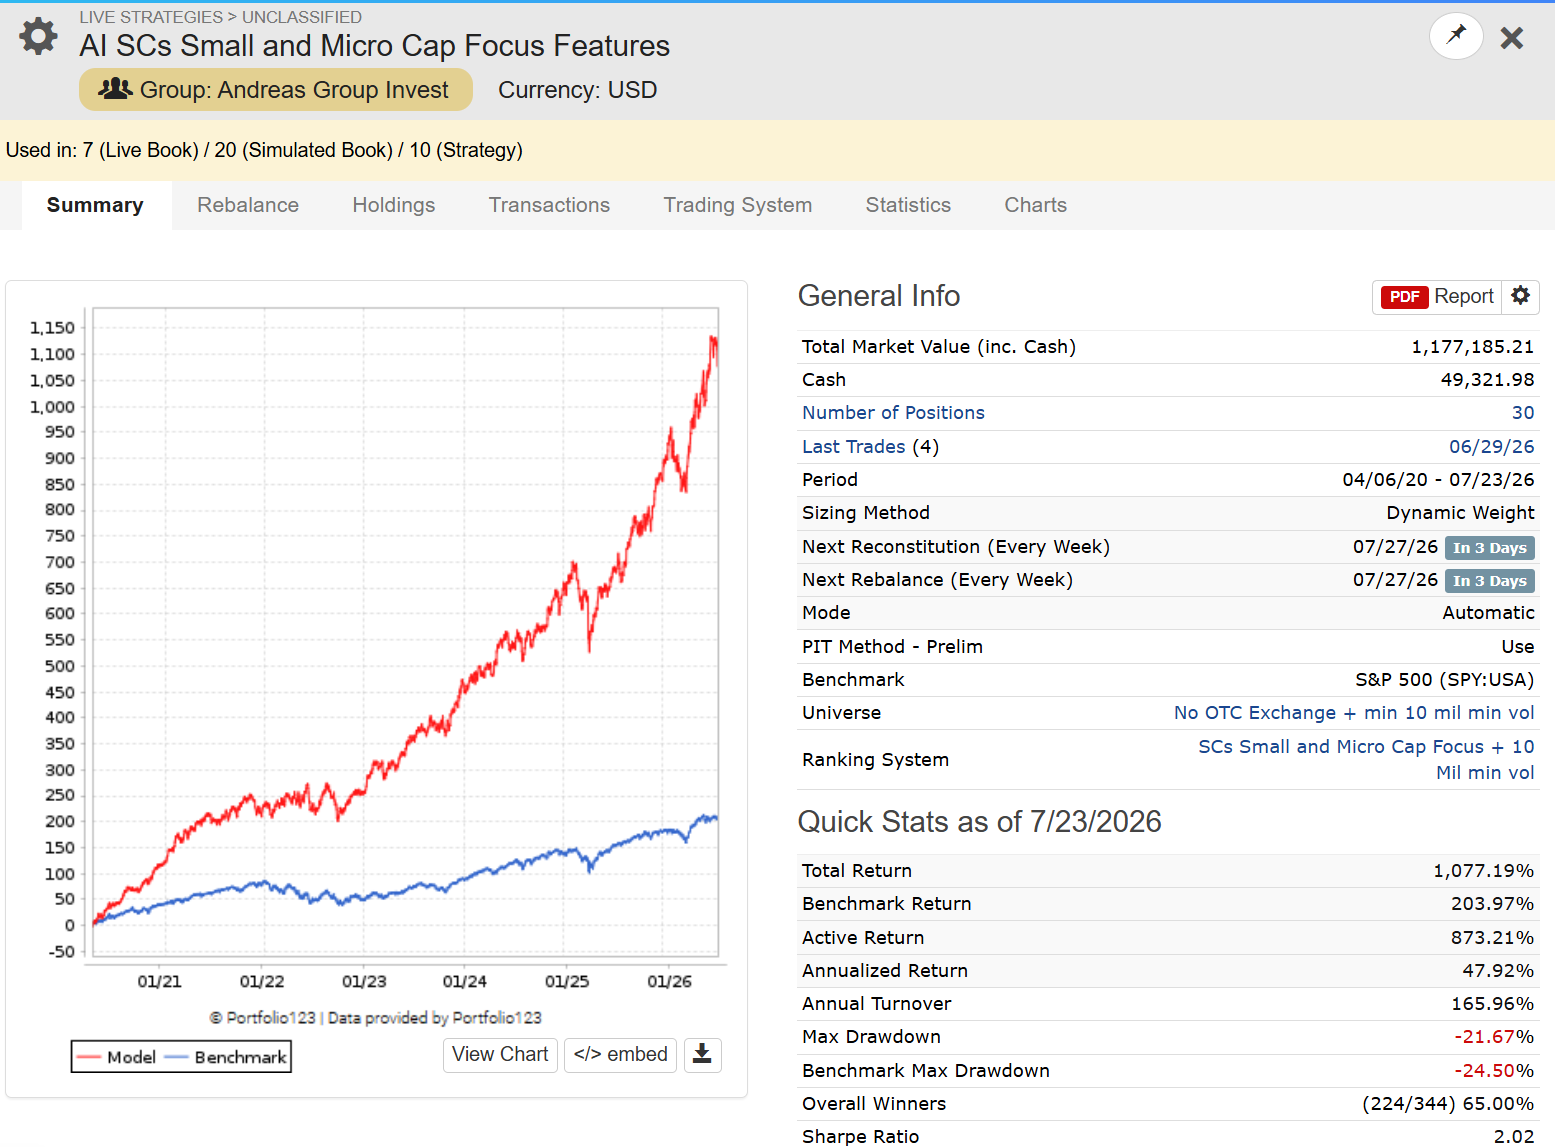
Examples are here (can not name the customer, OOS literally since the low of this year, e.g. 03/31/26)
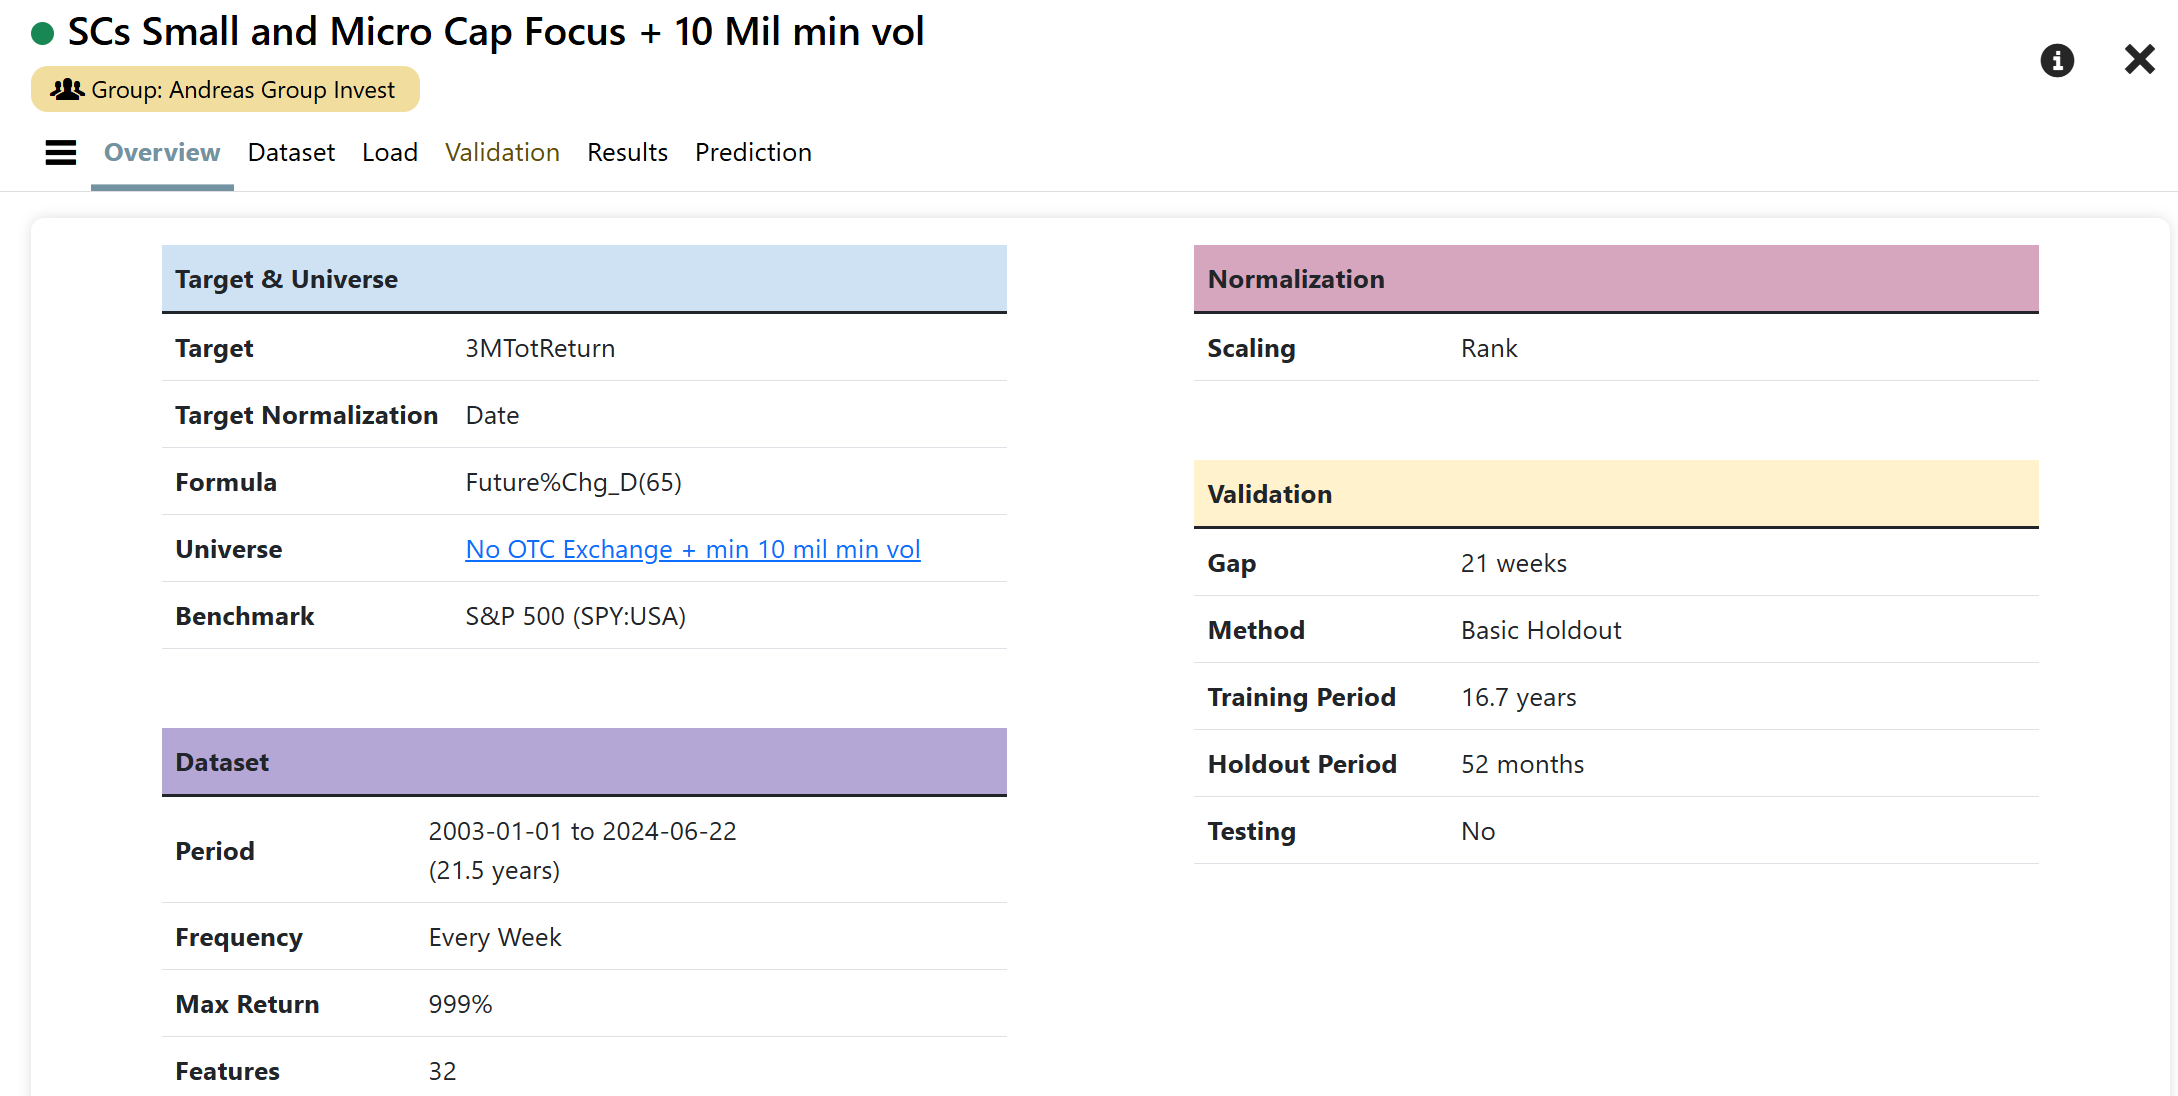
ExtraTrees Hyperparams: { "n_estimators": 600, "criterion": "squared_error", "max_depth": 12, "min_samples_split": 10, "min_samples_leaf": 5, "max_features": 0.3, "bootstrap": true }
Of course very early to tell, but predictor did not “see” holdout data and so far, OOS Live replicates + ML/ Hyperparameter Sensitivity is very low (e.g. it does not matter which ML / Hyperparameters Combo your through on the model, they all find signal which points to robustness).
The underlying above AI Factor Model took the Features from the ranking system “Small and Micro Cap Focus” https://www.portfolio123.com/app/ranking-system/403577 and used it one to one (32 of the 34 I think, starting date was to early for two features) as features.
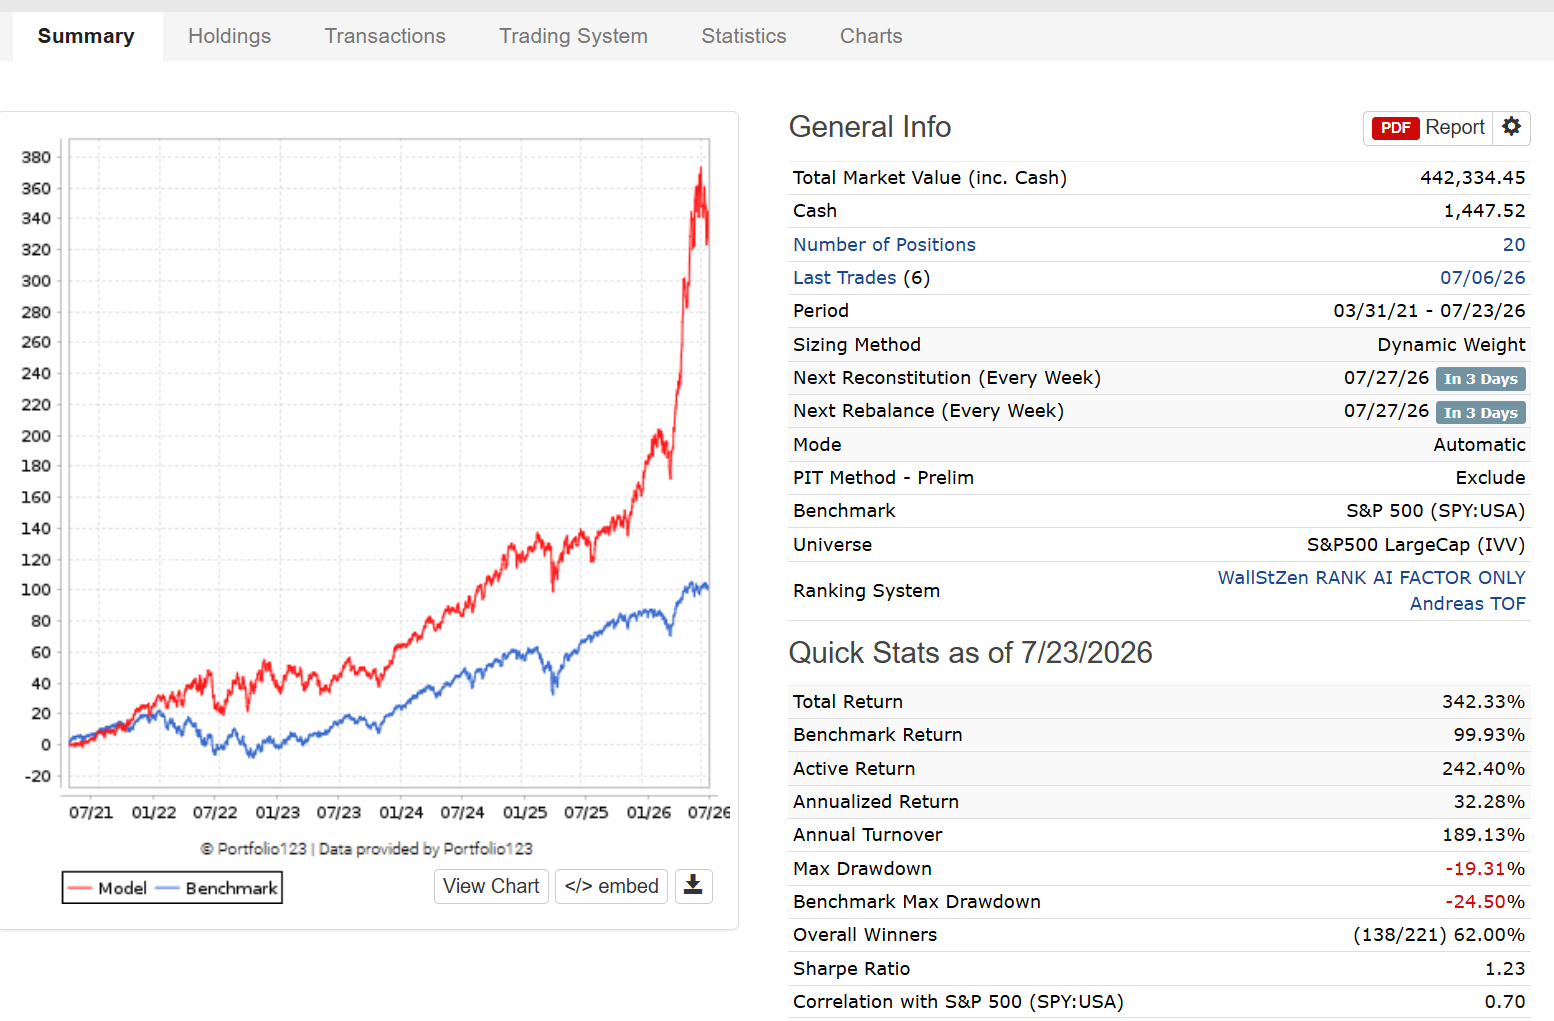
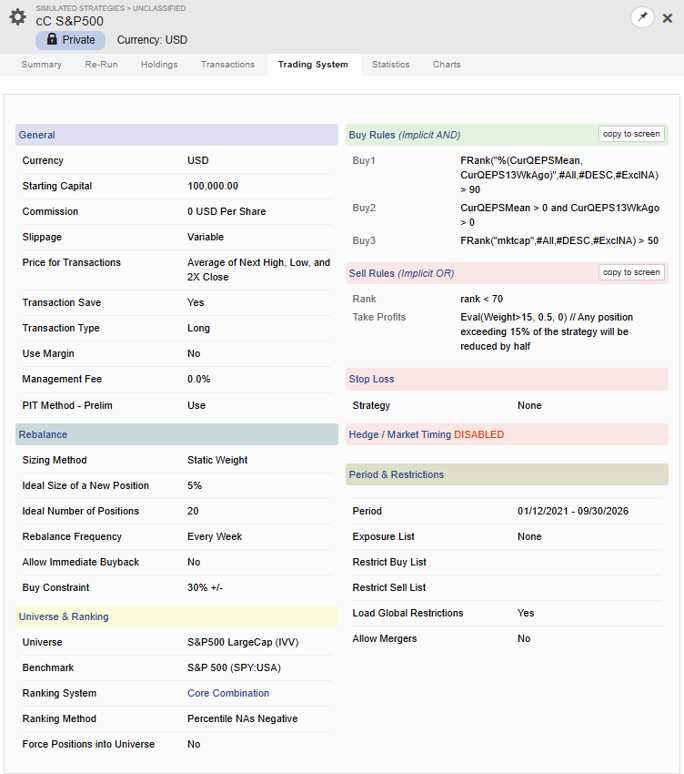
OK. But first I want to say that those buy and sell rules are crazy--they eliminate 95% of the universe. So here are the results with the AI Factor ranking system:
I performed an analysiss of the current strategy holdings to better understand what the model is picking under the hood. Specifically, I calcilated the average rank of each factor from the 'Core Combination' ranking system across current holdings relative to the S&P 1500 universe.
TOP 10 (we expect here factors: 'higher better'): All the factors align with economic logic.
BOTTOM 10 (we expect here factors: 'lower better'): several factors have an average rank below 0.50, even though we might typically expect higher ranks (e.g., OpIncGr%5Y at 0.32 and OpMgn%TTM at 0.34).
This behavior highlights the non-linear nature of tree-based models: they don't require a stock to score high on every single metric. A stock in the 10th percentile for operating margin can still be selected if that weakness is compensated by extreme strength in another branch (e.g., the 90th percentile in cash flow yield or earnings revisions).
The extreme word is actually quite important here and distinguish tree-based system from the linear ranking.
TOP 10 factors based on average rank within S&P 1500:
factor
avg rank
%(CurQEPSMean, CurQEPS4WkAgo)
0.72
UpDownRatio(20,0)
0.69
%(CurFYEPSMean, CurFYEPS4WkAgo)
0.68
%(SalesGr%PYQ, SalesGr%TTM)
0.66
OpIncGr%PYQ
0.64
NetFCFPSTTM / Price
0.64
CurFYEPSMean / Price
0.61
IntCov5YAvg
0.60
Pr26W%ChgInd
0.58
Close(0) / Close(60)
0.58
BOTTOM 10 factors based on average rank within S&P 1500:
@judgetrade and/or P123 . I am just trying to understand the useage of the predictor (in general), but my question is specifically about this strategy. When I look at the ranking system, the predictor is "AIFactor("AI Factor S&P1500", "extra trees medium 4")" . Going to the AI Factor and looking at the P123 AI factor S&P1500 model, this predictor is trained from 2004-01-01 to 2020-06-01.
The Live model was obviously converted from a Simulated Strategy to conserve the equity curve. However, going forward should the predictor be re-trained to reflect more current data? You have mentioned that it is good practice to re-train yearly.
Newer data can catch the current rate and leadership regime, or teach a stretch that will not repeat. A black swan rarely breaks Extra Trees. A long, unrepresentative period can.
2004–today mixes several markets. 2016–2026 looks more like now, but it is short and one regime. Rates only matter if they are in the features for example, or ride along with what co-moved with them.
Try a long-window sibling and a recent-window sibling, same spec, scored only on unseen data. Swap the live predictor only if that stretch is clearly better or at least your results have keep patterns. Otherwise leave it.
I usually train from 2003-01-01 to 2020-06-01, then put the predictor into the holdout portfolio strategy (simulation) to see the equity curve under realistic slippage, buy and sell rules, etc.
What I like about this approach:
1. I can refer to the statistics of the model under the „Compare All" tab. P123 documents this in the AI Factor S&P500 Model Configuration Overview (AI Factor S&P500 — Model Configuration Overview - Portfolio123 - Help Center see section Hyperparameter Sensitivity). If I retrain the predictor to six months ago, I have lost those statistics — and I no longer know how the predictor behaves when trained on the new data.
2. I keep the holdout portfolio intact. The simulation that is now a live model stays comparable. I can compare OOS live behavior against OOS holdout (sim) behavior. If it replicates (relative to market impact), I know I'm fine.
3. The holdout stays truly unseen. This is the only way to verify that the model isn't curve-fit to recent data — though that is a weak argument, since it isn't truly unseen, because I see how >10 MLs are doing.
Others train from 2003–2020.06, look at the stats, and then retrain on 2003–2025 under the assumption that „more and newer data is better" (which can be right, I know poeple making money with it!!!).
This is just my approach. But so far, it gives me a good replication rate — OOS live mirroring OOS holdout.
Hello all (Note that this is my first post in Forum. I am presently in 6 months training with P123 Ultimate subscription),
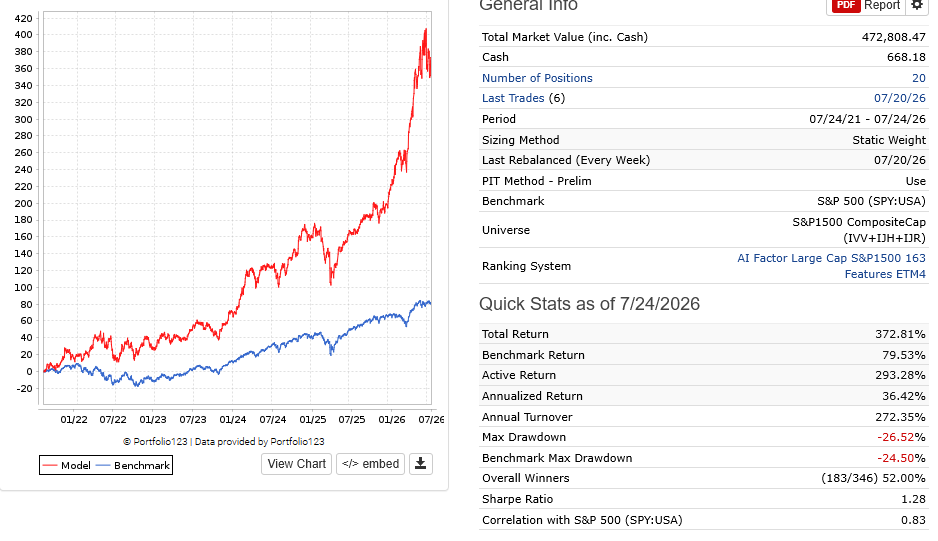
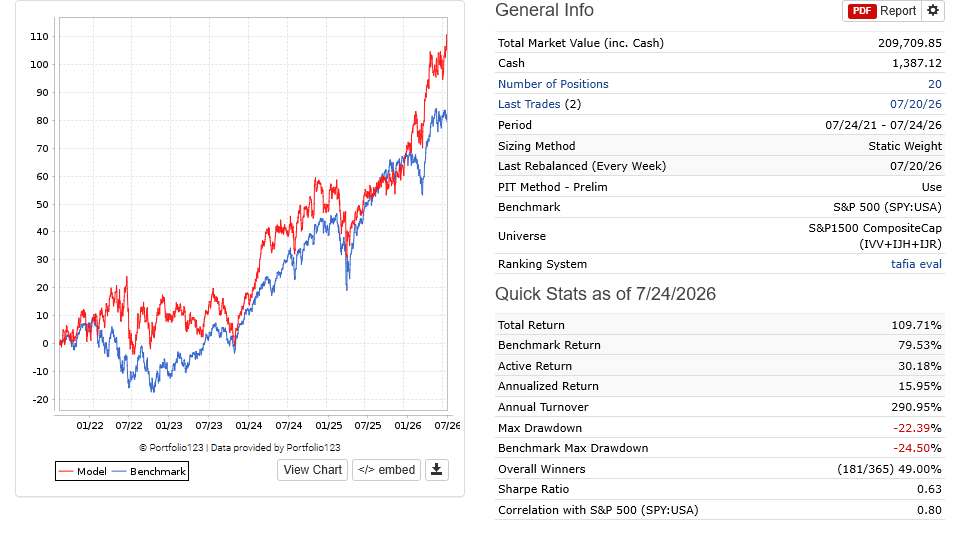
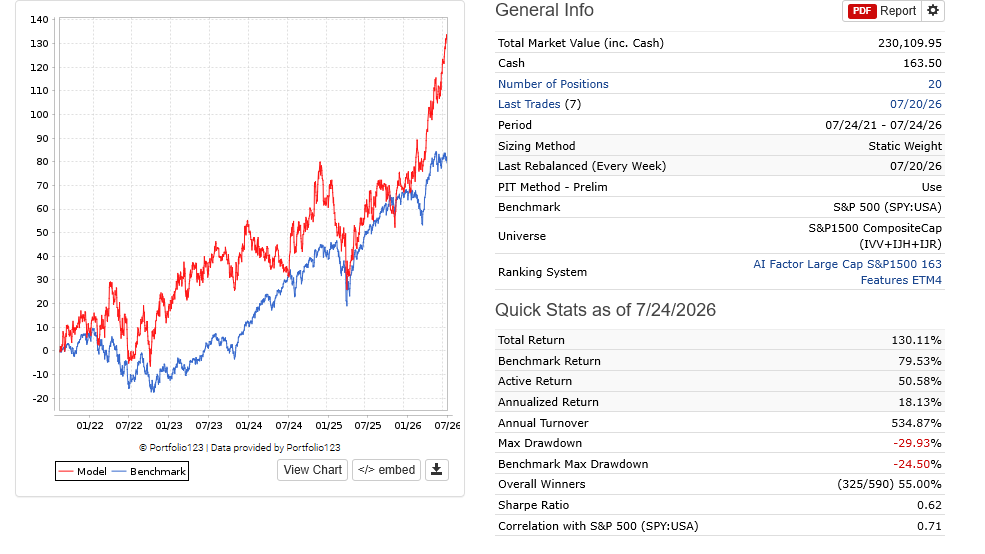
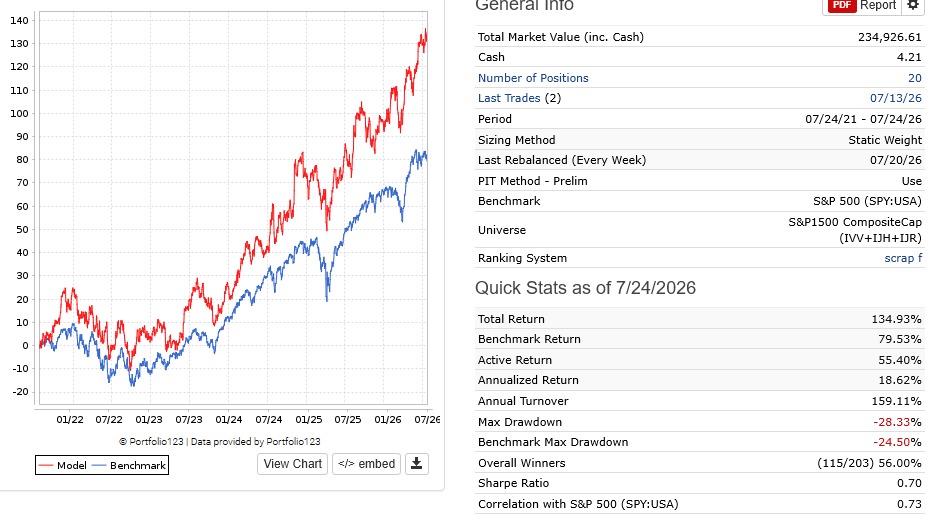
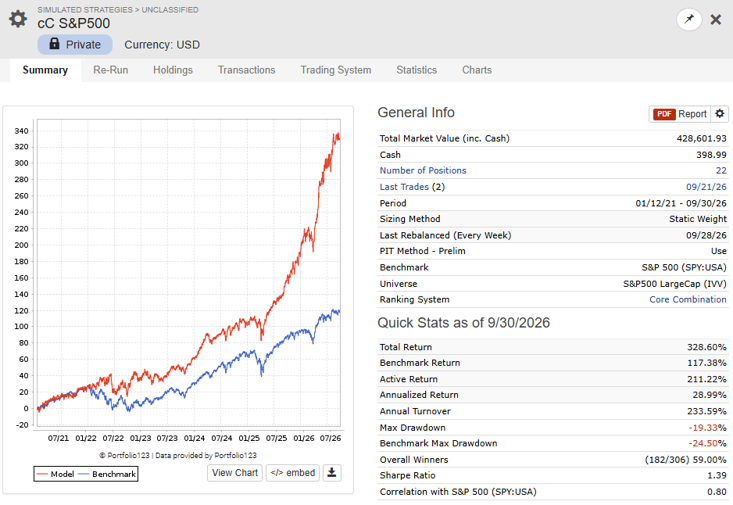
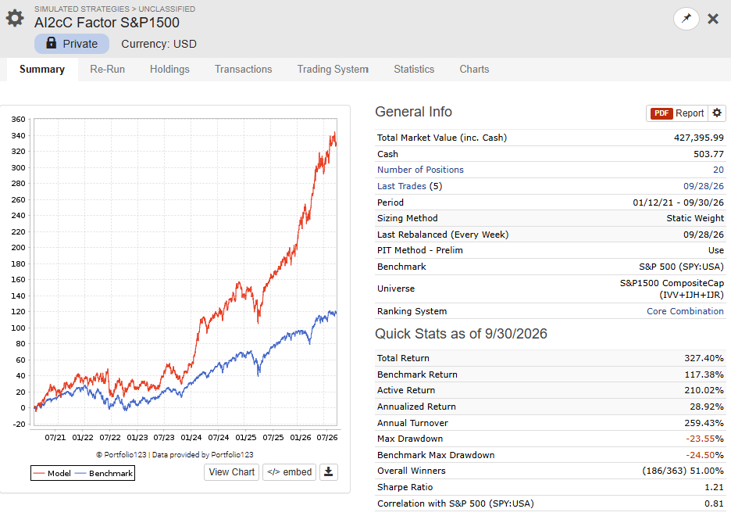
Versus ‘AI Factor S&P1500’ and ‘AI Factor S&P500’ I found that BUY Rules are dominant for the strategy performance. Below Simulations of ‘cC S&P500’ compare quite well with ‘AI Factor S&P500’
Overall, it seems that: - BUY rules are dominant effect, and - ‘AI Factor Large Cap S&P1500 163 Feature ETM4’ add ~10% in Annualized Return from the 29% from BUY and SELL rules. Does this make sense? What are your comments looking at these comparisons?
Thanks to Andreas for providing these P123 AI Factor strategies.
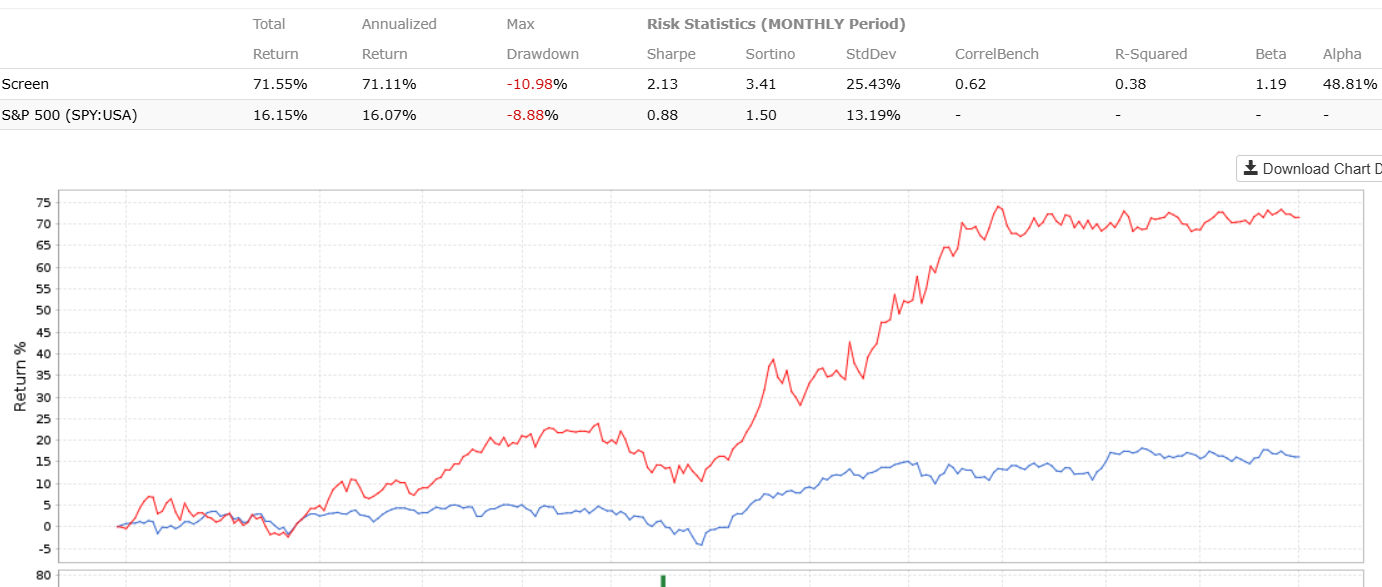
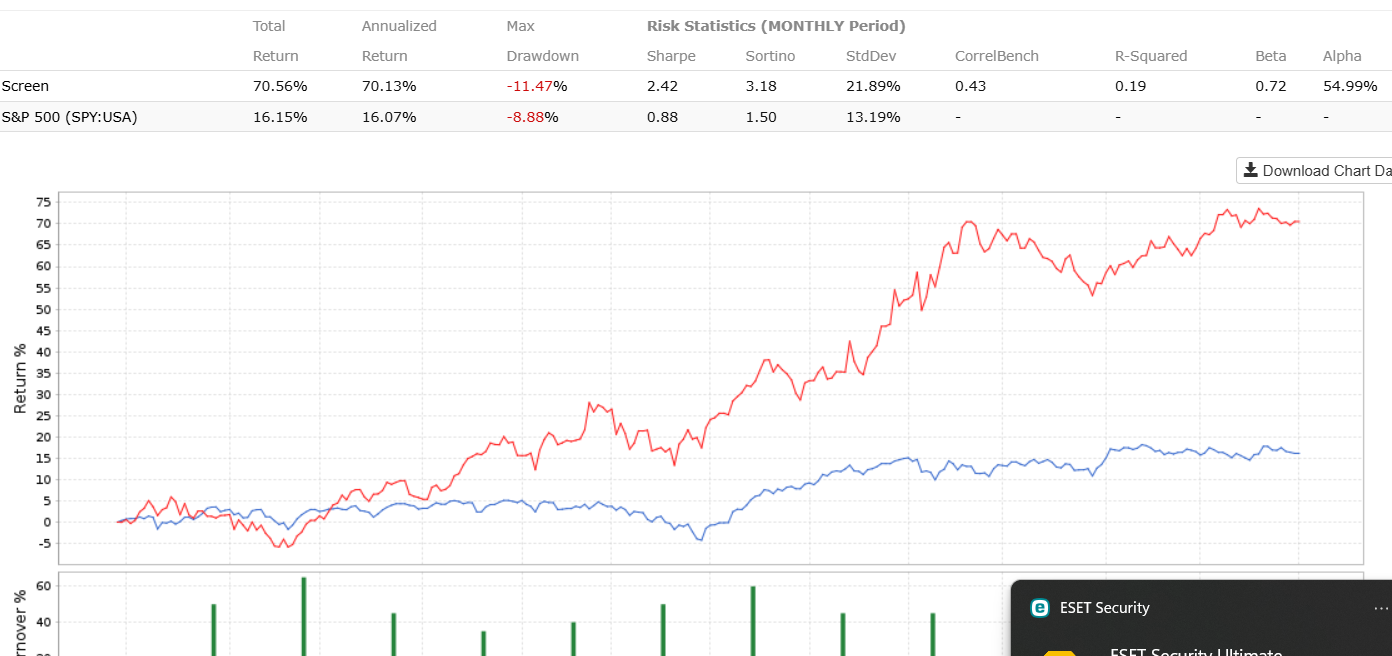
Given your post I checked the results of an AI predictor I made 12 months ago which has been running Live since. Below is the result using the Predictor trained to 2020 (true OS).