Good morning. Trying to decide whether or not to dedicate some time & $ to trying the AI ranking here. What are you guys seeing for improvement (CAGE & Max DD) versus your own best multi-factor models? Thinking in-sample at this point since the AI is performing well but relatively new here...
I don’t use P123 AI Factor module myself, but it seems that nobody is currently publicly tracking live performance models based on AI Factor ranking.
Portfolio123 Models: 0
Designer Models: 0 (as far as I know)
why ? ![]()
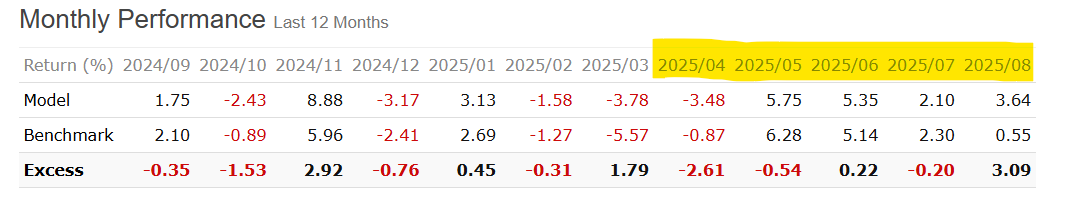
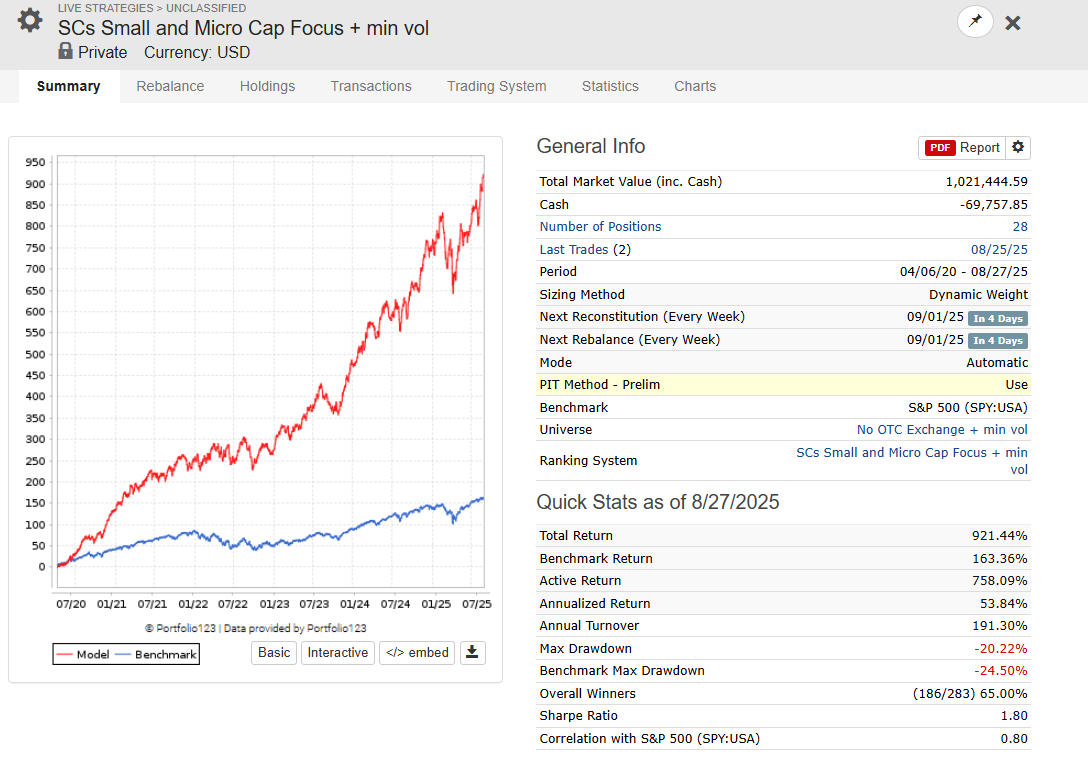
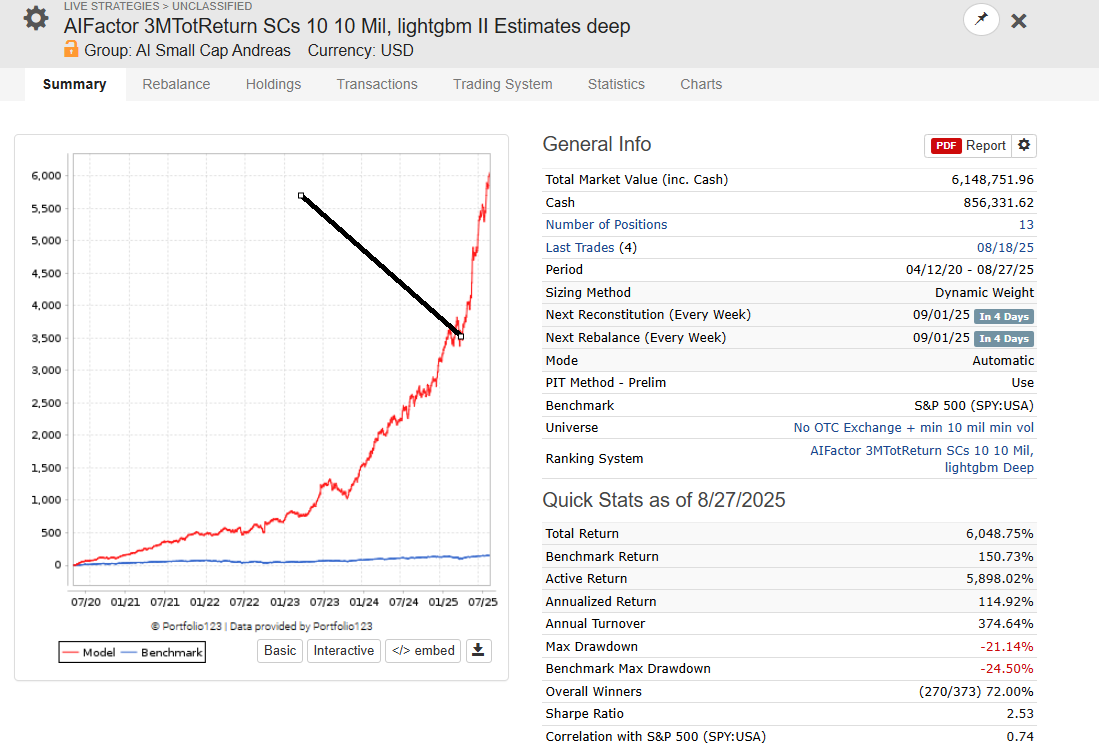
I did a bit of digging and found two live strategies that are likely using AI Factor from Andreas – in my opinion, one of the best AI Factor users here.
Please note that the models below may not necessarily be his best-performing ones.
I highlighted what I believe to be the possible live trading period, based on the assumption that live performance should start about 5 years after inception.
< https://www.portfolio123.com/performance_stats.jsp?portid=1855857
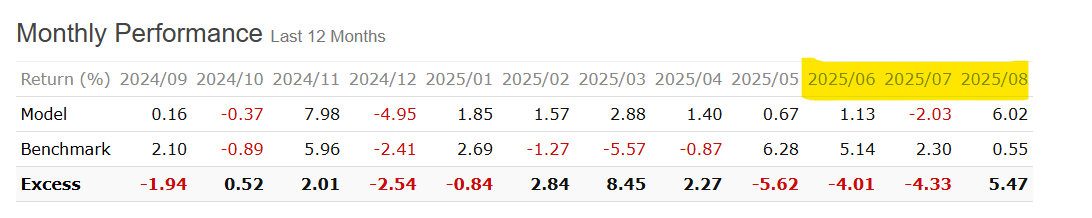
< https://www.portfolio123.com/performance_stats.jsp?portid=1843934
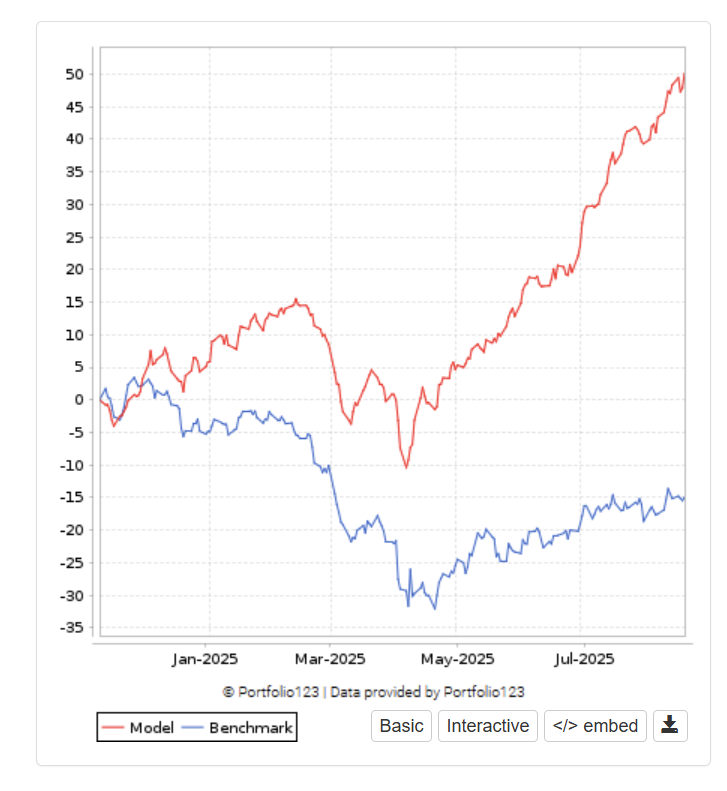
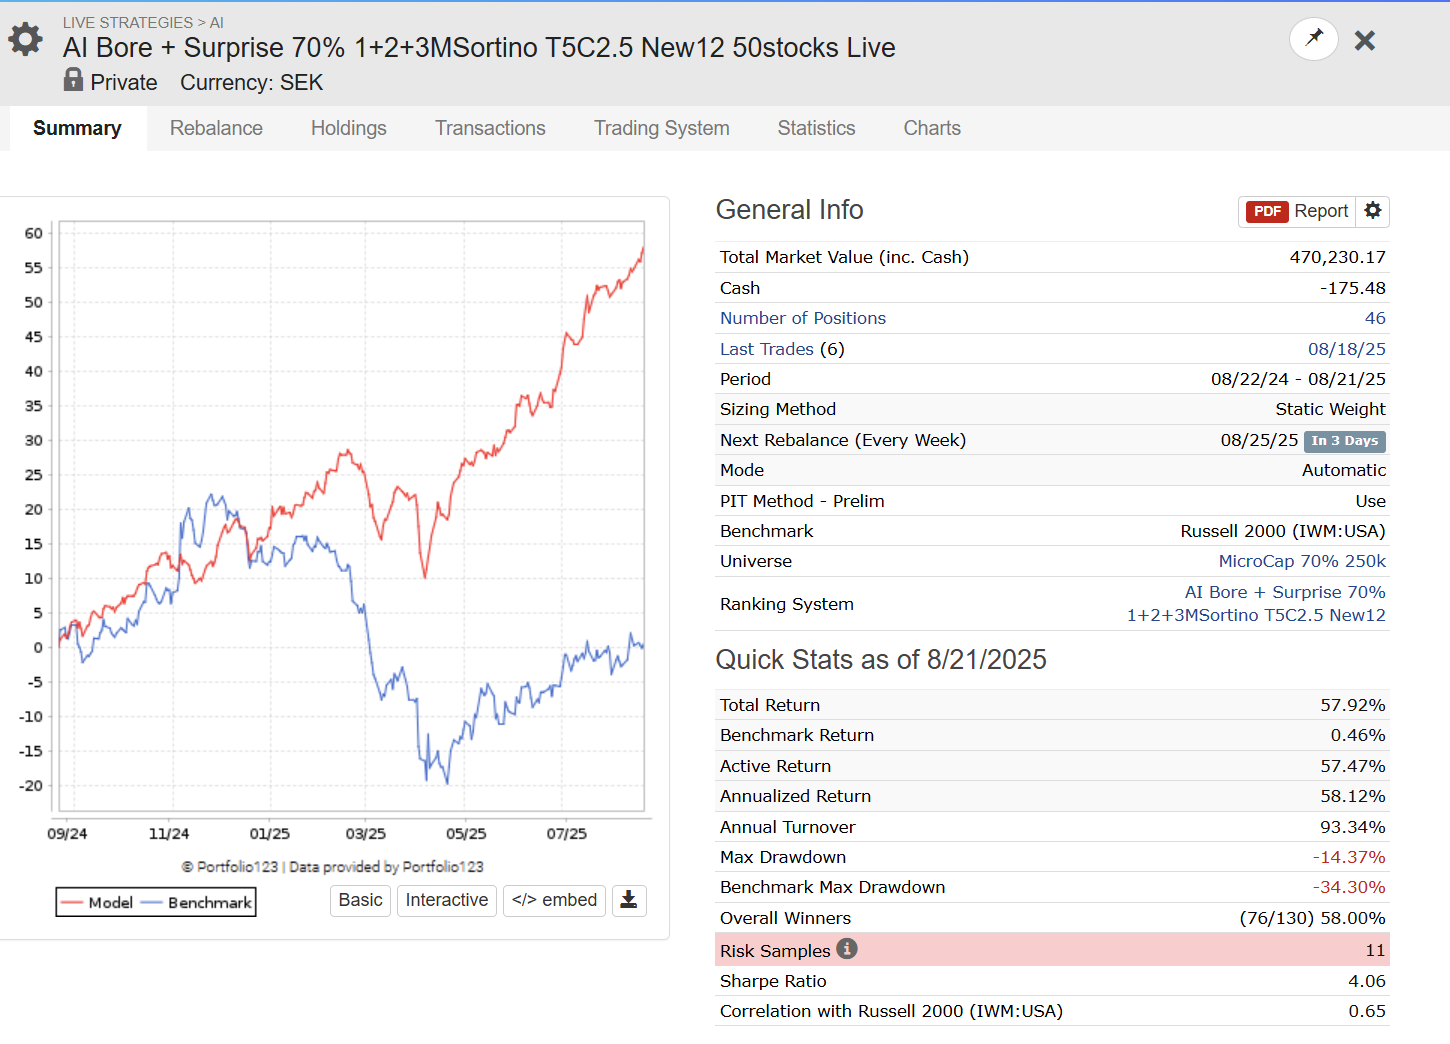
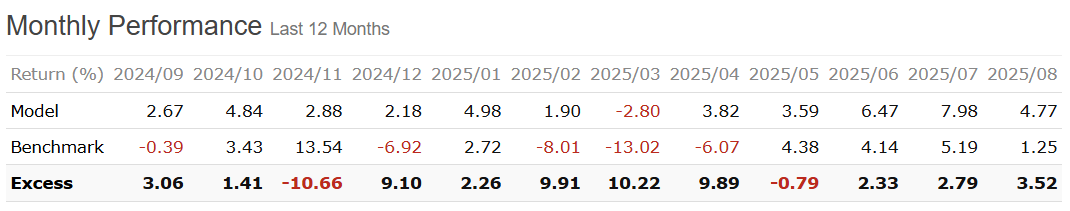
I'm have been running 3 live strategies on my accounts since before new year. One of them is my best performing strategy this year, the other two or on par with my traditional strategies.
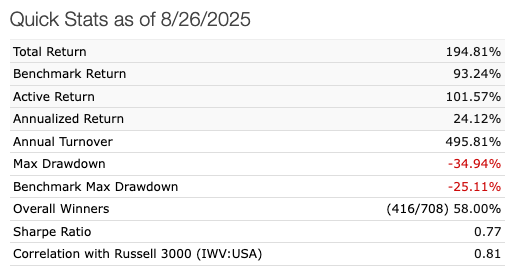
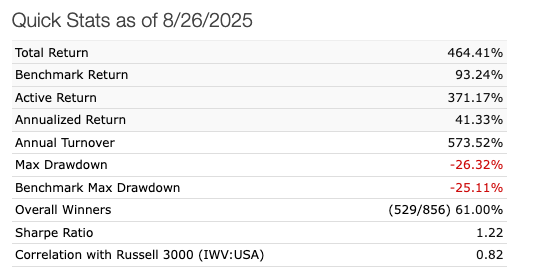
Below are two none linear strategies.
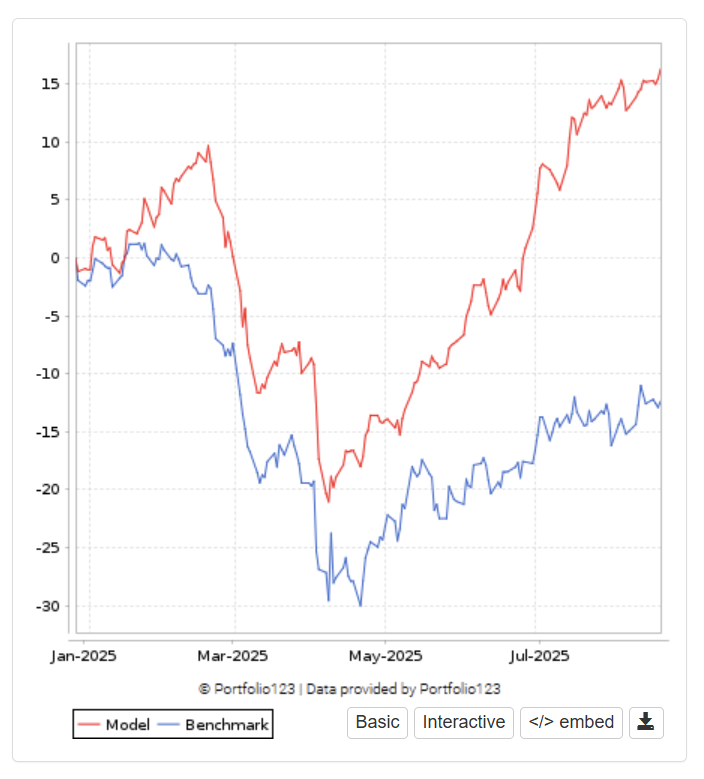
This is a linnear strategy.
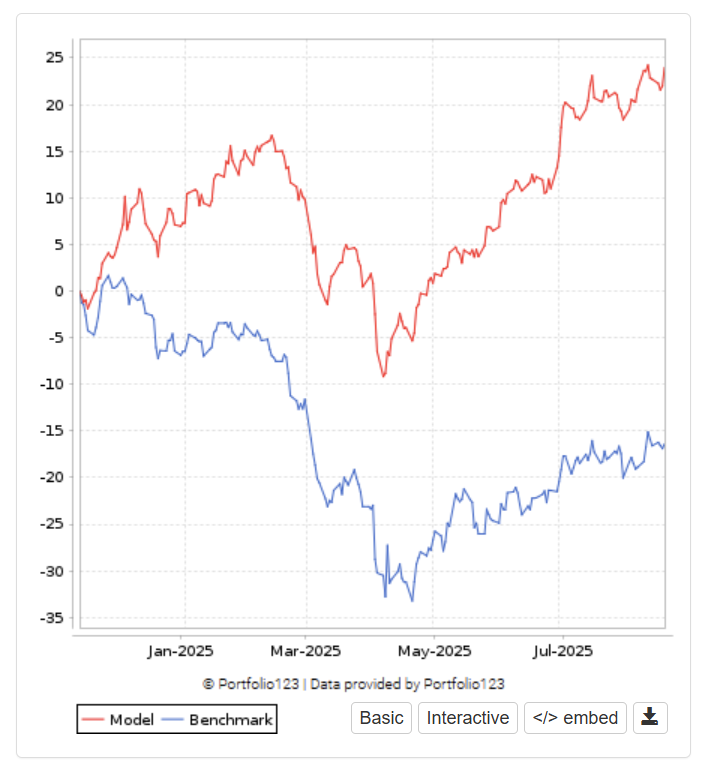
All strategies holds 30 stocks. Note that all results are in SEK, the Dollar has lost 13% against SEK so far this year and it contributed heavily to the large draw down.
In addition to these 3 live strategies I have been paper trading an army of AI strategies (which I have spent less time on construction) with different approaches to to get a better understaning of the behaviour. I would say that they have on average performed on par with my traditional live none AI strategies but with higher volatility. My main focus when working with AI strategies now is to find ways to lower the volatility.
The best paper traded live strategy I have in my army of AI strategies used Sortino as target.
5 Likes
I dedicated some time to do research some months ago and I reached similar results to my traditional research with worst turnaround. With traditional research, at least, I can understand the process with AI is more opaque (black box). But I think that in the end this AI will beat traditional one (just for now I need more hours of research, learning from other users...etc)
2 Likes
That is impressive! How did you get turnover so low? My ML models often seem to have close to 2,000% for the top baskets when using 50 or 100 quantiles.
1 Like
I haven't done direct empirical research on this, but my intuition is that you might achieve it in a couple of ways, e.g.,:
- Reduce number of factors that changes often, such as: short term momentum, sentiment, PYQ fundamentals (use TTM instead).
- Use different target such as Sortino or longer term future return (e.g., 1 year).
3 Likes
I really want to know some thoughts on that. Any suggestions @judgetrade @yuvaltaylor @AlgoMan ?. I will appreciate that.
As Pimaster advises, remove/replace features that would typically increase the turnover in your traditional portfolio, especially if you have a target that is short.
Don't go wild with your hyperparameters. I find "lightgbm III" to be a good base; don't divert too much from it and add some regularization.
Remove/replace features with a high number of NAs.
Remove highly correlating features (keep the best ones), and find features with high multicollinearity.
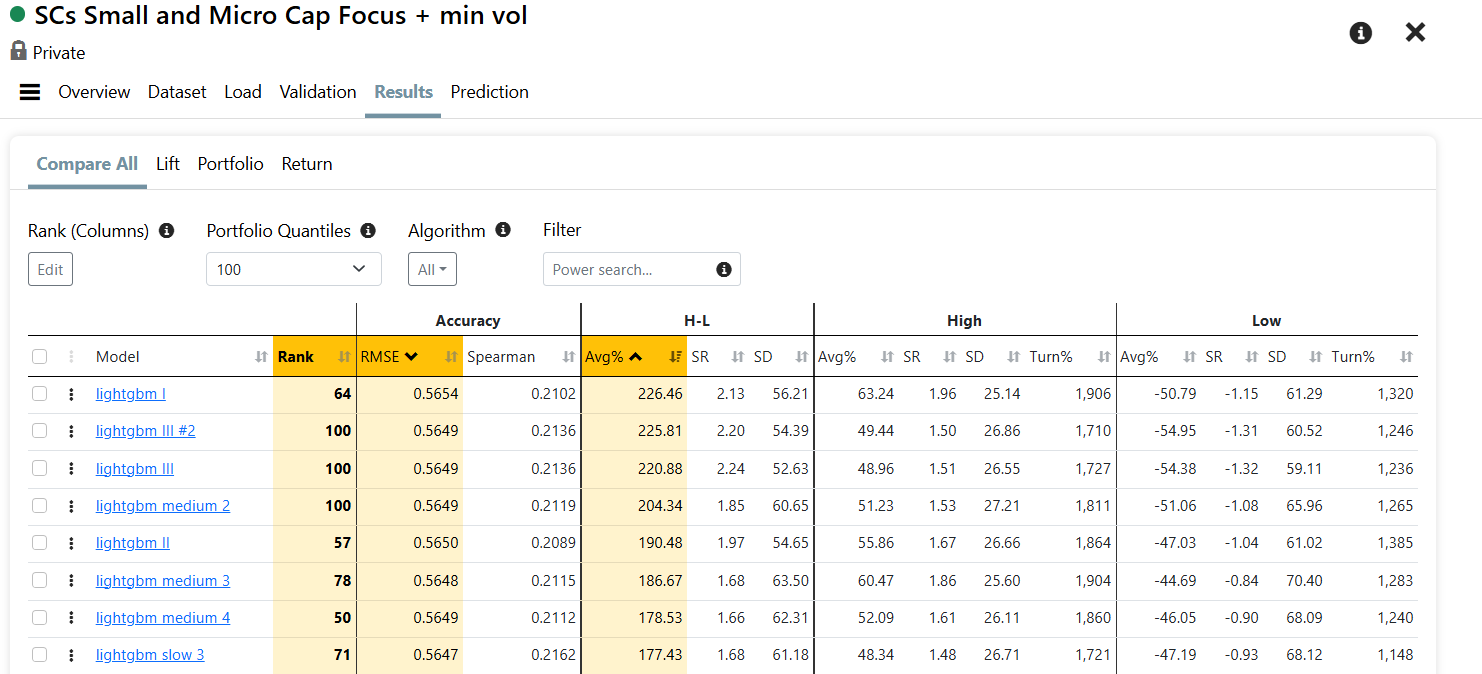
The last 3 weeks I have played around with the little Python program I made. I find it very helpful to remove features—
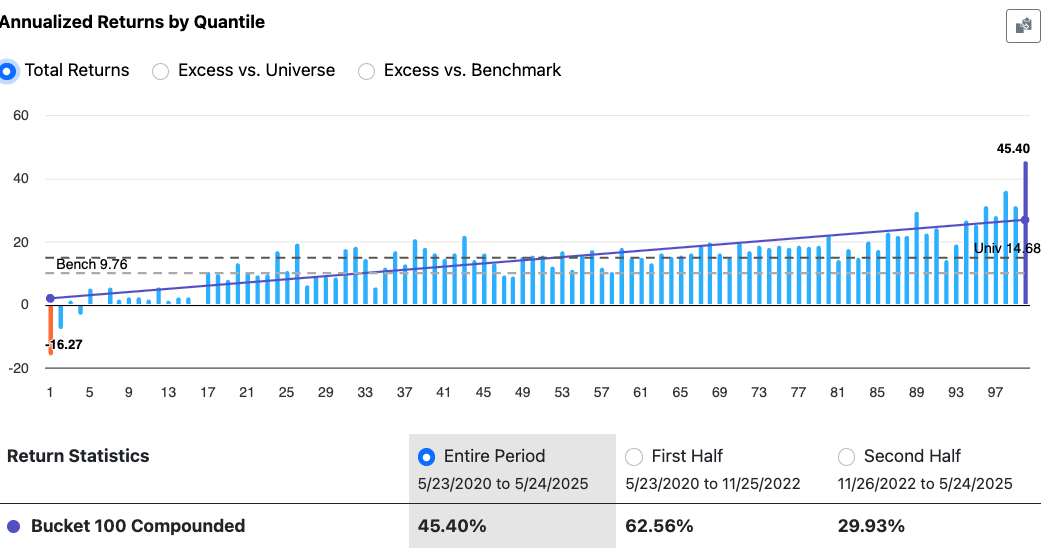
For fun, I started with 300 features; the top 10% bucket gave 60% with extremely high turnover. When I scaled it down to the "best" 20 features, the top 10% bucket gave 55% with a very low turnover. So with that little research project, I have a very good base of features to build from with low turnover.
3 Likes
- Turnover:
My AI Factor Models also have very high turnover.
BUT --> the key is than to train the predictor from for example from 2003 - 2020, then you can put the predictor in a ranking system and use it for a 5 year backtest in a portfolio strategy (you can also do this with the validation predictor for longer tests).
You then give more room, e.g. use for example a sell rule of Rank < 90 (I use < 80). My result is --> turnover around 200-300% a year.
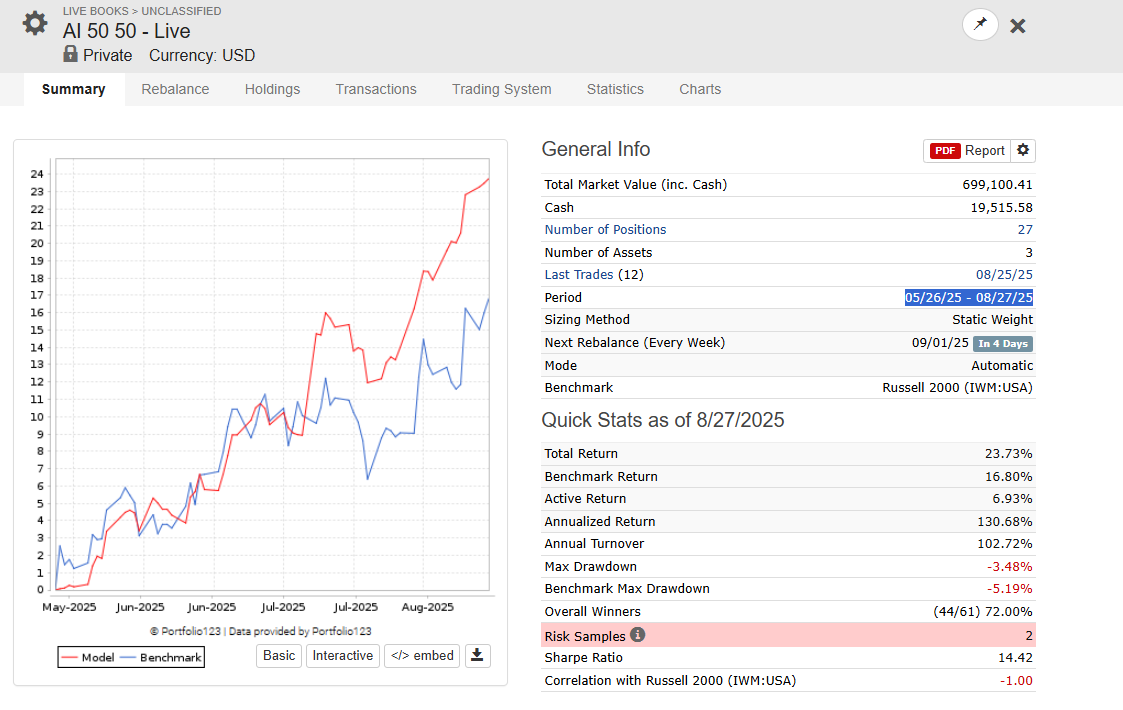
- Use of AI Factor Strategies
I use AI Factor Strategies for my personal account --> (unhedged version, my results are lower, since I am long 70% / short 30% via a short on IWM). What you see is 100% OOS Live Trading trading
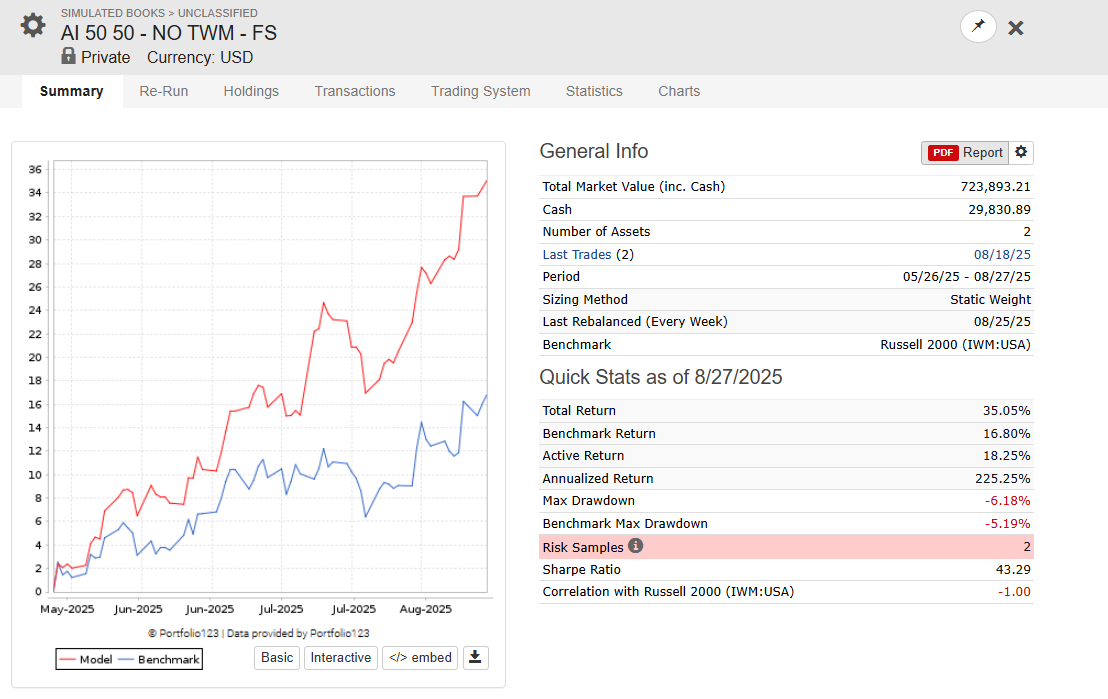
Hedged (with a 15% Position of TWM)
- AI Factor Small Cap Index:
13 Small cap AI Factor based systems, 100 - 125 Stocks (What you see is OOS Live)
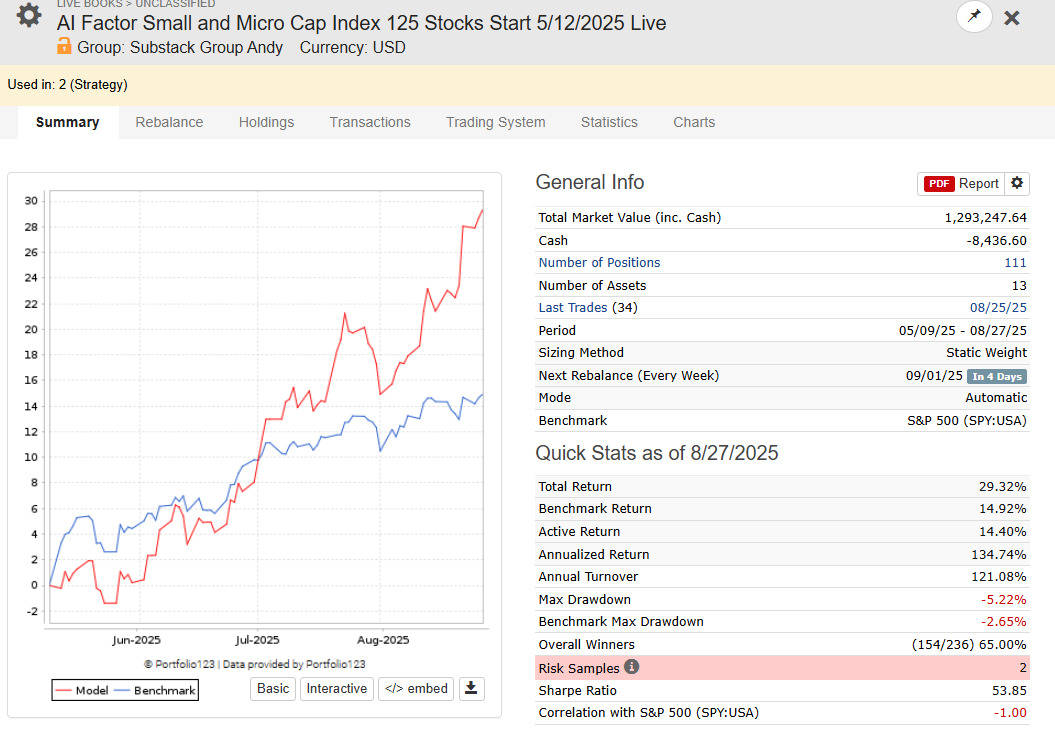
Built it to attract allocators, 2 allocators are interested (not sure yet!)
- Designer Models
will publish some soon
- Teaser AI Model on X (pined to my profile!)
All in all --> Transition from traditional ranking systems to AI Factor ranking systems took me a while, but I am glad I invested the time and effort.
Next projects --> get allocators on the model + a shorter term swing trading system (half discreationary) based on AI Factor picks.
Lets see, but I am happy Marco told to have a look at AI Factor :-)))
Best Regards
Andreas
3 Likes
This is the approach I take as well. While you can get turnover down by using only longer term features and targets, limiting rebalance frequency, using specific hyperparams on certain models that discourage turnover, etc. I've found these things tend to hurt returns more than if you just allow the model to have high turnover and then drop it down with rank based sell rules.
4 Likes
It's not a bad approach. I have noticed when trading stragetgies with none linear AI ranks live, that it's not unusual that stocks goes from the 90% percentil down to sub 10% rank after a report. So the really really bad stocks will be pushed out of the rank sell rule, always.
2 Likes
I’ve found that while the performance difference between various models isn’t always large, the models often select different stocks. That means if you need more names—for liquidity, diversification, sector balance, or other goals—an AI model may belong in a book regardless of whether it outperforms your existing models.
3 Likes
I've noticed a weird phenomenon that surprised me a few times now.
In the AI Factor interface I'd validate models rolling, and then do the test up to 2019.
Sometimes great results:
Now I go to train the model up to 2020 and backtest it:
Results drop quite a bit
However if I try to replicate the dashboard better and train only to 2019, much closer to the dashboard:
Backtests are identical simulations otherwise.
I'm rather surprised that 1 extra year alters the predictors output so much and concerns me that despite a good rolling test, etc. it's not actually very stable. This was with LightGBM - but I've seen similar with non-boosted models like RandomForest.
I'm not sure the solution. Maybe for live trading take a rolling 5-year combo (like train up to 2025, 2024, 2023, 2022, 2021?)
I know 2020 was a weird year, but not sure how to deal with this or if I should be concerned that it shows lack of robustness.
What is you minimum child size
"min_child_samples": 70
It is likely learning to seek or avoid some outliers from 2020 would be the guess. You could try a mean absolute error instead of mean squared error regression or add more years in general. Child size being small is a common cause but that does not seem low. The added year is a significant amount of new data
3 Likes
If you only compare the performance test of the AI Ranking systems the last 5 years instead of doing a strategy simulation. How big is the difference between the two ranking systems?
1 Like
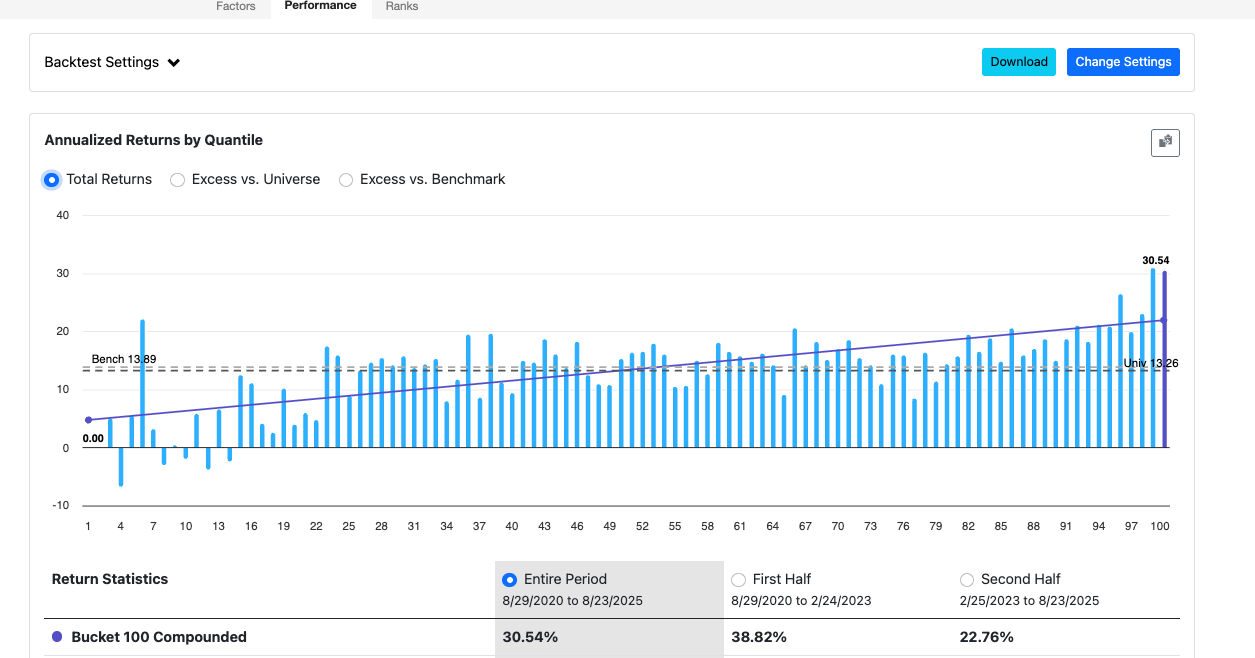
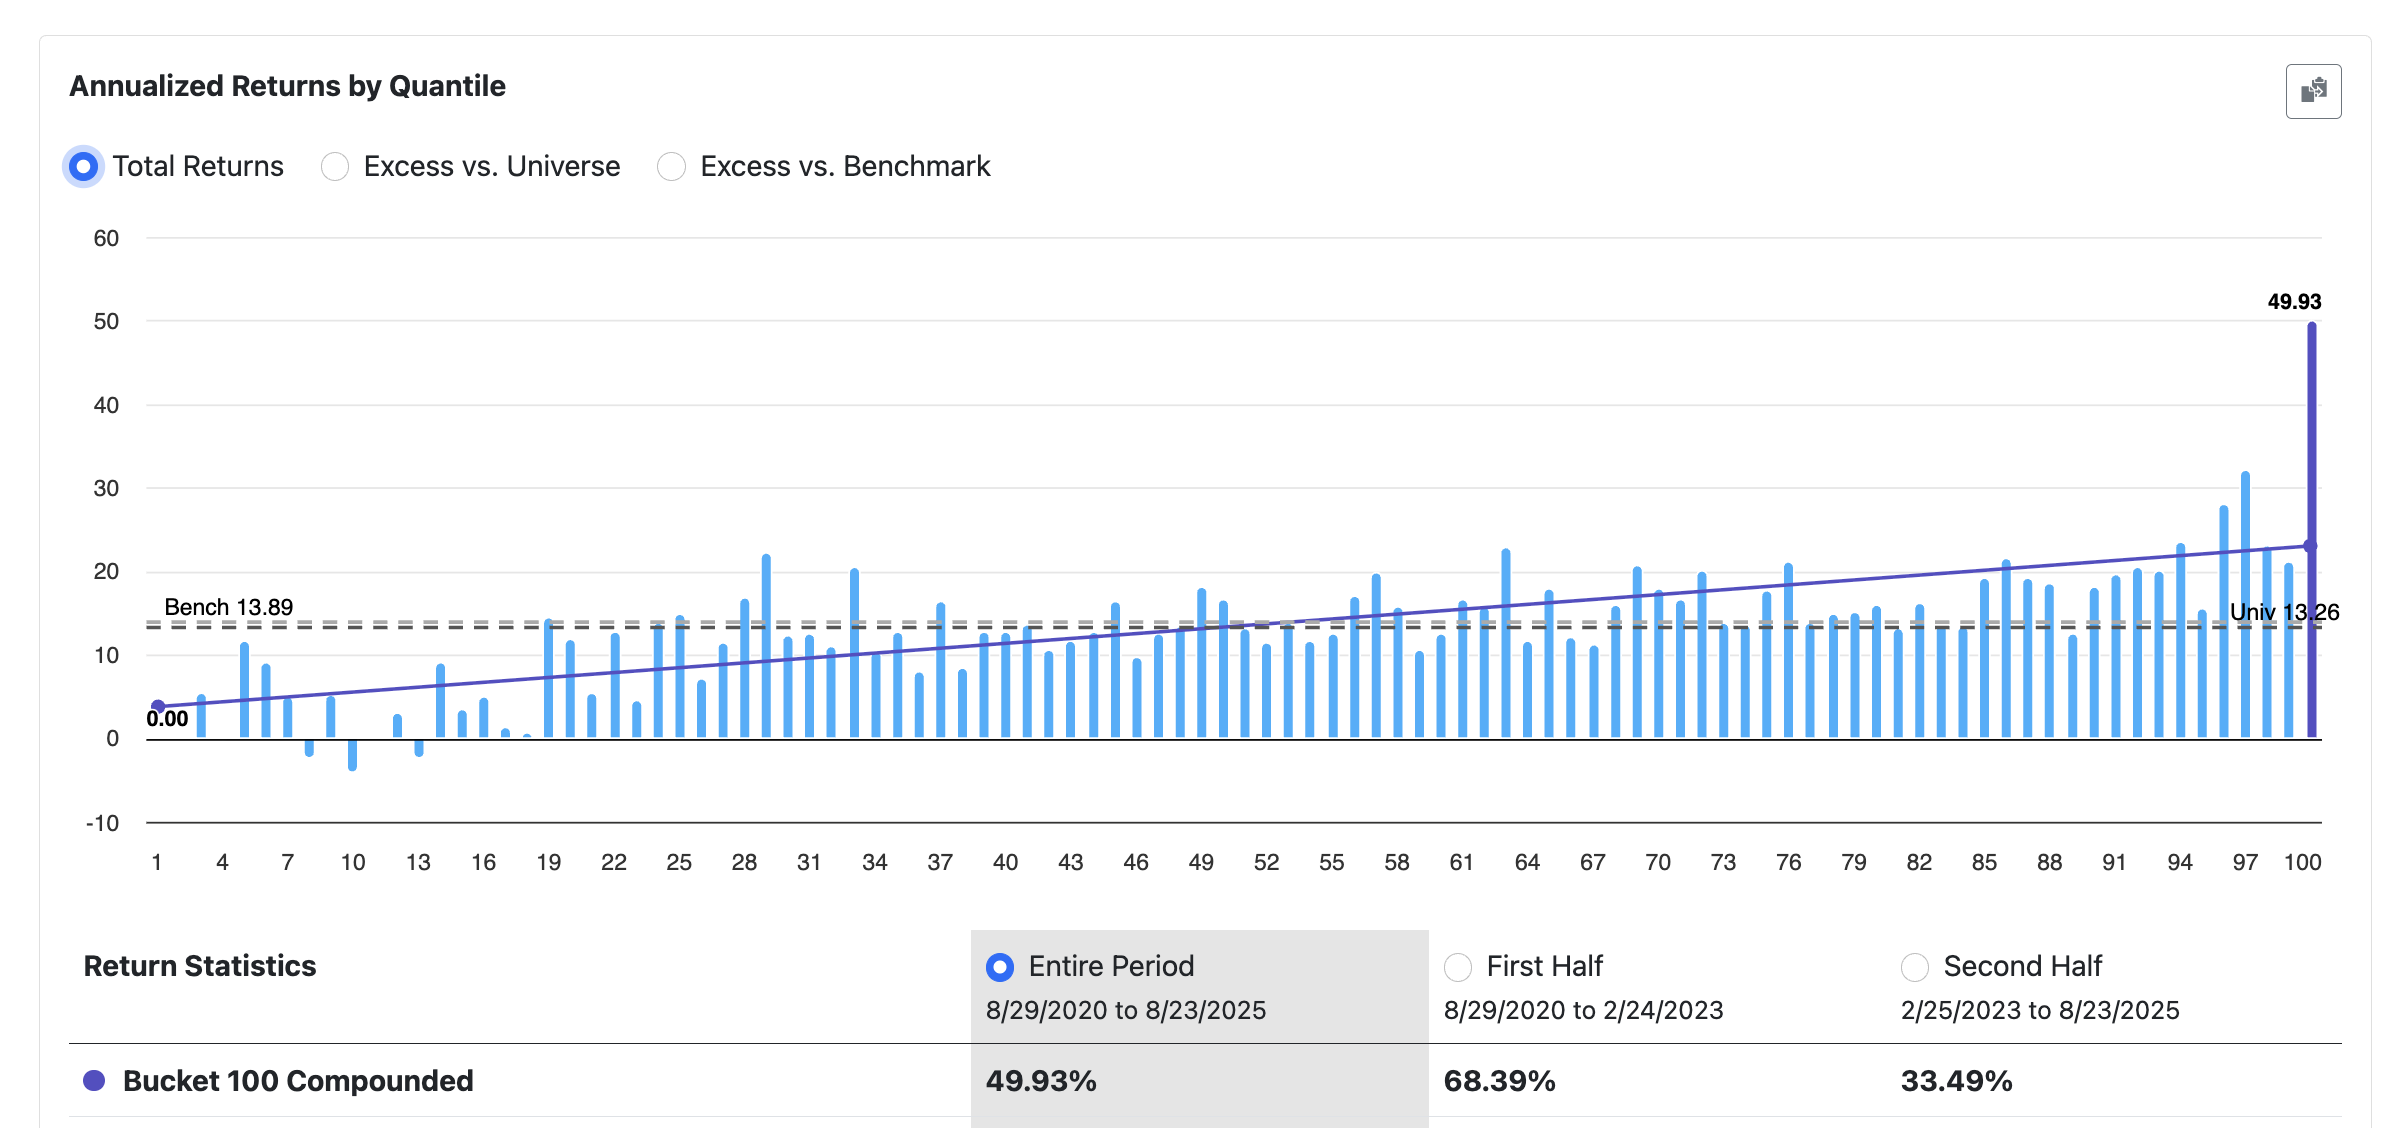
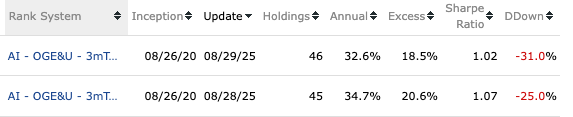
Top is 2020, bottom is 2019.
If I open up the rankings to be much more lenient - holding the top 50 and selling Rank < 80 (per judgetrade) the performance gap closes up.
I am curious about SZ's outlier idea for 2020! Would you just test by tighter normalization or bringing Max Return down lower?
1 Like
Basically mean squared error regression squares the errors so picking an extreme outlier loss for example is a gigantic penalty. Mean absolute error works more like a median in practice so the outliers in the “bucket”/split wont completely dictate the split. Of course sometimes you do want the outliers to dictate things so it is a robustness vs catch outliers tradeoff. You could try a max/min or log on your target too
2 Likes