I’m excited to share a Beta version of a project I’ve been developing: AlgoMan’s Quant Toolkit (v2.3.0).
The Background
This tool started as a personal effort to solve a recurring problem in my quantitative research: it was incredibly difficult to get a holistic overview of data before training machine learning models. I found myself constantly jumping between different Python scripts to test various feature engineering and selection techniques. Over time, I consolidated these into a single, unified analysis engine designed specifically for those working with tree-based algorithms.
Why Feature Analysis & Selection Matters
In machine learning, more data isn't always better. Redundant features, unstable temporal data, and "future-leakage" can lead to models that look great in backtests but fail immediately in live trading. This toolkit is designed to help identify these "poison" features before they ever hit the training set.
Key Capabilities
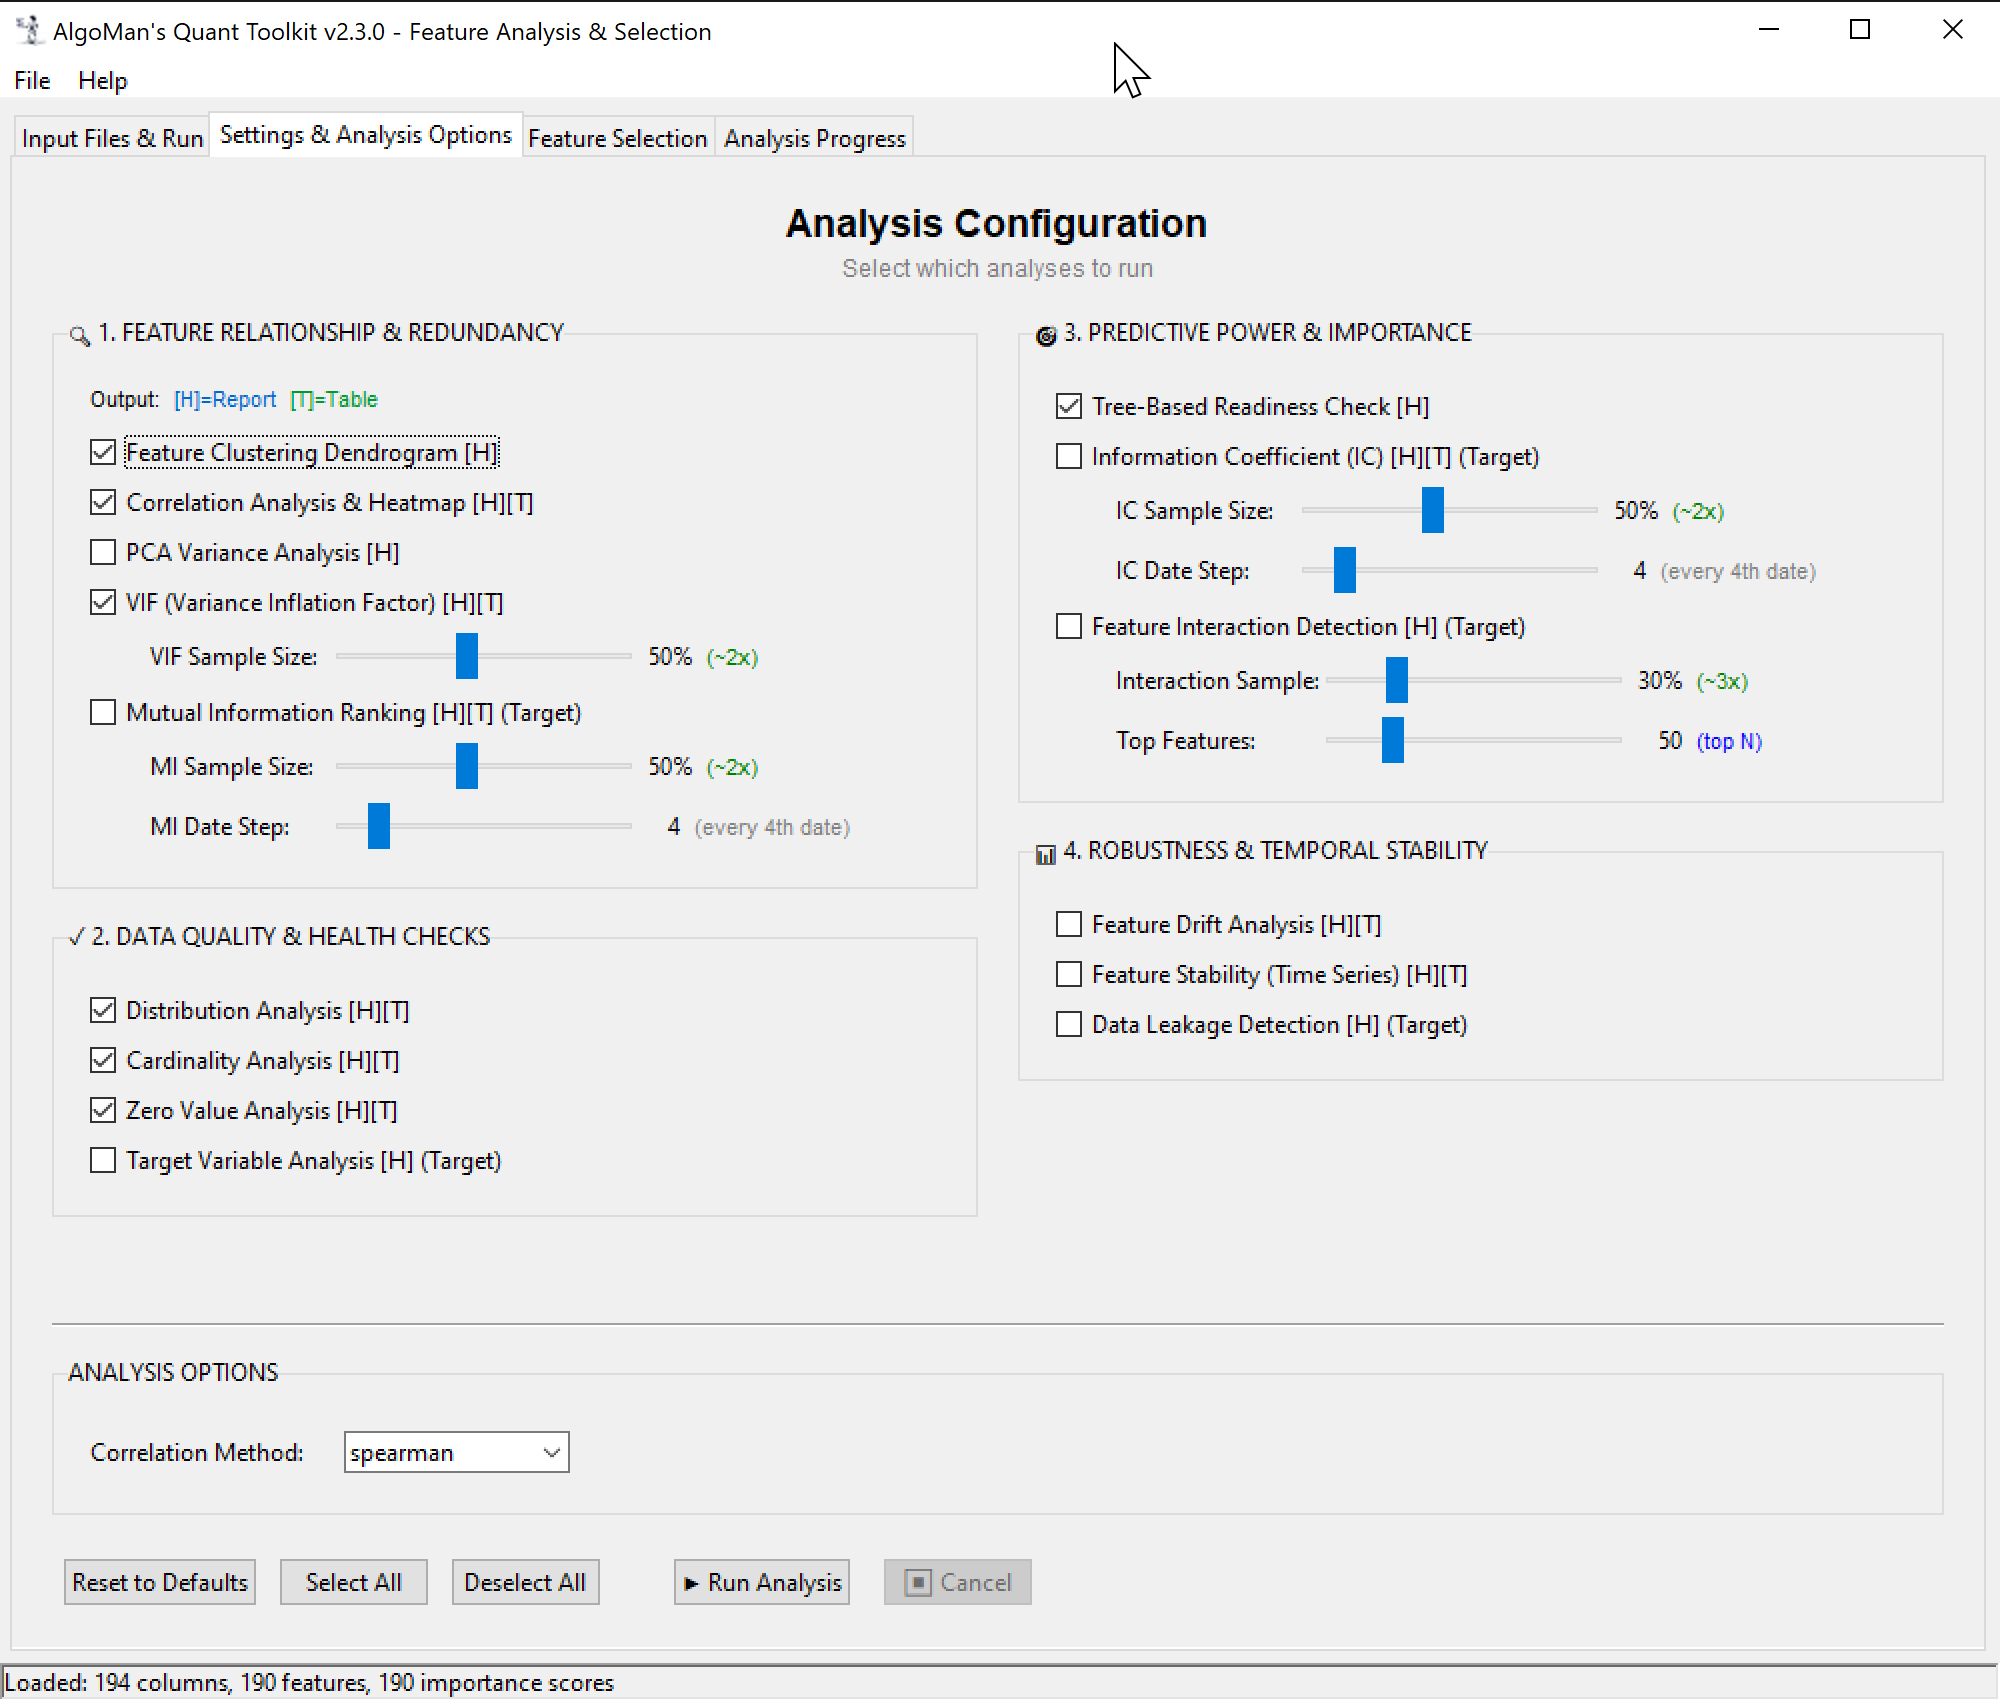
The software provides a comprehensive suite of 15+ metrics to evaluate your features:
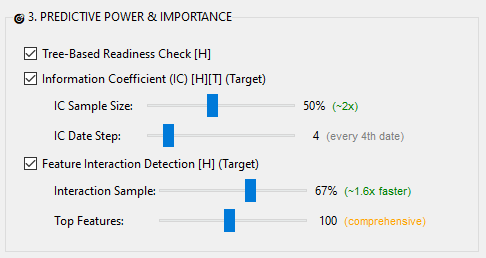
Predictive Power: Information Coefficient (IC) analysis, Mutual Information, and tree-based importance checks.
Robustness & Stability: Time-series drift analysis (Mean_CV), stability checks, and automated data leakage detection.
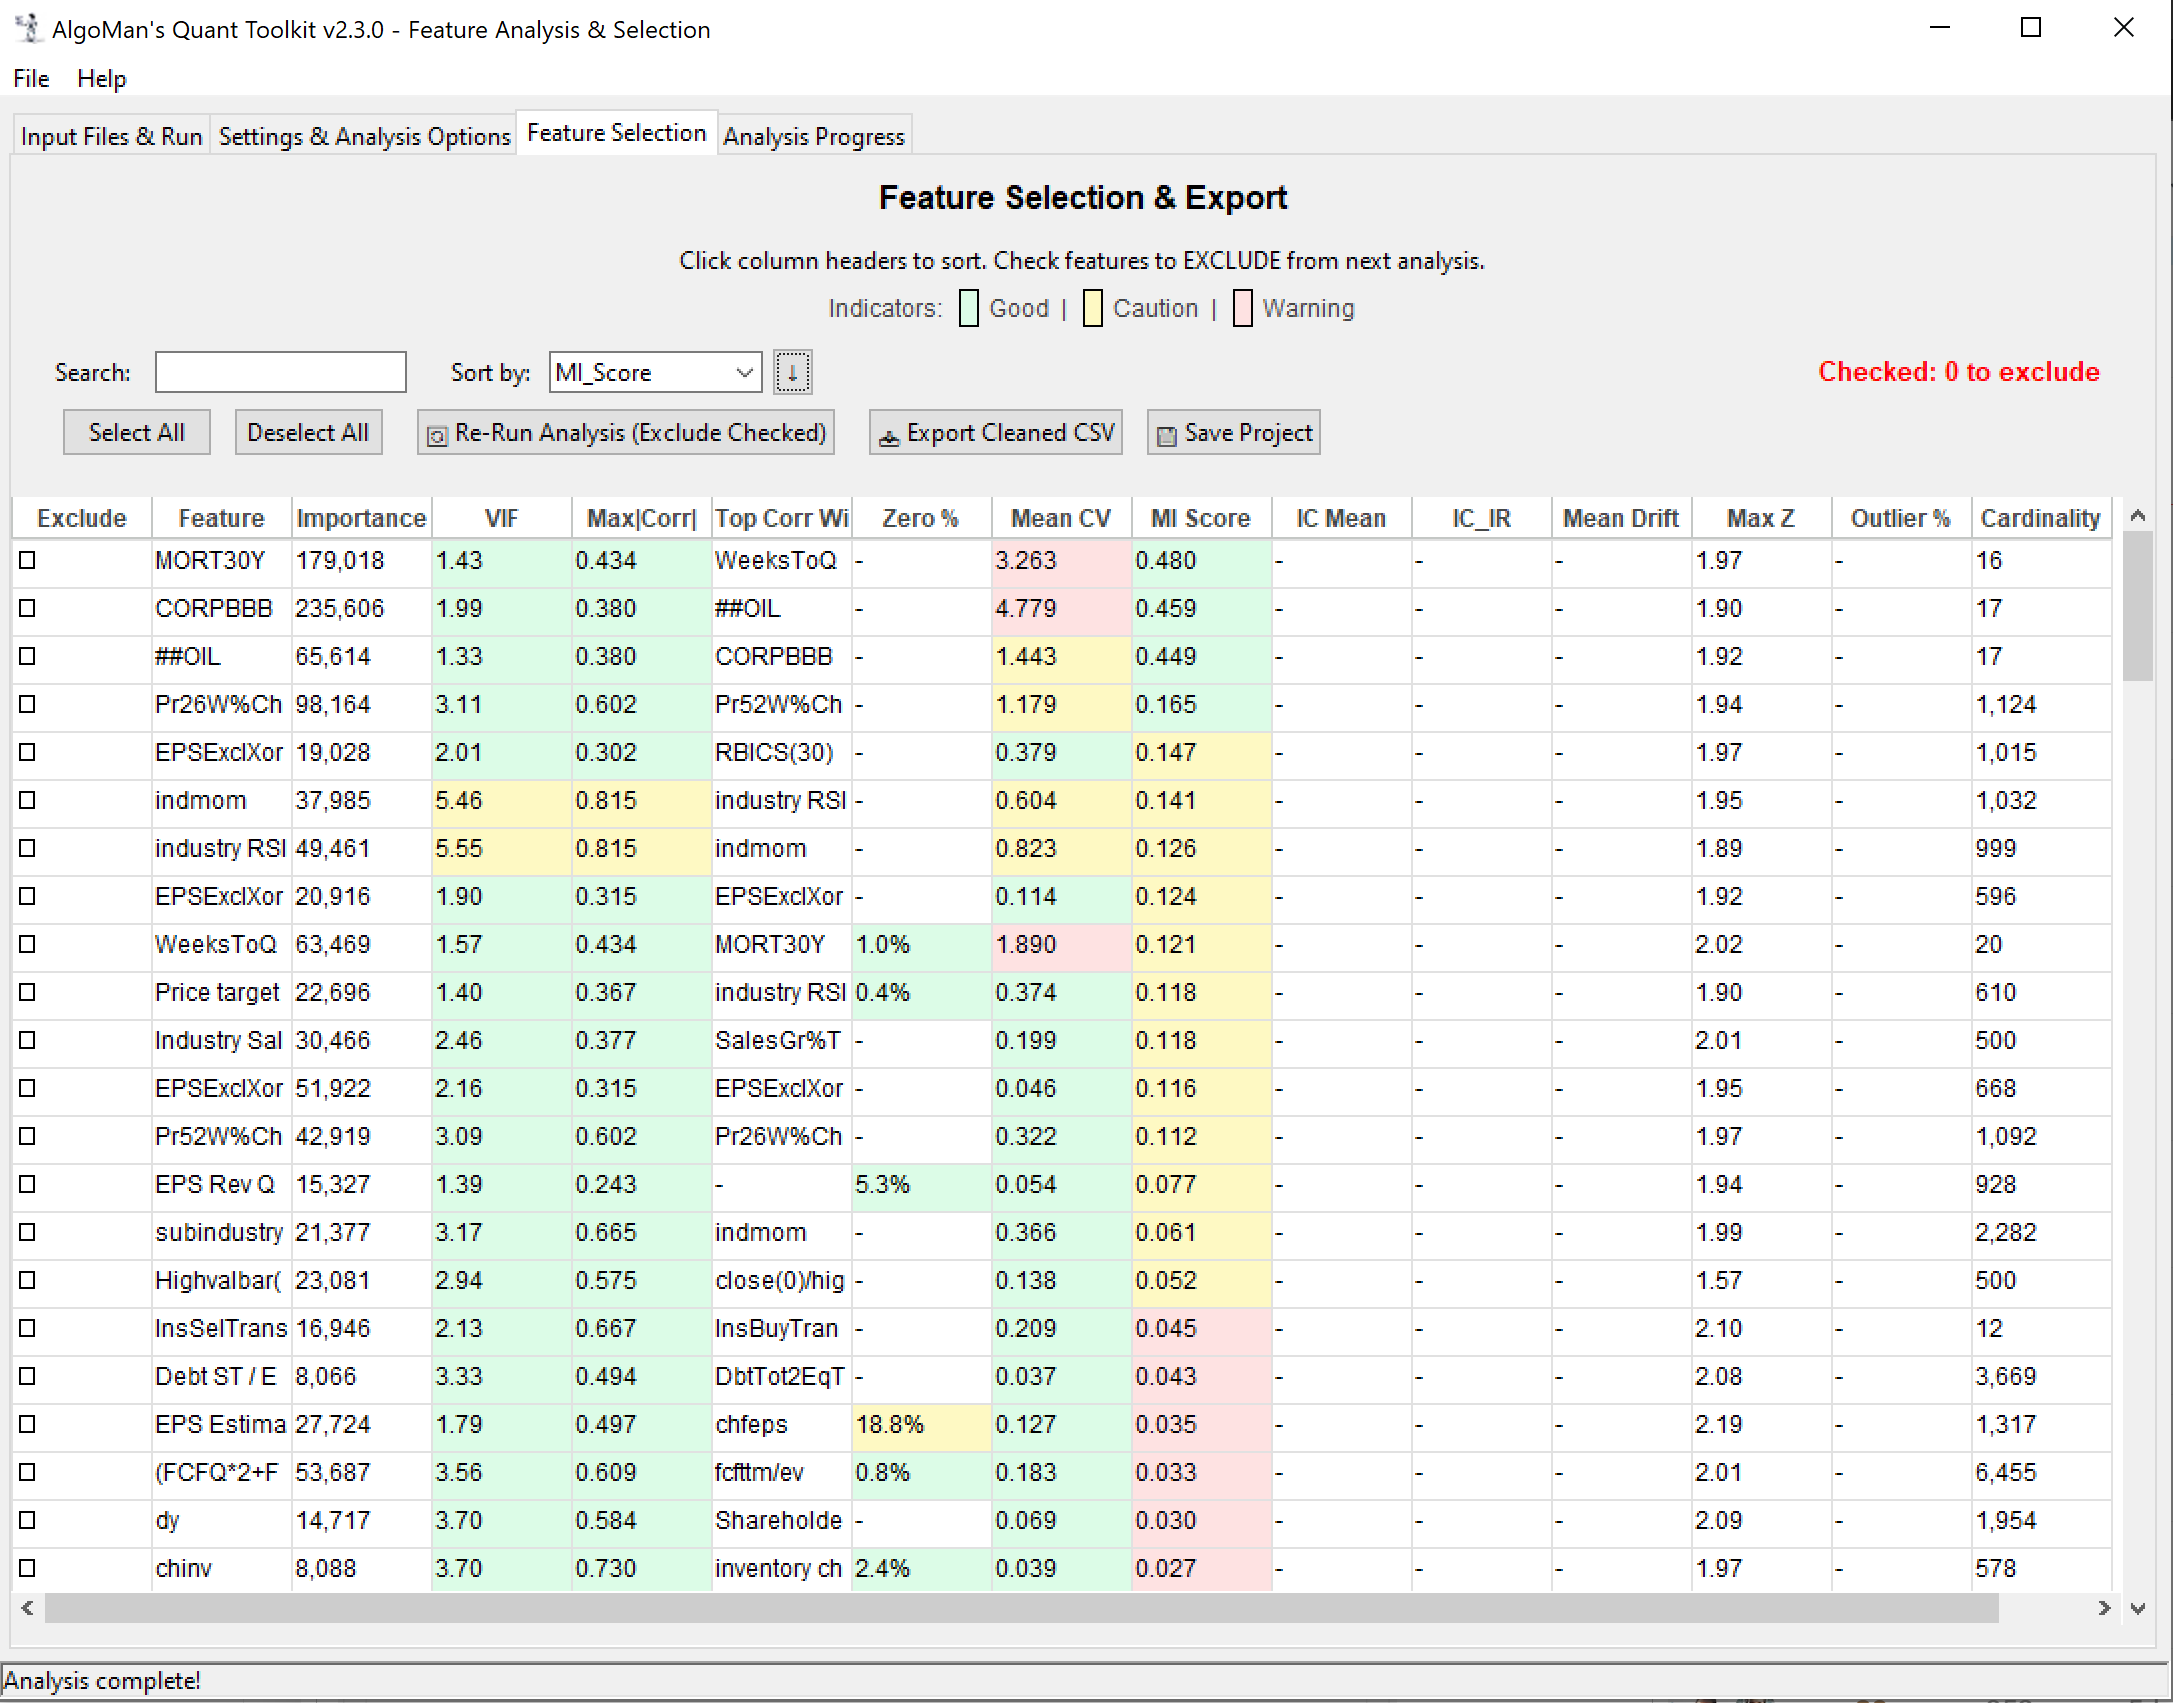
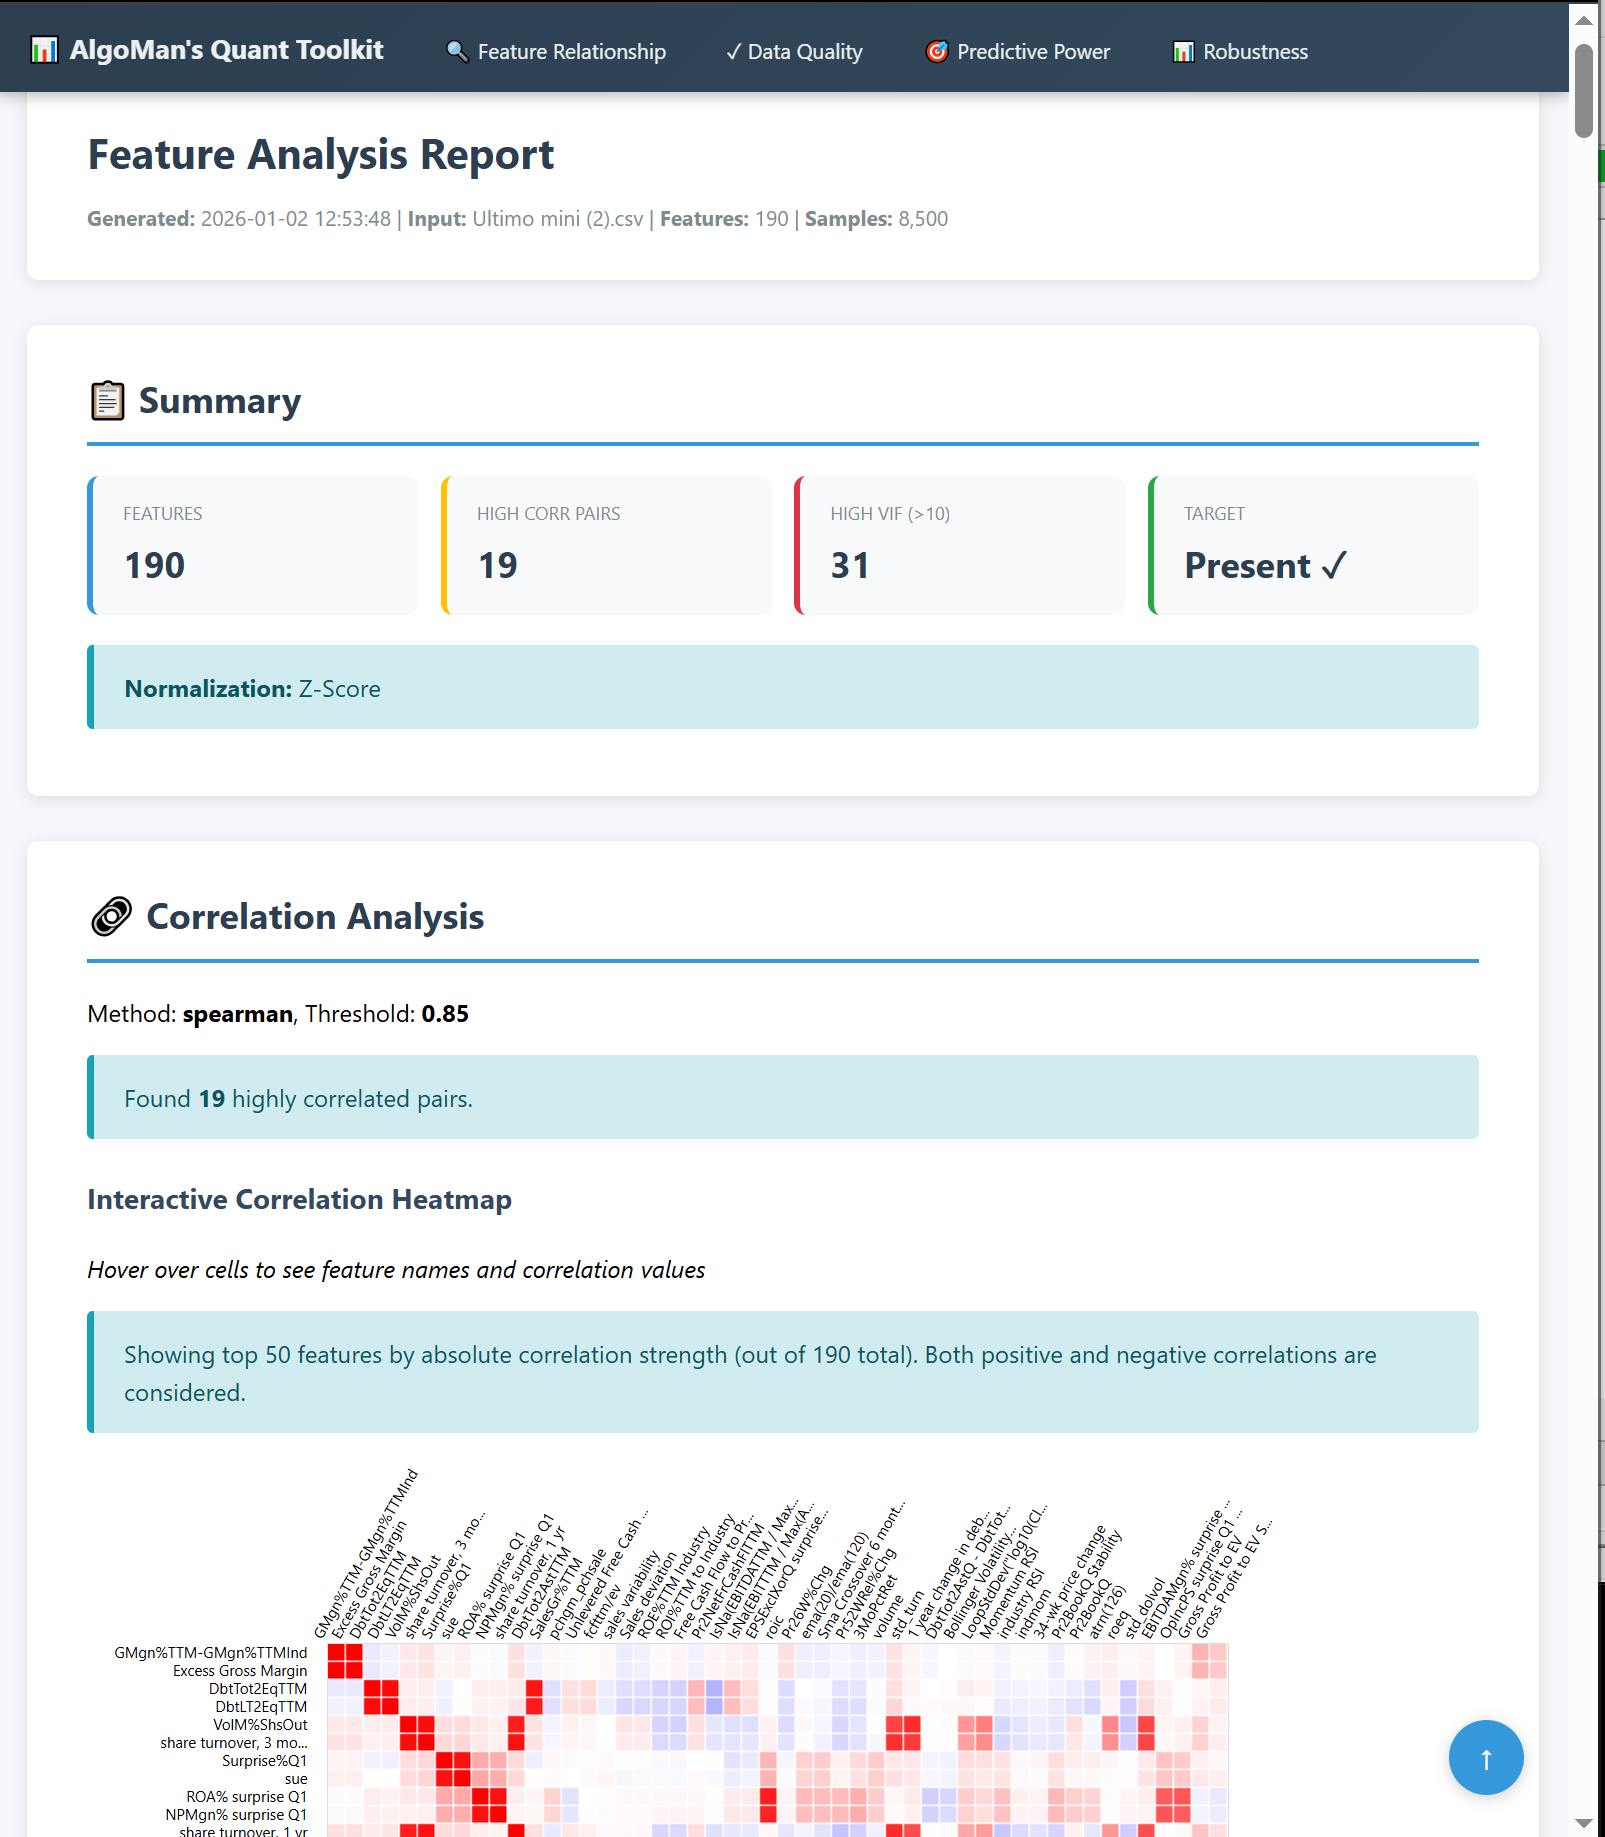
Reporting: Generates a unified, interactive HTML analysis report with navigation and shape-coded indicators. Most importantly one table with all the most important analysis result to get an overview and isolate the “poison” from entering your training model.
Save/Load projects: After finalizing an analysis, you can save the project and revisit it at a later stage without the need to re-do any analysis.
The "Secret Sauce": Rapid Iteration
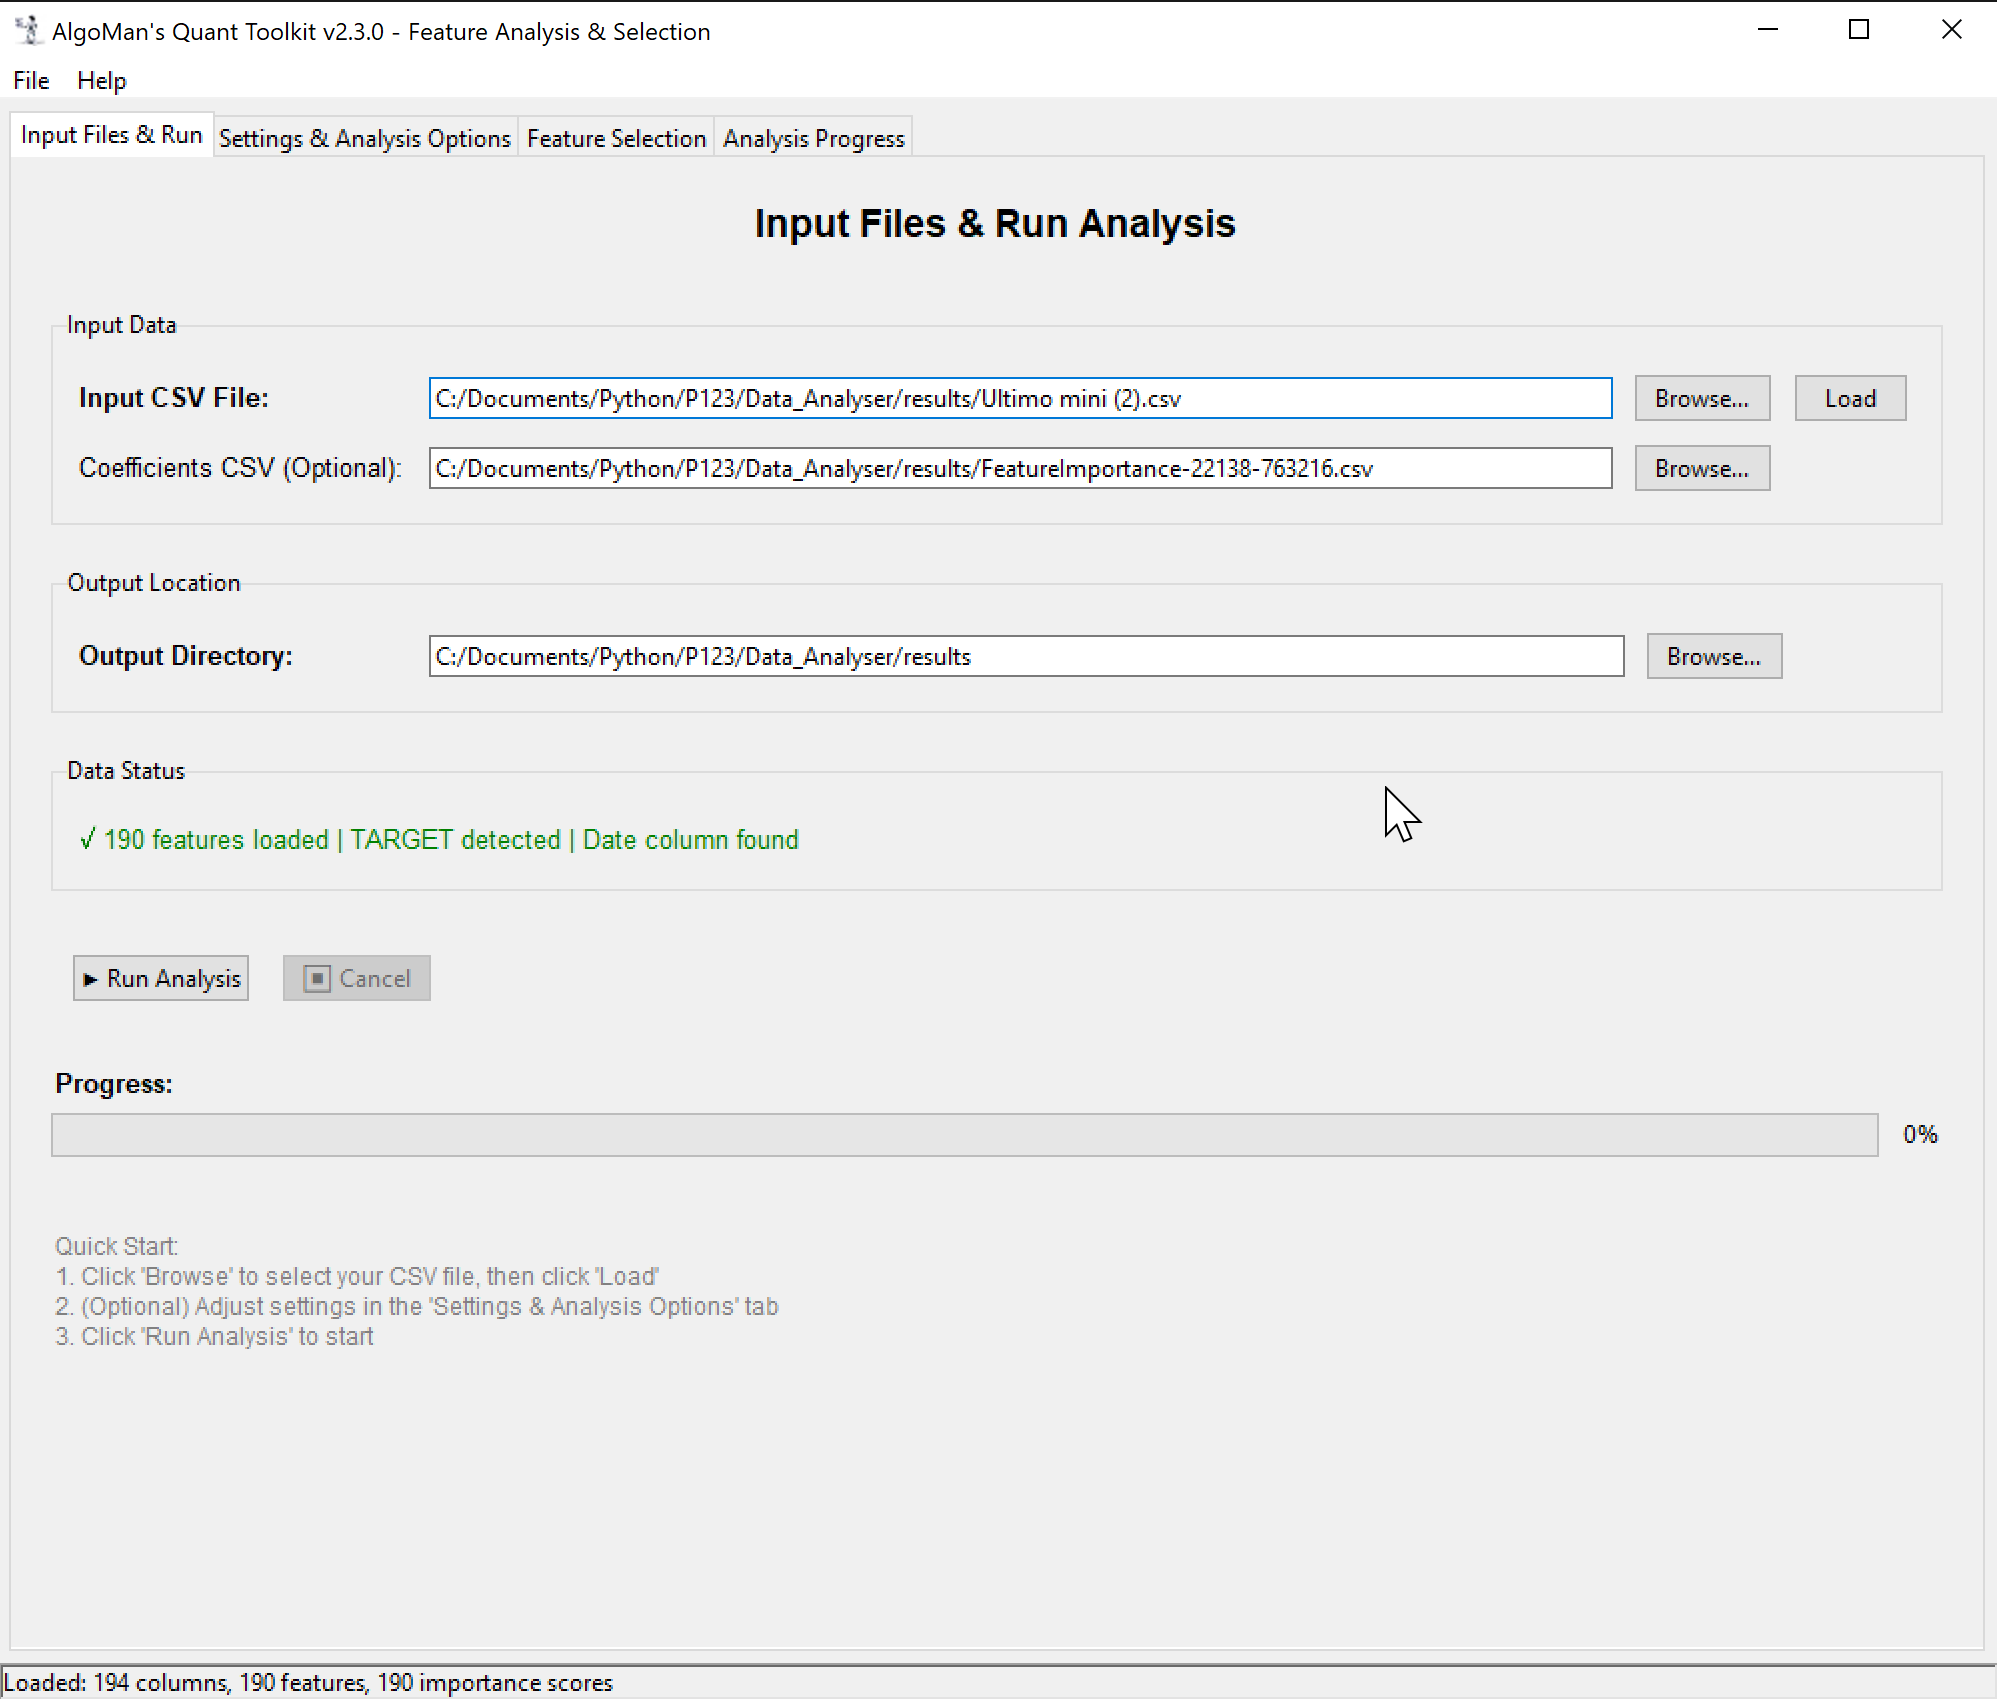
The feature I personally find most useful—and the biggest time-saver—is the ability to exclude features and redo analysis on the fly. If you’re a Portfolio123 user, you know how much time is spent downloading and formatting new datasets and spending API credit. With this toolkit, you load your master dataset once. If the analysis shows that three features are 99% correlated or unstable, you simply de-select them in the GUI and re-run the analysis instantly. No need to go back to P123 for a new download until you’ve finalized your feature set.
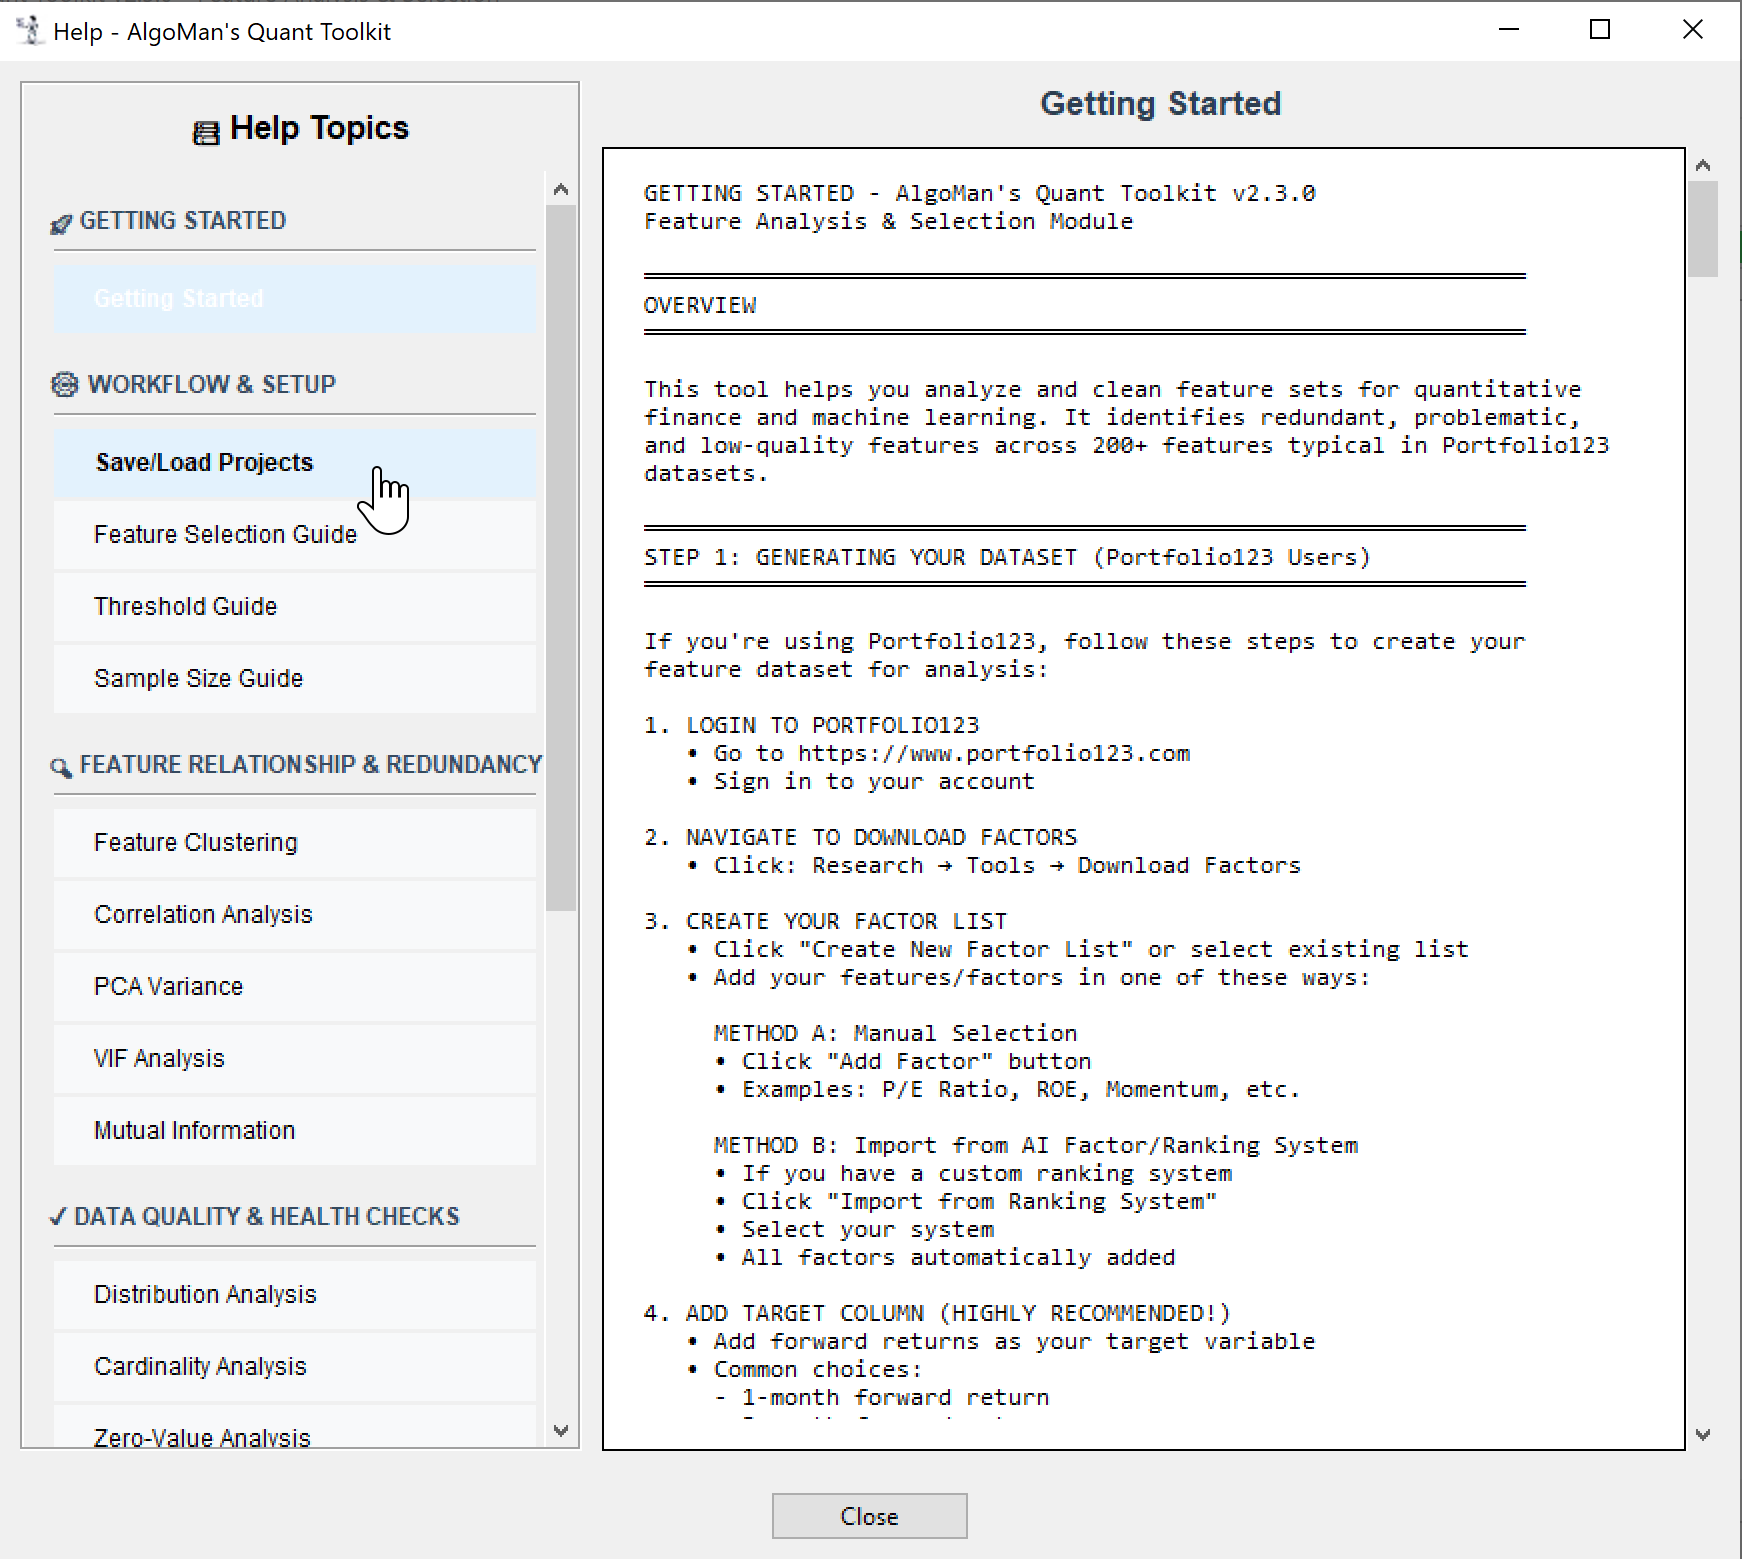
Built-in 100-Page "Pre-Training Guidebook"
In the process building this tool I have slowly built a massive Help System directly into the app. It’s essentially a 100-page guidebook on quantitative feature analysis. It doesn't just tell you what a button does; it tells you why the math matters for your P&L. It covers:
Interpreting Clusters: How to use dendrogram heights to prune redundant "Sibling" features.
Non-Linear Edges: Using Mutual Information to find relationships that standard correlation misses.
Drift vs. Regime: Understanding when a feature is decaying versus when a market regime has simply shifted.
Leakage Warnings: How to spot "future-data" before it ruins your model.
Before asking questions, please take a peak at the Help section—there is a high probability your answer is already in there.
Beta Testing Details
Expiry: This Beta version is fully functional until January 14, 2026. I haven't decided on the roadmap after that date, so I'm looking for as much feedback as possible now.
Feedback: I haven't had the time to test every single tool in this current format, so all feedback is good feedback. I’m specifically looking for:
What is good, bad, or missing?
Is any of the reporting misleading?
Most importantly: Did using this tool actually improve your final model results?
Oh man, thank you so much for sharing this. I’m a follower of yours on X, and yesterday I saw your posts about this tool, which inspired me to vibe-code at least a pathetic imitation of it for myself
This is by far the best “New Year’s gift”!
I’ll definitely write some feedback after I’ve had time to use it. Thanks again a lot!
I converted the entire help document into a single long document so that I can put everything into the AI model for questions, etc., should anyone need it.
Thanks for building the tool and offering a beta version of it. I have the same fundamental issue - how to clean up the feature set for AI modelling. It’s challenging to do. I’m hopeful your tool can streamline the process.
The only feedback I have so far is the colums in the Feature Selection tab are not expandable, and only a few characters long. I have many similarly named features so it’s hard to discern exactly which feature is referred to on a given row. I’ve tapped into the exported .csv file to determine which features to exclude, but then figuring out where those features are in your Feature Selection tab is challenging. Maybe make the column widths expandable.
Have a few rough thoughts here. I think the idea of the software is extremely smart. I was testing it and it definitely identifies several areas of factor reduction that can be done effectively. The primary challenge however is that even in highly correlated feature spaces, features add IC at higher depths within tree models but at a lower depth have low IC. Especially in the gradient boosting universe IC usually is some what misleading compared to ablation studies or observing the tree itself. My other thought is that the feature selection here focuses on signal strength without considering the quintile or decile impact. For example, a low IC feature in the lower 9 quintiles can become predictive in the top decile. Overall, I really like the idea and think this is much more systematic compared to naive feature selection.
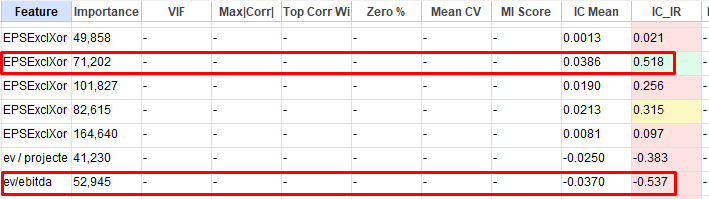
Think of this as another essential tool in the kit. I find the Information Coefficient (IC) particularly interesting; factors with a high IC (strong individual predictive power) typically translate into high Importance Factors in your ML models. They often form the core 'trunk' of your tree structure.
However, there’s a second class of features—like share turnover, market cap, or volatility—that often show very low IC scores on their own. While they lack standalone predictive power, they frequently become core factors by acting as catalysts (interaction terms) for other features. Identifying these 'catalysts' before training is notoriously difficult, and I haven't yet found a perfect analytical method to isolate them—though this tool's Mutual Information and Feature Interaction modules are my current best attempt at spotting them.
I just saw a perfect example and got reminded of @pitmaster post mentioning the “kill switch”. Just ran an analysis where an industry momentum factor got very low IC score, but a good MI score. So it’s very likely that if I use that industry momentum factor in my training it will not sit in core trunk, but rather out on the branches as a “kill switch”.
I rely on ablation studies quite a bit. However, they take a lot of time and are computationally expensive, since they require retraining the model for each ablation.
I get the impression—at least for my own work—that I haven’t used Permutation feature importance enough, especially as a screening tool.
Do you (or others, including VSai23) have any experience with this method?
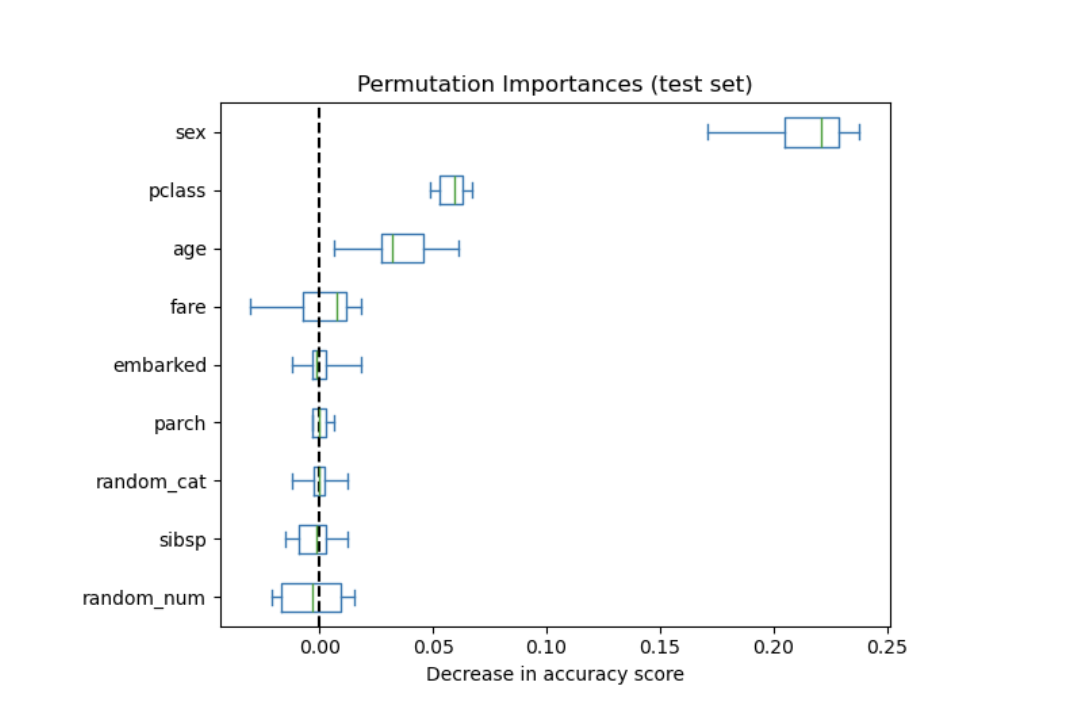
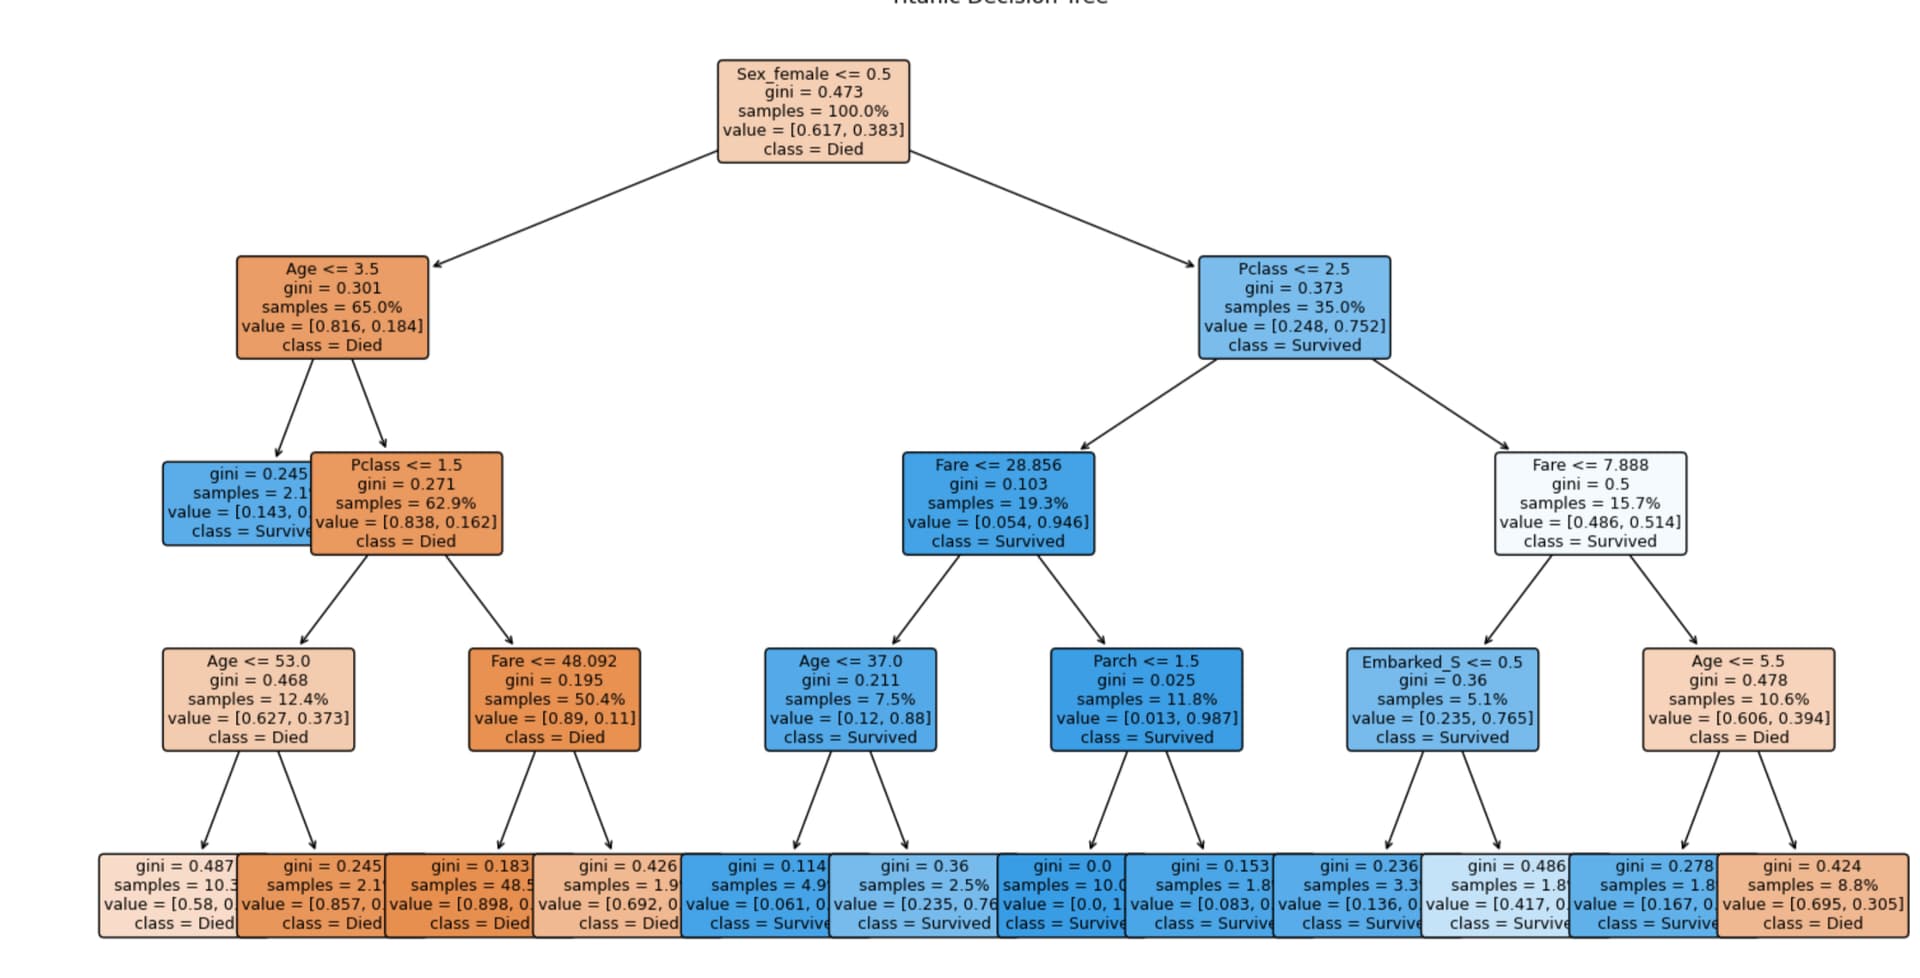
By coincidence, scikit-learn discusses permutation feature importance using the Titanic dataset, and I had just posted a simple decision tree on that same dataset. I don’t know how much to read into it—it’s obviously a very simple example—but since I already had the tree screenshot handy, I added it.
Permutation importance by Sklearn for a tree model (random forest classifier):
Is that essentially the same as a PINT (Permutation Interaction) Test? I’ve been exploring that for a specific use case.
In my models, I’ve noticed that macro indicators tend to command very high feature importance. My concern is regime shift: I want to run a PINT test specifically on those macro indicators to ensure the model isn't over-relying on them in a way that would cause it to 'implode' if the market stops behaving as it has historically.
As you mentioned with ablation studies, the computational cost is the main hurdle. However, running a permutation-based test on only a small subset of features (like just the macro indicators) makes it significantly more manageable without sacrificing the depth of the analysis.
Hi! Great software — thank you! I was really excited when I saw the feature interaction capability, because that was exactly my first idea after I wrote a Python script that calculates the correlation between the target variable and each individual feature.
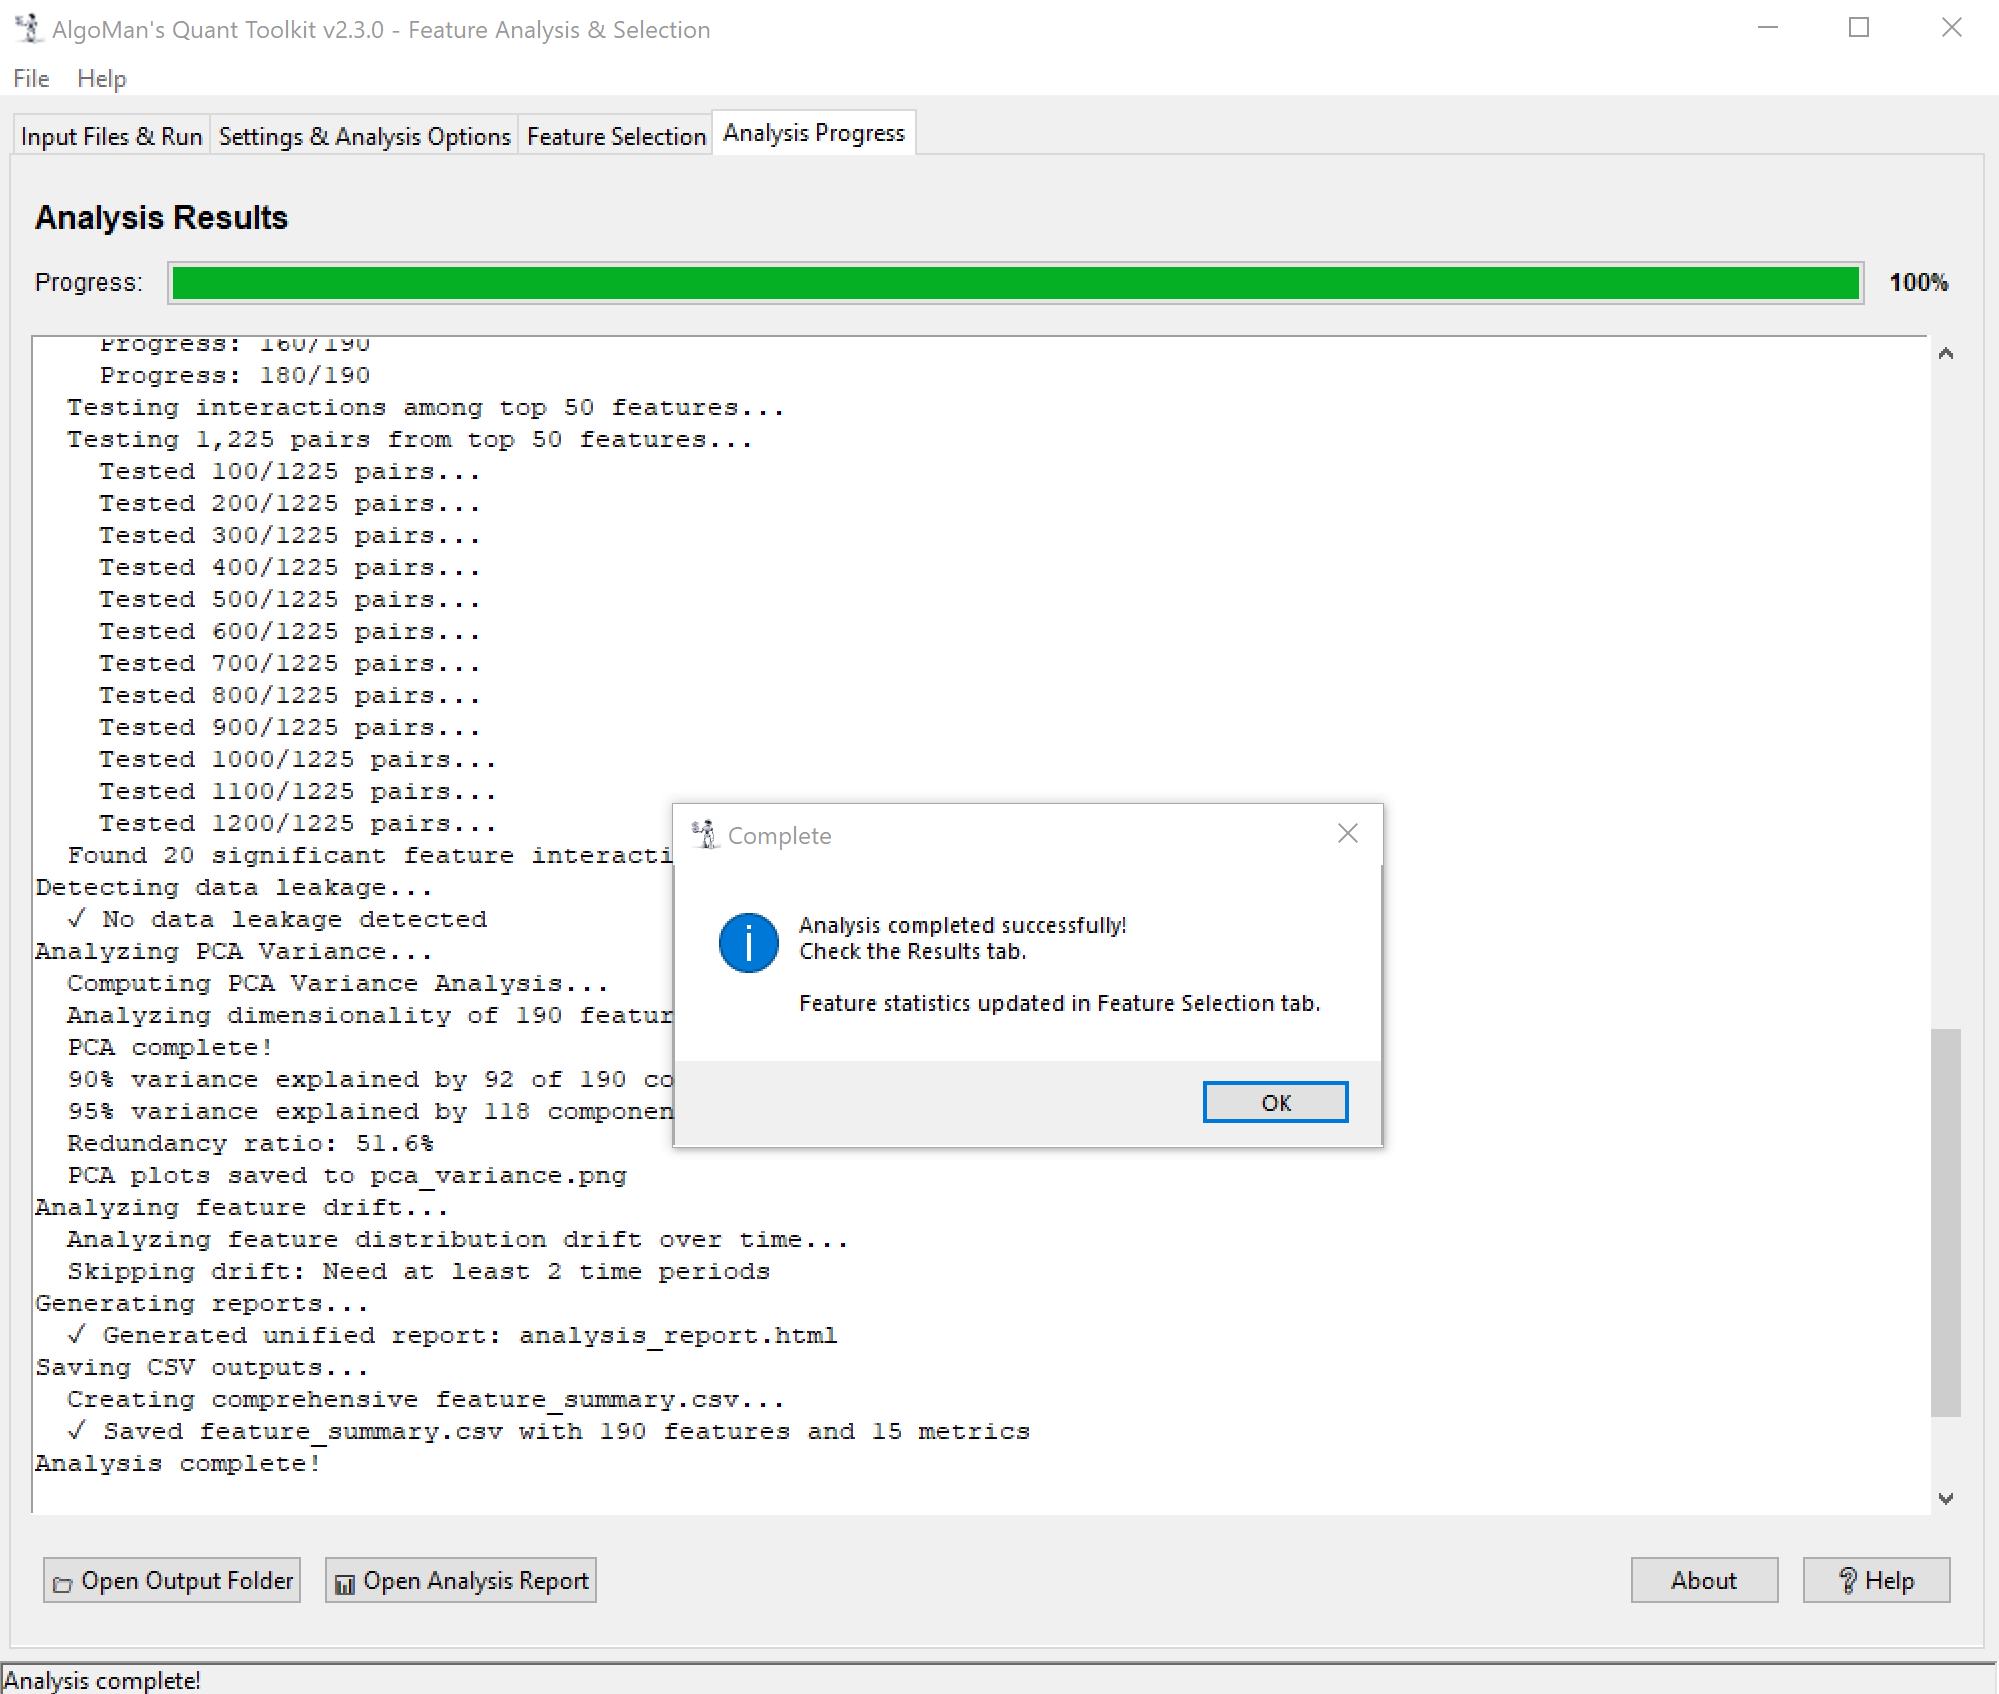
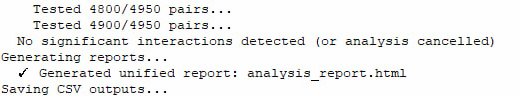
However, I don’t quite understand where I’m supposed to see the results. I enable “feature interaction detection [H] (Target)”, the computation runs for a long time (several hours), but I don’t see any output — neither in the report nor in the Excel files inside the report folder. Could you please let me know what I might be doing wrong and where I should look for the results?
One more thing: in the Feature Selection tab, the IC_IR column highlights strongly negative values in red — for example Volatility (-0.723) or SharesGr% (-0.589). As I understand it, these simply have a negative correlation with the target and arguably should be “green,” since the coloring should reflect closeness to zero in absolute value. This could be a bit confusing for some users, unless I’m misunderstanding something.
Thanks again for the great utility — I think you’ve introduced quite a few excellent ideas that could inspire future feature engineering tools in P123.
Update: Sorry, I didn’t notice the message in the progress window right away. I’ll try to figure out the cause on my own using the Help section.
Yes, you are correct. Should probably just use the absolute value for the coloring and update the help section.
Just saw something in your table there that I want to highlight. EV/EBITA and EBITA/EV will give you very different results, especially if your normalized data is trimmed. If EBITA is close to 0, EV/EBITA will be in the outer end of the distribution (trimmed away), while in EBITA/EV it will be in the middle of the distribution (not trimmed away).
In general, I try to stick with Yields for a more normal distribution, multiples tend to explode when the denominator is close to 0.
Thanks again for your findings. I updated the coloring formula to use absolute values for IC_IR, which should be clearer now.
I investigated the Feature Interaction issue. There was nothing wrong with the code, but the interaction improvement threshold for presenting results was too conservative, so none of your interactions were strong enough to pass the limit. I have removed the limit completely, so you will always get results. I also added a heatmap of interactions, which gives a much better picture of which features interact well with other features. In addition, I made some adjustments to speed up the analysis. I added "Date Step" for this analysis, same as IC and MI use, and for the same reasons. The random forest algorithm was using n_jobs=1; I changed it to -1, so now all CPU cores will be used for the analysis.
A new version is uploaded, same download link as before.