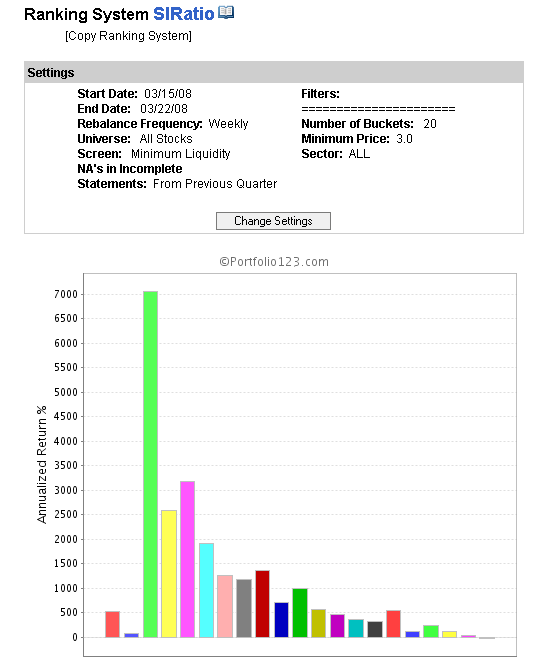
It looks like the “up” action last week was a short covering rally, take a look at the way a simple rank of “short interest ratio” performed over the last week, stocks with the highest SI ratio performed best, and socks with hardly any SI didn’t perform at all!
If this might explain if you had screwey behaviour over the last week.
Also, would be interested in hearing opinions on what this means for the broader market. We could either interpret it one of two ways:
This is a “fake” rally, simply short covering with no real impetus
This represents the “smart” money taking off their bearish bets, implying good things are to come
I am not sure that it is a continuation of what we have already seen, there has been no net outperformance of underperformance of high short interest funds since the credit crunch started last July… This “short interest” effect really has only occured during the last week. I really think this is some sort of “signal”, but I am not sure how to interpret it!!! I think a lot of smart money may be impressed with the Fed action (extending loan facilities to investment banks). This could be bullish.
Or it could be money being pulled. As you say, there has been something of a correction in commodities. But I think that had to be expected at some point, commodities had definately become rather overbought. It actually then raises the question of how commodities could continue to rise if there was “deleveriging” going on. Very confusing.
Hi,[quote]
re. 1) This is a “fake” rally, simply short covering with no real impetus
[/quote]
My 2 cents is that if the big money believed in this rally they would be buying, not just covering their shorts. For all the talk in the media this week about possibly turning the corner the market action doesn’t seem so impressive. That said the prior low has held (so far) and that has set up a bullish momentum divergence, similar to July 2006.
It will be interesting to see the market action this week. Some of the World Markets are open now and they are mostly down - not a good sign.
I am going to stick my neck out and say I think we have seen the bottom. They are never completely obvious at the time, so the fact that it still seems a bit dicey is ok by me.
But I do believe all the ingredients are in place:
-High VIX
-high pessimism
-everyone knows about the “recession”
-the gap between T-bond rates and earnings yields
-double bottom over the past 2 weeks: twice briefly dipping below 1300 and then recovering.
-about 20% off the highs
In addition, we now have a catalyst for change - the Fed action to allow Investment banks to borrow, and the fact they will allow some mortgage backed securities as collatoral - both major moves that could well be the effective treatment to start clearing up the credit mess.
Then of course, this interesting short covering we have seen during the last week, which I am not sure about!
Still, I have been humiliated in the past by the market, but hopefully, if everyone can document what they thought at the time, we can all later look back and try and see whether we go it right/wrong without letting hindsight interfering. (It is all too easy to use hindsight to say xyz was “obvious” at the time). That way it may be possible to learn for the future.
Perhaps though, we should have a total level of short interest available as a feature.
While I think the Fed has shown us the blueprint for the solution to the liquidity crisis, and while banks have written off 100s of Billions to wipe subprime off their books, I am still thinking that the US housing/related markets (durables, furnishings,etc…) will be a drag on the economy for some time to come. My feeling is that we have focused on the inflamed abcess (liquidity), which the Fed has figured how to treat, but that now we need to go back to examing the more chronic underlying problem (housing affordability). I think the commodities drop is related to this second issue as markets reckon the impact of a slowed US economy. So I think the short covering is reflective of the retreat of the folks who were betting that the abcess would get us, not even thinking about the chronic issue. The chronic issue is slower to unwind, harder to short, and will still drag the market… but that is just this side of the market’s (often wrong) opinion. It would be interesting, however, to see if the Short Interests were skewed to the financials…
There is only one measure of success in the markets and that is profits. I’d rather be profitable than right. It is an interesting exercise to try to predict or explain what the market is doing, but for the most part I keep my trading strategy separate.
Yes and no. There are winning trades, there are losing trades, there are good trads and there are bad trades. Winning trades are not necessarily good trades and losing trades are not necessarily bad trades.
Ultimately, if one wants to learn how to trade the market (arguably a lifetime study), then you should try and learn from your mistakes; however, some “mistakes” will be simply unavoidable because the information wasn’t available (or obvious) at the time. It is important to document what you were thinking at the time, so when you look back and ask yourself “was this a good or bad decision”, you can evaluate it on the basis of what you really knew at the time. It is all too easy to use hindsight to say “obviously the answer was xxx”: then you really learn nothing useful.
My trading decisions were all made some time ago when I developed my trading plan so what I think of the market now or what I know now, or what I “think” I know now just doesn’t have much relevance. Decisions that I make based on current market action are generally worse than those that I plan out ahead of time … so from that perspective, any trading decision I make based on current market action is a bad decision.
That single factor of short interest is REALLY interesting. The same pattern appears if you look at the week of 8/407-8/11/07. Pretty good way to see if buying in mainly short covering.
“SIRatio” Is this another possible indicator of market direction as suggested by others? To be able to use this we need a way of comparing the current ratio to past ratios. I ran a quick Sim using SIRatio / SIRatioPM < 0.5 as a buy rule and SIRatio / SIRatioPM > 1.0 as a sell rule here: Short Interest Ratio . Total return increased from 56.5% for the Benchmark to 178% by trading only on SIRatio. Hummmm……
What I would like is the ability to test: SIRatio(0) / SIRatio(xx)
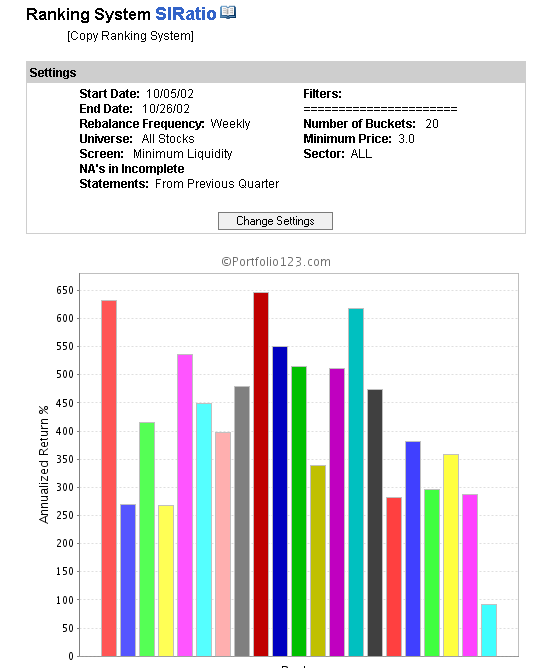
I have been doing a bit more research into this… I looked back at the 2001-03 bear market and when it reversed. Technically, it actually made the lowest point on 9th October 2002, but I think most people would agree, the end of the bear market was on 12th March 2003. So I decided to have a look at the short interest ratio facto around this time.
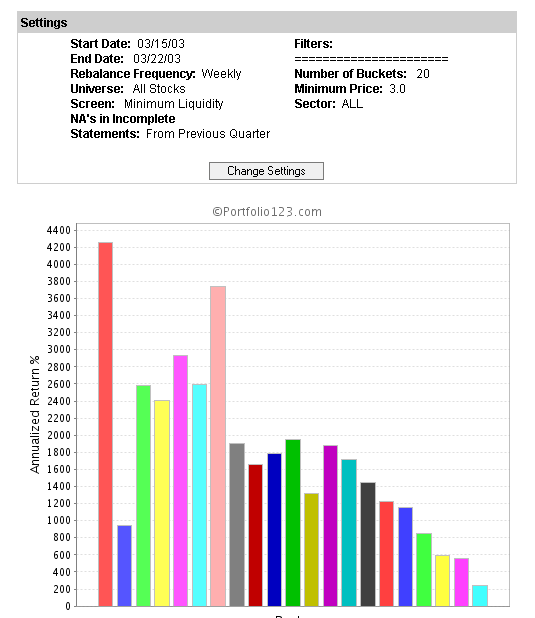
For the 2002 period, there is not much of a discernable pattern. However, just after the 2003 bottom, you can clearly see a strong pattern - stocks with a high short interest ratio rallied the most. To my mind this implies, such a short covering rally is a signal for a “true” bottom.
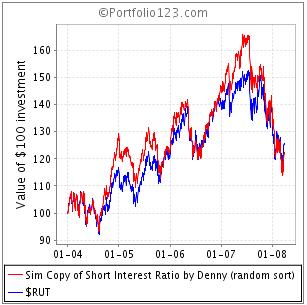
Using short interest as a buy and sell signal does appear to outperform the market IF the test period includes a major bottom followed by a huge run up as we saw in 2003. If one runs a test starting in January 2004, the using SI as a buy and sell rule just seems to match the R2000.
Hi,
Interesting discussion. My hunch was that short covering activity by itself did not signify a turning point, but the data seems to indicate otherwise. I’ll go with data over my hunches anyday.
My post with sim chart was intended to point out that using a change in SI as a buy and sell FILTER RULE has not worked for over three years beginning in January 2004.
I should have made it clear that my caution did not apply to using SI as a RANKING FACTOR. Your sim shows that SI has obvious ranking power.
This makes sense to me. If you accept the theory that higher SI are usually predictive of lower stocks returns because well informed investors are shorting them aggressively, then rapid covering by (presumably) the same investors indicates a reversal. The fact that SI report is delayed works to our advantage, because the high SI marks the stocks that should be monitored by the indicator. If the SI report wasn’t delayed, the analysis should look at SI for the previous month.
I would also exclude healthcare stocks and very high SI ratios from the analysis.
Can you rephrase that question? Its not obvious what you mean.
However, I would say this, virtually all ranking systems that I use contain short interest as a factor in the ranking system, but this does not translate into a specific logical buy rule. In fact, I believe factors like short interest specifically belong in a ranking system rather than a binary rule, because the effectiveness is a more logically fuzzy “less is better” than a specific cut-off point.