We kind of skip over it, but linear models come with the assumption of homoskedasticity.That might be okay — we make a lot of simplifying assumptions for financial data at P123. We have to and I understand that. But we shouldn’t forget what those assumptions are either.
We also assume linearity with linear regressions, which makes perfect sense. Its in the name of the model after all.
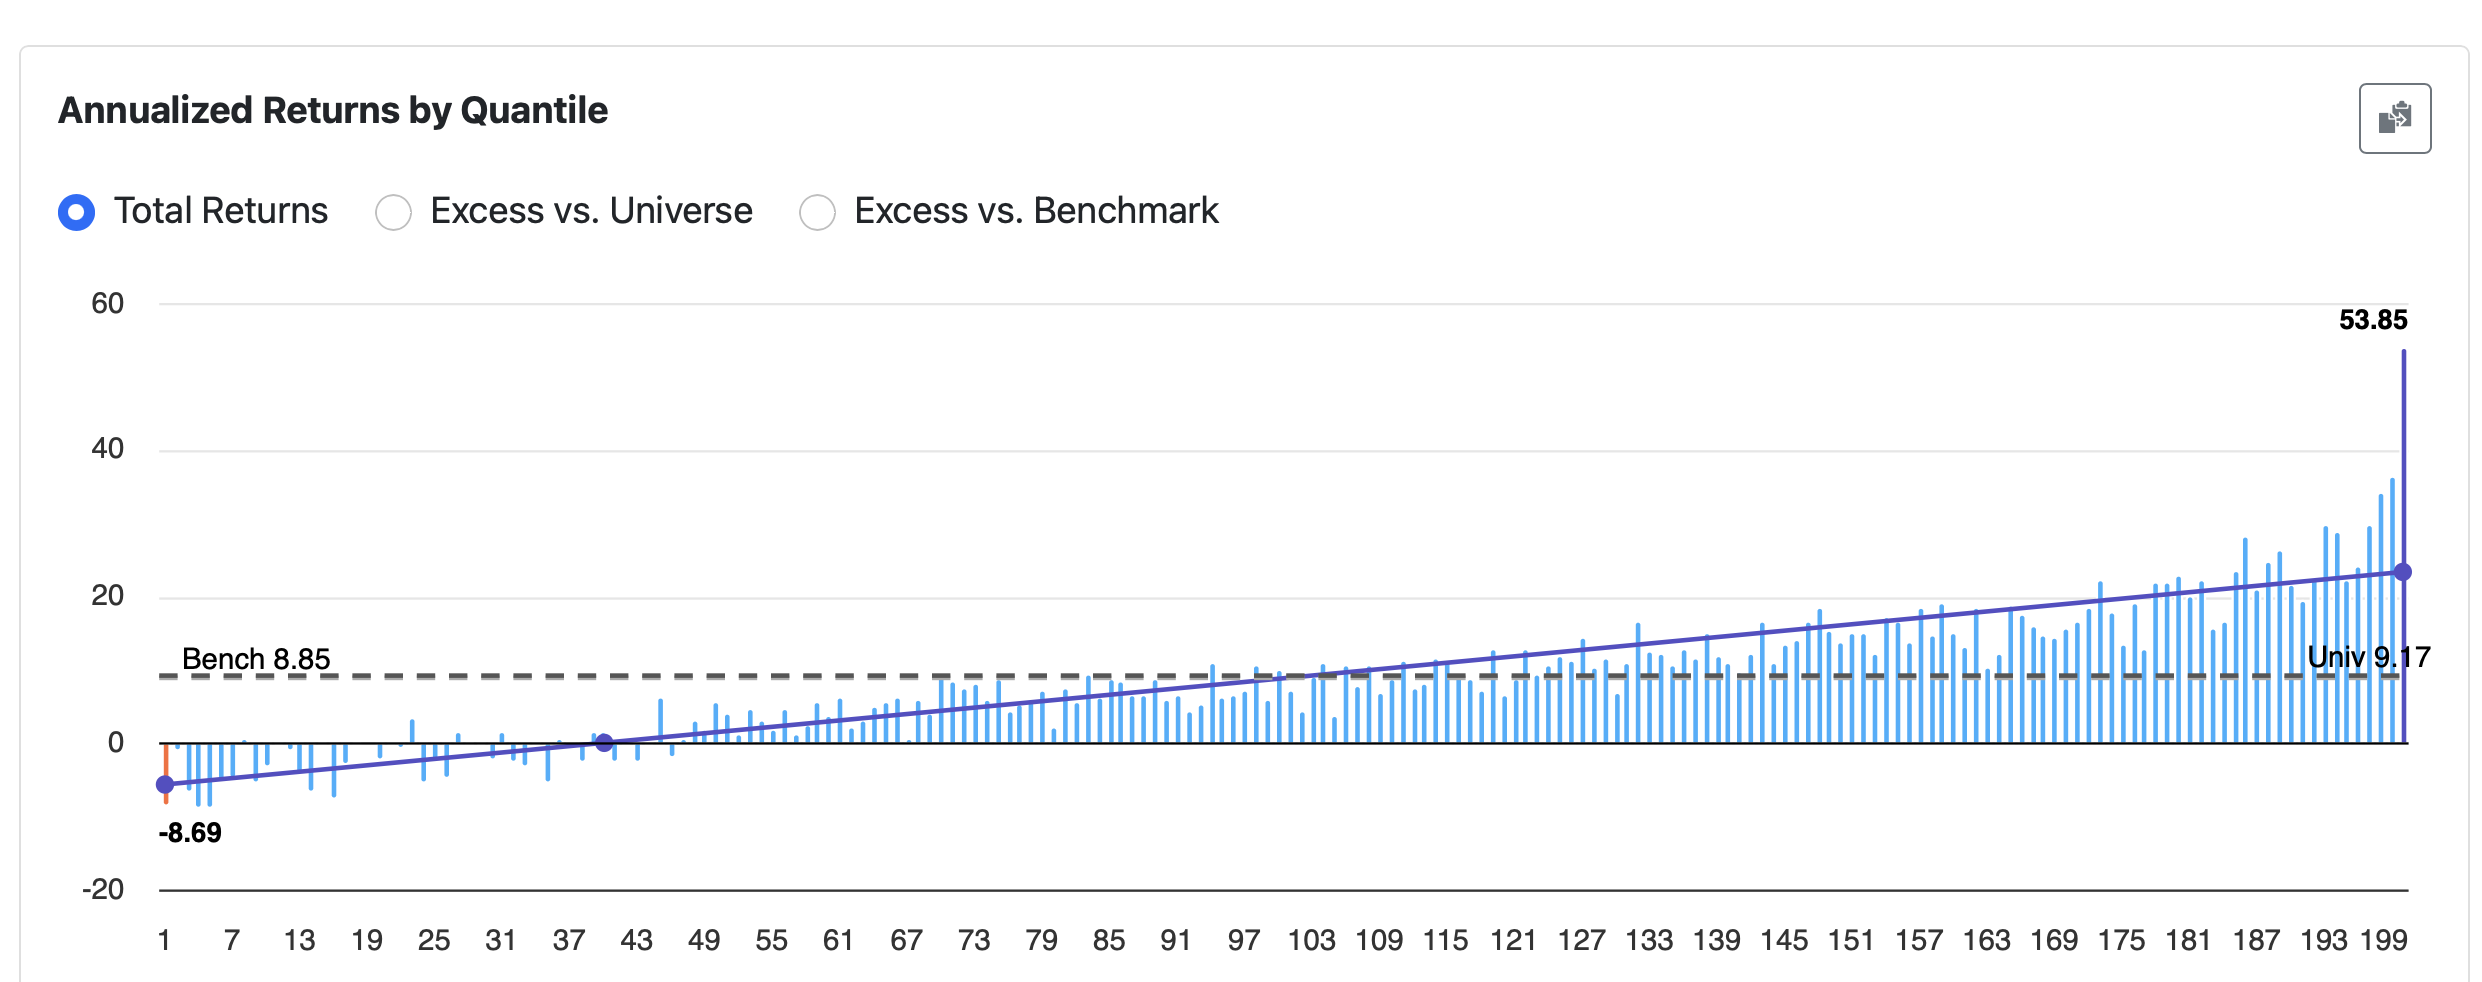
But I’m not so sure the stocks on the right — the ones we’re actually looking to buy — fit neatly into a linear model.
I’m also not sure that treating that rightmost bucket — which contains almost every stock I’m seriously considering — as an outlier is what I am looking for either.
Could we get back on track–respecting both assumptions–if we used inverse-variance weighted regressions?
I don’t think that is a minor question to be ignored. At least at home with our downloads.
Advanced — if P123’s AI consultant is considering looking into this:
The variance might get normalized out in P123 Classic Rank Weights— but only if we assume equal variance across all features. Still this normalization of rank weights may explain–in part–why P123 is such a successful model.
If the features have unequal variances, we might consider correcting for that somehow. It might be nice to have as an option for normalization in P123’s AI models.
There are probably additional complexities I haven’t considered while writing this, but I thought it was worth briefly revisiting the assumptions we’re making in some of our models.
A few of those assumptions — in practice — aren’t even remotely true.