I just wanted to point out some of my insights on the R2G models I see out there…
First, you should be skeptical of all claimed performance results, especially if the simulation starts at a time when the S&P 500 was trading near record lows. Usually the worst time to enter the market is right before it corrects downwards or while it is correcting downwards.
Second, you need to read the trading stats of the model. Here is an example:
Liquidity
(bottom 20%) $1,124,148
Min Stock Price (at purchase) $1.96
Max Profit Contribution Single Stock 9.60%
Trading Stats
Trading Costs / Curr Mkt Value 5.41%
Average Days Held 38
Annualized Turnover 893.38%
Average Return 7.26%
Average Return Winners 16.72%
Average Return Losers -9.28%
Winners 63.60%
This particular model’s simulation shows an annualized return of 75% with an alpha around 60%! Your first thoughts on seeing that performance are, how do I sign up?! But, take a closer look at the trading stats…
Max Profit Contribution Single Stock - 9.60%
This means that one stock returned almost 10% of all of the performance for the whole simulation! It was a lucky pick, and likely won’t be repeated.
Average Return Winners - 16.72%
This means that for all positions which closed out winning (in the money), they only averaged 16.72%. In other words, if you were to continue this model’s performance indefinitely, you would tend to get an average 16.72% return upon closing out all winning stock picks. Conversely, closing out losers would tend to net you the -9.28% return.
Winners - 63.6%
This is good for this simulation, but does it consistently post this high of winning percent? We need additional data from the designer to know this. If 63% of picks win and you get an average return of 16.72% per winning pick, your returns are going to be skewed more towards an average return around 7% overall, after accounting for the negative return stocks. (/begin_edit Edit: This is not quite right; see below. Basically, I forgot to account for the fact the higher turnover rate means you return 7% per stock trade more quickly than once per year. However, it also does not seem to factor in commissions at this time as it forced me to set my model’s commissions to 0 before I could launch it. See below for example of how that impacts returns. /end_edit) This is shown by the stat:
Average Return - 7.26%
This is important as it implies that the real performance of this model is actually around 7.3% return. Thus, this model is a bit misleading in terms of performance. This smacks of either accidental or intentional bias in the simulation.
Finally, look at the turnover rate:
Annualized Turnover - 893.38%
WOW! That means a TON of commission fees! Some of us pay $9 per trade and only start with $5,000 working capital. If I tried this model with those commissions and that working capital, it would probably quickly return -100%.
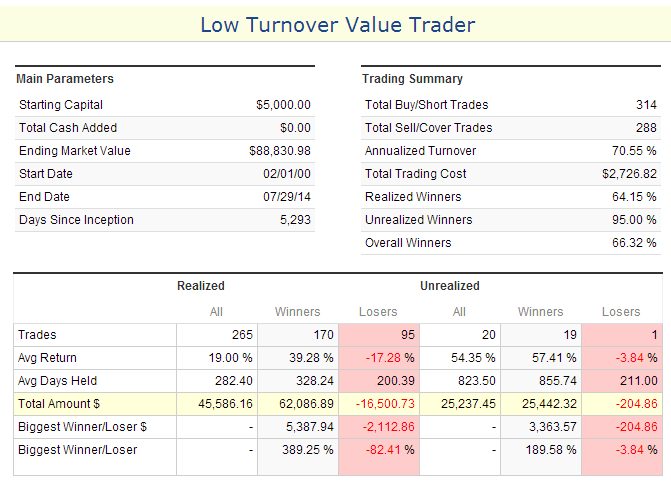
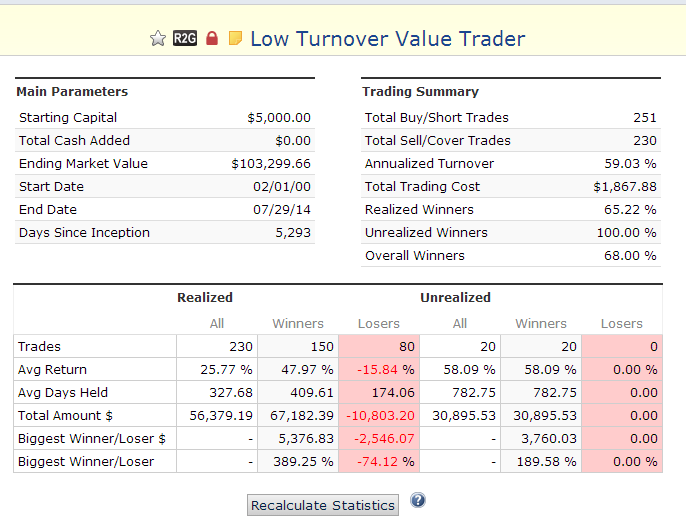
Compare this to my as-yet-unavailable R2G model (Low Turnover Value Trader - available 17 days from the time of this post) results which show an alpha around 17% (vs this one’s claimed 60%):
I have attached this image to the post, too, just in case it goes missing or won’t load for someone.
First thing you might notice is that Annualized Turnover is only 70.55%. That means it buys and holds stocks so there are very few commission fees involved.
Second, of the trades completed, 64.15% were winning trades.
Third, I tested this model across hundreds of start dates, including some of the absolute worst times to enter the market in the past 15 years. In almost every single case, it had higher than 60% winning trades, and in the few cases it had less, it was still over 50% and returned positive results which beat the index. Most of the time, winning trades exceeded 70%.
Fourth, you can see in the image that the average return on winning trades completed was a whopping 39.28% (yet my alpha is only around 17%). Further, the average loss on losing trades was only -17.28% with the average return for all winning and losing trades combined maintaining a whopping 19% over the 14.5 year run!
Next, you can see that of all stocks still in the portfolio, 95% of them are winning!
In fact, the winners currently in the portfolio have unrealized gains of $25,442 while the losers currently in the portfolio have unrealized losses of only $204.86! You would have to have a pretty bad trading day for that portfolio to turn into a loss.