I'm trying to create a simple EMA in an Agg Series. However, I'm having trouble with one of the most basic aspects of the formula.
My formula for a simple EMA(65) Agg Series is this:
UnivAvg("TRUE","EMA(65,0)")
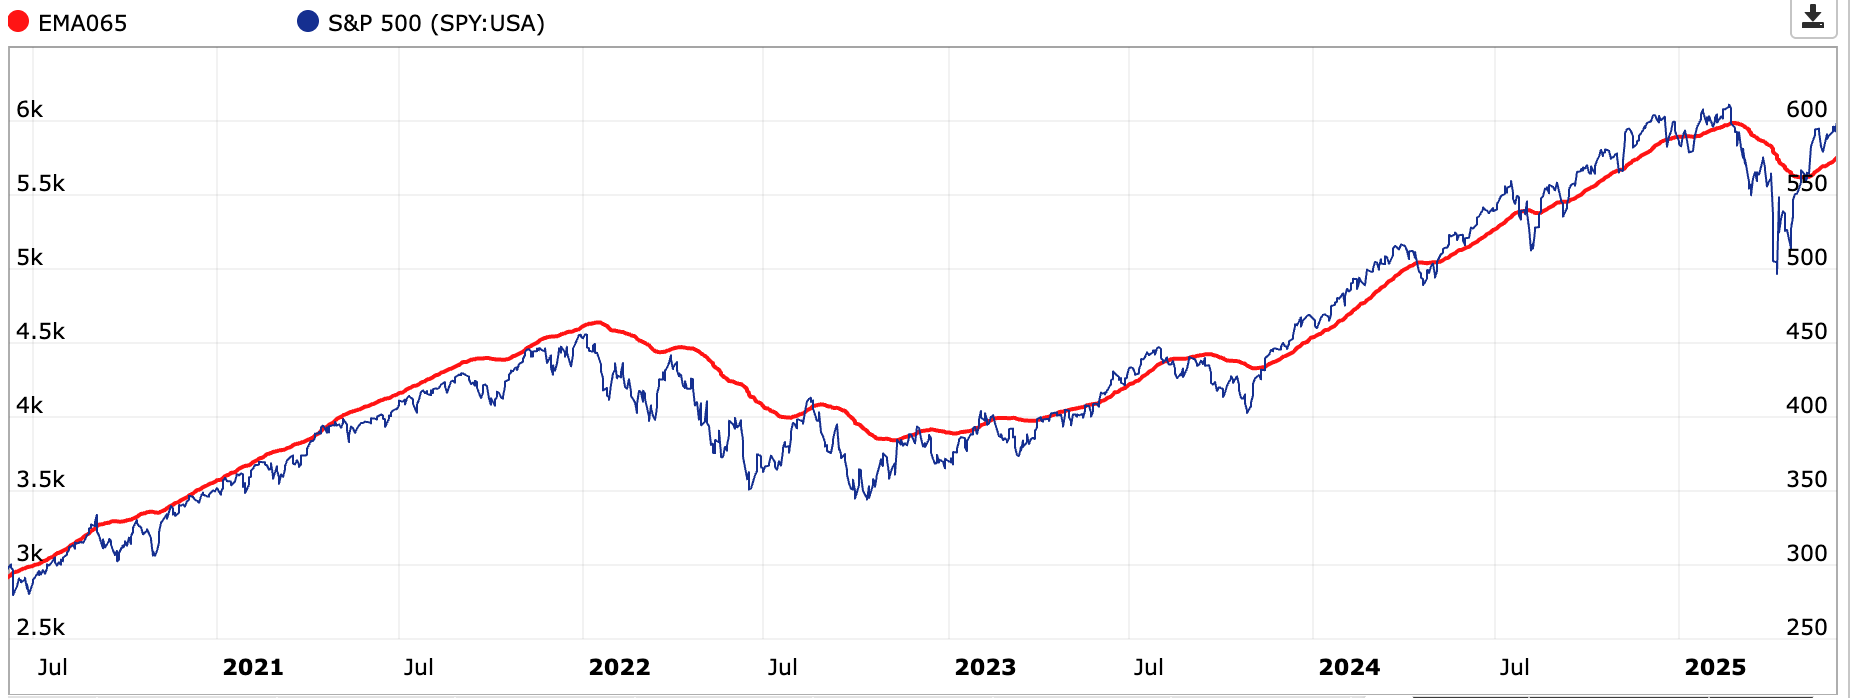
Making this chart:
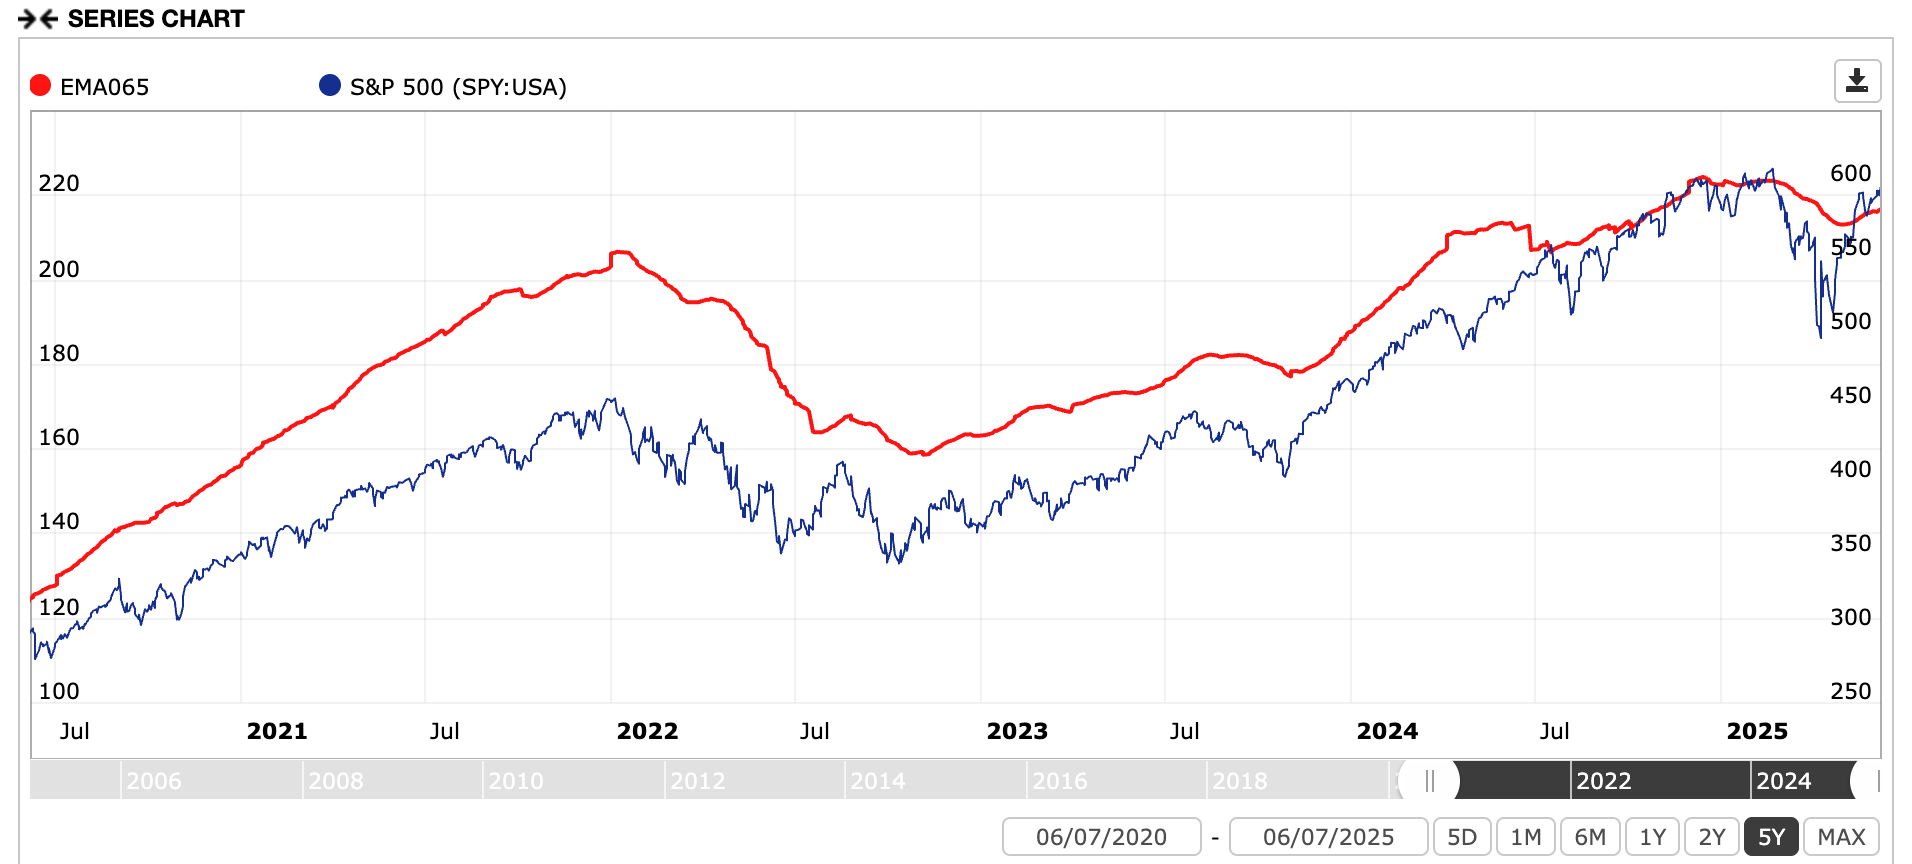
It should appear like this:
What am I doing wrong?
Many thanks,
Chawasri
I think you're calculating the average EMA(65) of all stocks in the chosen universe, S&P500(?), rather than the EMA(65) of SPY, which appears to be your goal. Try:
Set universe to S&P500 and benchmark to SPY.
Rules:
UnivSubset("IBM")
UnivAvg("True","EMA(65,0,$SP500)")
The chart it!
I made a public Aggregate series SP500EMA65 with the above settings.
Thank you, Mr. Gallow, but it appears that doesn't work either.
I already had the Universe set to "S&P500 Largecap (IVV)" and the Benchmark set to "S&P 500 (SPY:USA)."
I'm curious why you suggested I use "UnivSubset("IBM")" as a rule?
Nevertheless, when I added "$SP500" to the end of the primary rule as the designated series, it lowered the EMA(65) line slightly, but it is still incorrect, as it presents too high on the chart.
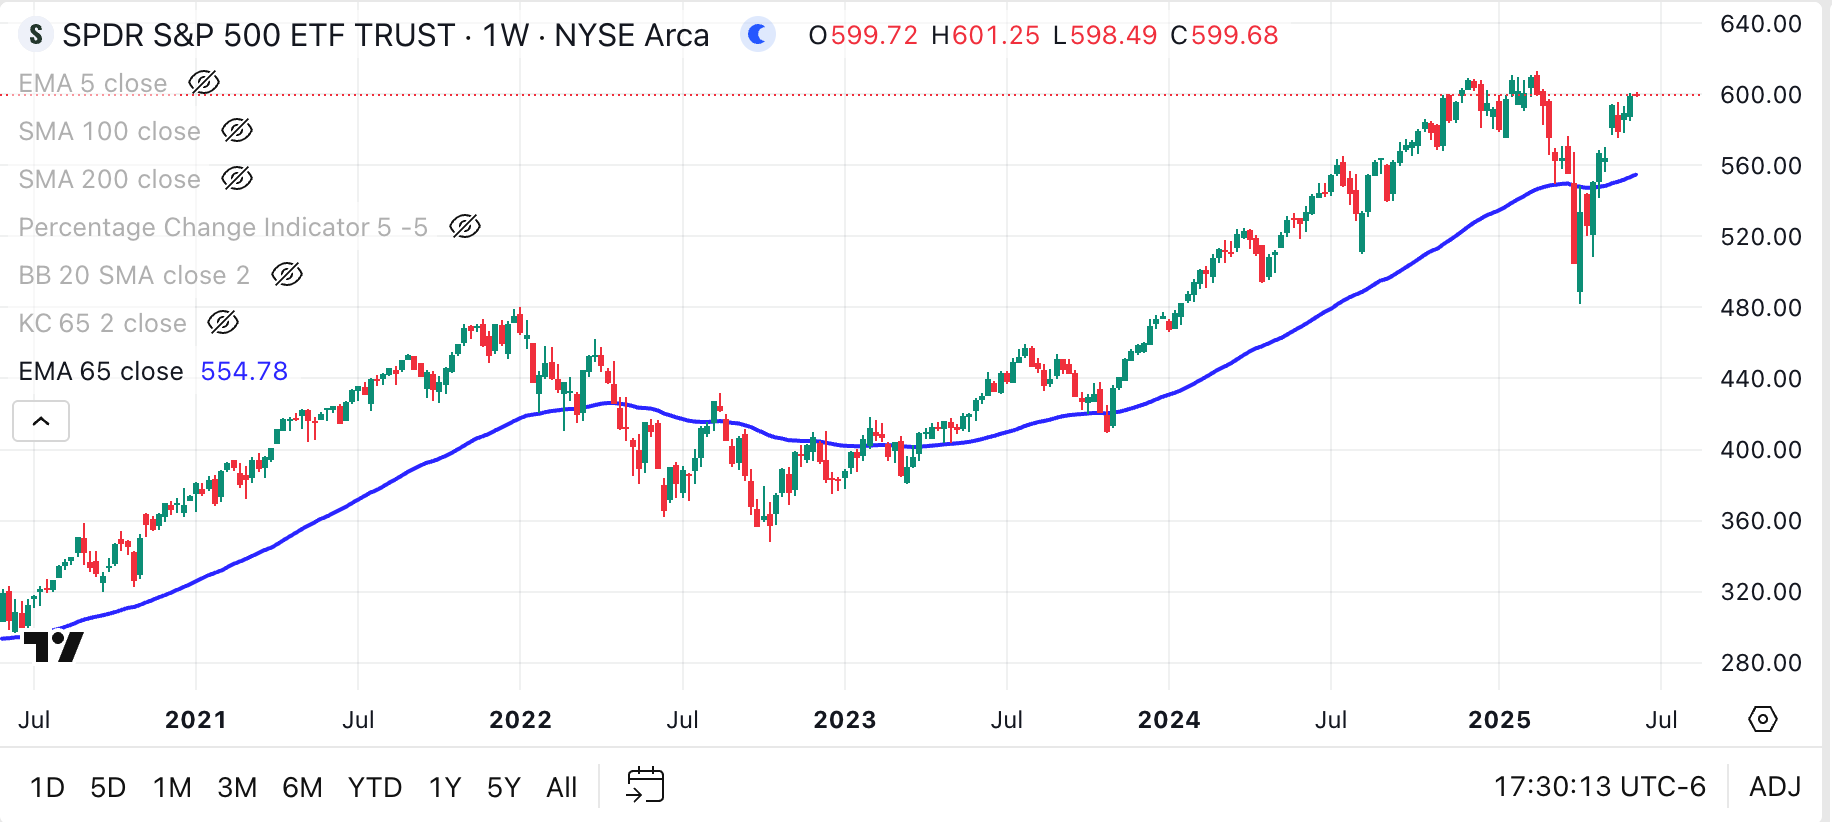
Readers can compare the above chart to the TradingView chart shown in my original post, or use any charting platform to see the correct location of EMA(65) on a five-year chart of SPY.
Chawasri
Chawasri,
SP500EMA65 is the right way to do this. Aggregate Series is plotting unadjusted numbers for UnivAvg("True","EMA(65,0,$SP500)") and SPY:USA is adjusted.
You can try;
UnivAvg("True","Close(0,$SP500)>EMA(65,0,$SP500)")
Also, UnivSubset("IBM") is used since AS is a cross-sectional tool, and there's no reason to iterate over all universe constituents when calculating something what won't change over the iterations. Once and done is good. IBM was just an arbitrary choice but a good one since it's been around forever.
Walter
I appreciate your response, but that formula DOES NOT produce EMA(65) correctly on the S&P 500 in a way so that it can be used in a systematic trading model. You can confirm this by looking at any charting platform (TradingView, StockCharts, etc.) and setting an EMA(65) line on the S&P 500. You can easily compare the erroneous P123 output to the correct output on any charting site.
Is it not possible to generate accurate moving average lines on the Portfolio123 platform? Why would this be? Is there a difference in how the data is compiled on P123, or perhaps the background script for creating Exponential Moving Averages in P123 is flawed? I would think this is a significant bug that needs to be addressed as soon as possible.
Please let me know if there's anything I can do to assist.
Chawasri
Edit: I note that you said, "Aggregate Series is plotting unadjusted numbers... and SPY:USA is adjusted."
This must be the issue. I need the EMA and the benchmark to match, either adjusted or unadjusted for dividends. Is there a workaround to accomplish this? As it stands now, moving averages (and their derivatives like the Keltner Channel) cannot be used for Entry/Exit signals.
Hi Chawasri,
UnivAvg("True","Close(0,$SP500)>EMA(65,0,$SP500)") uses unadjusted data for both terms. The background chart shouldn't be used as a reference in this case.
The underlying issue is that Aggregate Series is designed as a cross-sectional analysis tool but is currently being applied in ways for which it wasn't designed. However, many users are doing it.
Best,
Walter
One thought, which doesn't change the outcome except to align the chart's relative y axis values between the plotted value and the benchmark. #Bench can be used in place of $SP500 if the benchmark is SPY. For some reason that I can only speculate about, using $SP500 results in a value about ten times #Bench.
Walter,
Thank you for the explanation. I can see that the binary signals are mostly accurate when using the crossover formula you provided.
I'll keep experimenting with it. Thank you.
Chawasri
Hi Mr. Gallow,
I think I like that even better. Thank you for the tip!
Chawasri