I wanted to post some results from using Bayesian optimization for ranking system weights. So far my conclusion is that I am missing something major, or optimizing ranking system weights has no consistent benefit for future performance of a system compared to say an equal weighted system.
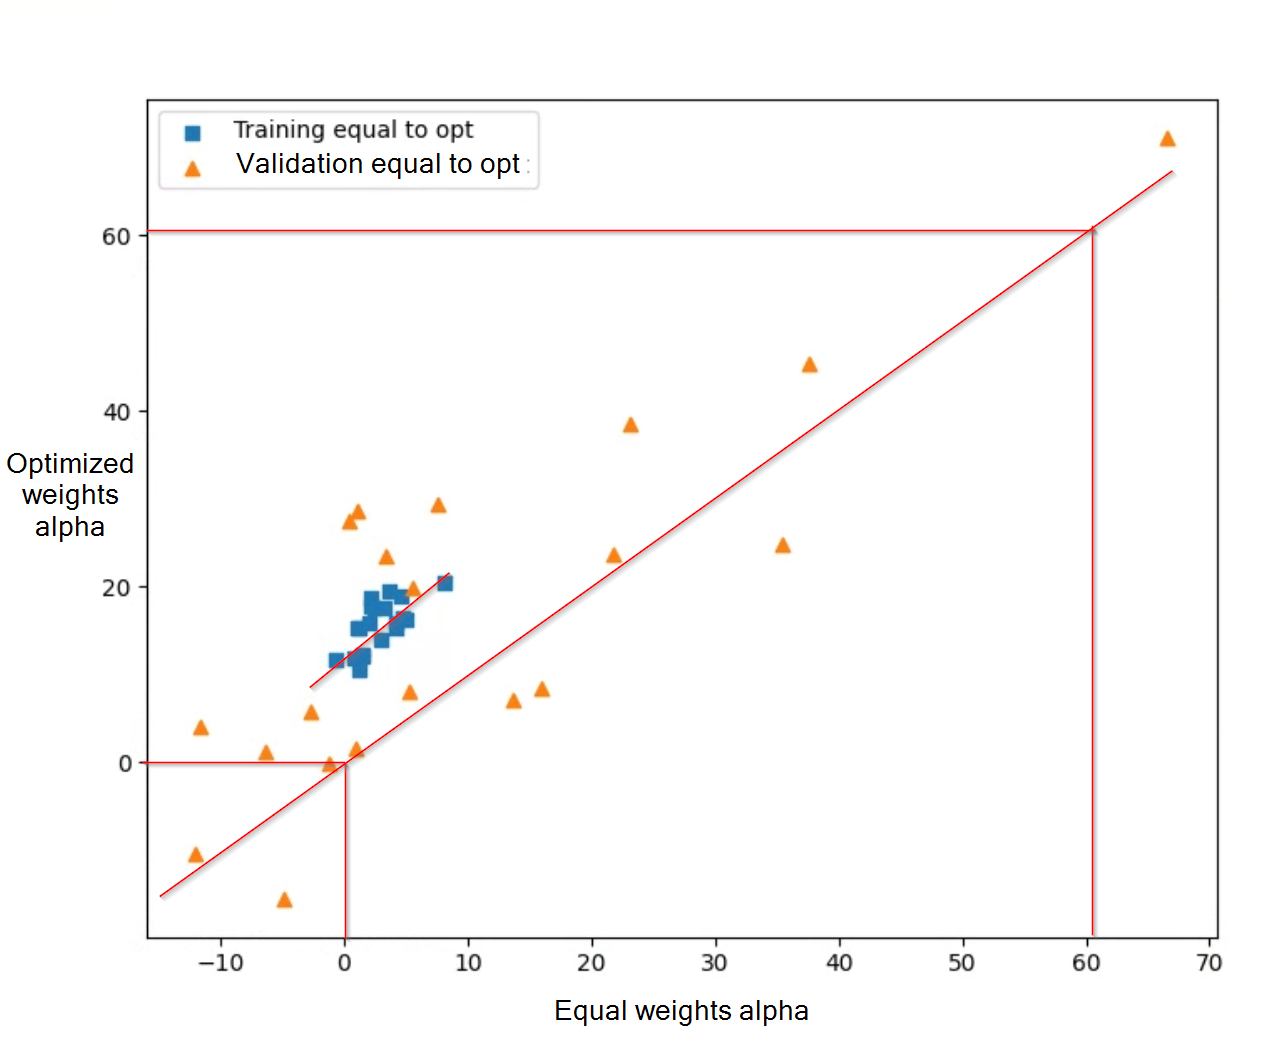
Here is a plot of Bayesian optimized median rolling alpha vs equal weighted median rolling alpha for both the training and validation set for a flattened Small and Micro Focus ranking system on 100 stocks. I apologize for the difference in the groupings as training is a 10 year period and validation is a 1 year period, so you get more spread on the 1 year period. However, you can see that the training equal weights vs optimized weights has around an 8% increase in alpha while the validation set has essentially no improvement in alpha (the median improvement is -2% in fact…)
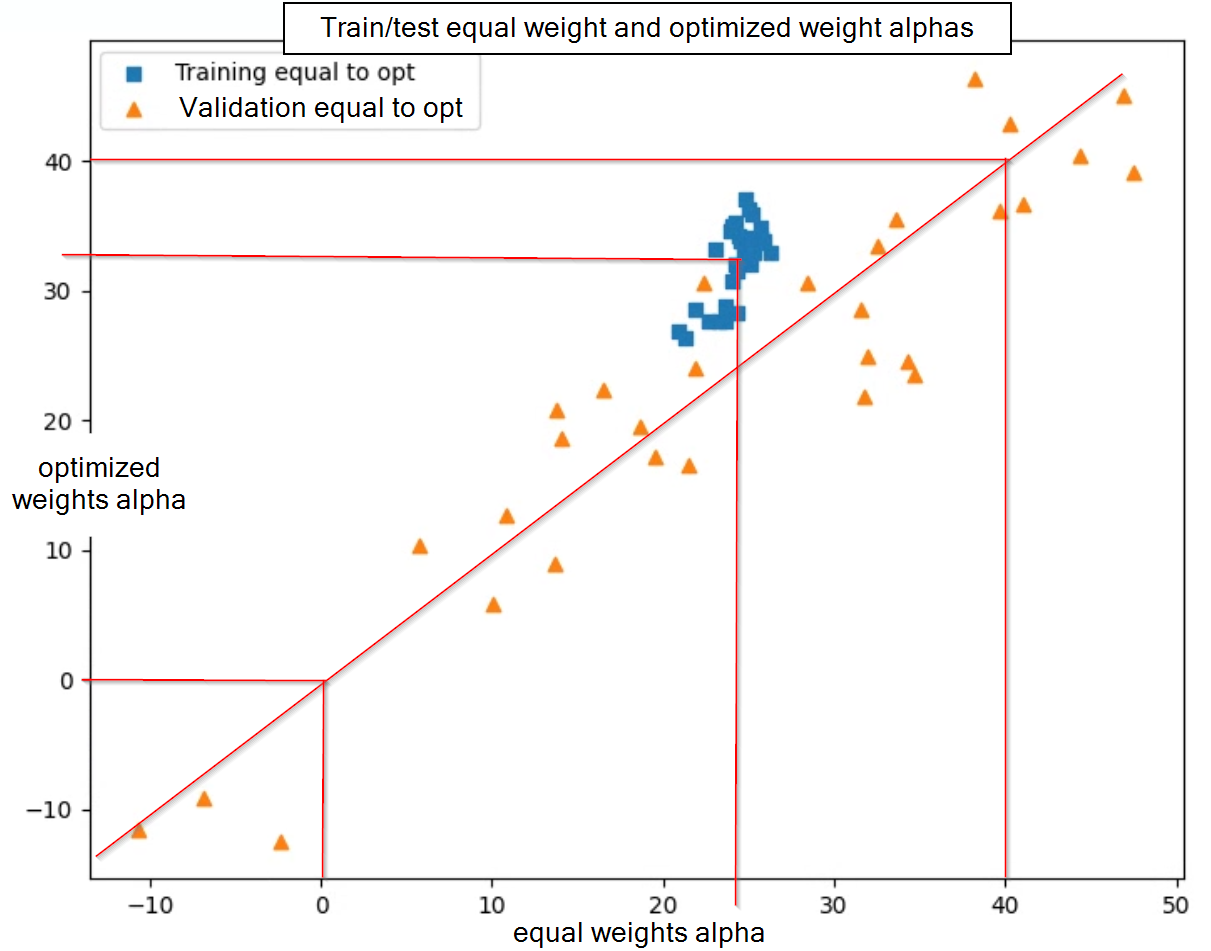
While this result does not make me think there is no point in optimizing it just makes me think it is not worthwhile for this ranking system. Also I am starting to get into no-longer having a true test set due to the number of variations I ran, so further testing is starting to become meaningless for this ranking system at least.
Here is some more info for those curious:
Universe:
- FRank(“MktCap”) < 75 and FRank(“MktCap”) > 2
- !IsMLP & !IsOTC & !IsUnlisted & !GICS(FINANC)
- price, volume, and spread limits, but fairly normal
The performance results are from something like a screen, except:
- Run on 1 year validation data sets (30 total train/validate sets with overlap…)
- Variable slippage calc using the close price spread and last weeks volume with a $10k position and 100 stocks
- alpha is relative to the actual universe instead of a benchmark
- alpha is calculated as the median of a rolling 12 week return and then annualized
The Bayesian optimization is:
- For each training period optimization is run 3 times on a 10 year training data set and the weights are averaged. I tried without averaging, but the result is similar, just with more variation.
- Each optimization has 100 random runs and 10 optimization runs. I limit the optimization runs they significantly increase the run time, and I ran the optimization 90 times to get the above plot. So for the sake of time I wanted to limit things… Also when I have tried other random and optimization runs I get similar training and validation performance results.
Note that I have tried longer and shorter training periods, shorter validation periods, varied numbers of optimization runs, and beta instead of alpha as the optimization target among a few others. So far I was able to improve validation test results, but not test results (note I have train data, then validation data, then test data).
I am currently running the same process on a ranking system similar to the core combination, but I expect similar results.