Best Performing Models on Numerai

These are the best performing models on Numerai. (already shown this to Jim, the AI expert here)

All the performance are out of sample and the models are staked NMR by the users. The top 10 all have over 500% return during the past 1 year. (The best model has over 1000% return in the past year.)

I think it proves that good AI without the overfitting actually works.

Maybe we can have similar performance with the best designer models here in P123 after the AI rollout.

Regards
James


Meaningless without knowing max DD, how long the model has been running, number of positions, etc. High returns over a year mean nothing and random picks will show the same pattern with a large sample of models.

Charles,

Although it would be nice if Numerai published more info, perhaps you can try coming up with 10 models with those returns with whatever drawdown level and any number of positions within 1 year period.

Regards
James

I try to make my models robust, so I cannot come up with any even remotely close to those returns. My point is the model graveyard is littered with models that showed impressive returns out of sample initially and then crashed completely. Check out Collective 2 and look at some of the longest running models there. Nowhere close to those returns. Just my opinion of course.

Charles,

I don’t think you can compare Numerai (built by thousands of data scientist) with a website like Collective2 (I just went to check it out).

Perhaps you should check out Numerai before making further judgement about their performances.

Here it the link.

https://numer.ai/

Regards
James

All,

I don’t have any specific opinions on the numerai models. If I tried to develop an opinion I would want to know a few things like turnover, and how slippage is calculated at a minimum. Probably I would have some prior beliefs or biases based on whether the model was a fundamental or technical model but maybe I can keep my prior beliefs about this to myself here.

I think the multiple comparison problem and the Bonferroni correction is pertinent no matter how one looks at this.

Normally p < 0.05 might be considered significant. But a simple (conservative way) to determine the level of significance with multiple models is to just divide 0.05 by the number of models. This is the Bonferroni correction. There are 11,895 models listed on the numerai leaderboard.

So for a model on the numerai leaderboard to be considered significant the level of significance should be: p < 0.0000042.

I would probably have an opinion if I knew whether the ALPHAPRISM_3 model had a large-enough sample to have this level of significance (with slippage considered). Maybe it does.

One way around having to use the Bonferroni correction would be to just look at the single final result of investing in the numerai fund (one model not needing correction using Bonferonni or any correction for that matter). But I don’t think we have the data to do that either. And the fund is closed, I think. So it would be an academic exercise if it were even possible.

More generally, the Bonferroni correction makes it difficult to look at a single model–and especially a sim–and find any level of significance. This applies to the Designer Models also.

I assume Charles would be consistent and agree that this applies to the Designer Models–especially considering the survivorship bias of Designer Models.

If P123 wants to get serious about machine learning–in which they have invested some time and money–P123 should probably take some of what Charles is getting at seriously. Use his ideas not just for numerai but all of the data we see. This would help P123 to not (possibly) just have some resemblance to machine learning that gets members to adopt false positives that do not payoff when real money is invested.

Edit: James pointed out in an email that it is still possible to invest in this fund.

Best,

Jim

Numerai models works differently from traditional models. There are no turnover, number of positions and things like that.

The model performance is calculated based on the correlation between the signal provided by the model (value) and the target (after neutralization).
The higher the correlation the better the performance.
To simplify, if for this week the correlation is 0.05 and the model is 2x leveraged then the model will earn 0.05*2=0.1 or 10%
If the user has stacked 10 nmr (the numerai token) then he will earn 1 nmr on that round.
If the correlation is negative then his tokens are burned.

This is the reason you see very high and very low annual performances.

You’ve shown us that the top 10 out of 1,389 models that have one years’ worth of OOS returns performed brilliantly.

A more meaningful result is that the median out of those 1,389 models returned 136.5%.

How many models are not on the leaderboard because they’re not “staked” or were pulled after poor OOS performance? Do these 1,389 models constitute the whole of all the models created or only those that met certain performance criteria?

Yuval,

Edit: I get that you are looking only at models with one years of returns. I have the same questions you do an will not repeat them.

Best,

Jim

Yuval,

Good questions, we will have to ask Numerai if you want the answers.

But if I understand correctly, all the Numerai models need to be staked by NMR in order to be included in the meta hedge fund and the median return is only 136.5% in the latest year (which is 5 times higher than S&P 500 and a lot better than the existing P123 designer models).

As I have pointed out, I look forward to the P123 AI rollout to see whether the performance of the new designer models becomes better.

Regards
James

This is obviously interesting and pertinent. So probably, none of the above discussion is related to how Numerai might do.

I do not know what Numerai is doing as far as machine learning. But I would love to use this data in a factor analysis, myself.

Would it work? Look at the fund data to find out, I guess. I am still probably missing the big picture on this but thank you Azouz for pointing out the above (quote).

Hi Jim,

What they do is combine all signals (weighted by the amount of NMR stacked) and then create a metamodel that is neutral (long/short).
Here is the numerai fund performance:
https://numerai.fund/

22.09% for the past two years.
Don’t forget that it is a neutral hedge fund

Azouz, Thank you. Good stuff all around. -Jim

I would look forward to showing me their IB account performance over 10 years it does not exist. Even I blind squirrel finds a nut once in a while. That would hold true for designer models also. How many models OS beat QQQ over the last 10 Years? How many will going forward? I’m going to say less than 80% and the stats show 90% so far. But you might have a better sharpe ratio over the last 10 years and that is a personal trading preference. Don’t be fooled by crazy returns until you trade small amounts OS for at least 2 years.

Bottom line it’s a hard game slow and easy wins it.

Cheers,
MV

All,

Azouz’s post is important for anyone really interested in this. The returns are in NMR for, I think, placing a stake or betting on their strategy. It has absolutely nothing to do with whether these are good, stand-alone strategies. Nada, zilch. Maybe they are maybe they are not. Maybe some of both. No way to know. No reason to care.

Without a doubt, the only motivation of the programmers is to get NMRs and they make no other claims. Not entirely different from mining Bitcoin not having anything to do with actual mining (and no one claiming it does).

The details are not too important other than to understand that it is a type of crowdsourcing. In some ways, perhaps, like the predictions markets some of us are familiar with for presidential campaigns. But ultimately, the details are uninteresting other than they are getting a bunch of people to contribute and the contributors are motivated to do it right. They are not filling out a survey that they are not getting paid for. The best way to combine the data once you get it is interesting, IMHO.

Things kind of interesting after looking at Azouz’s link from above:

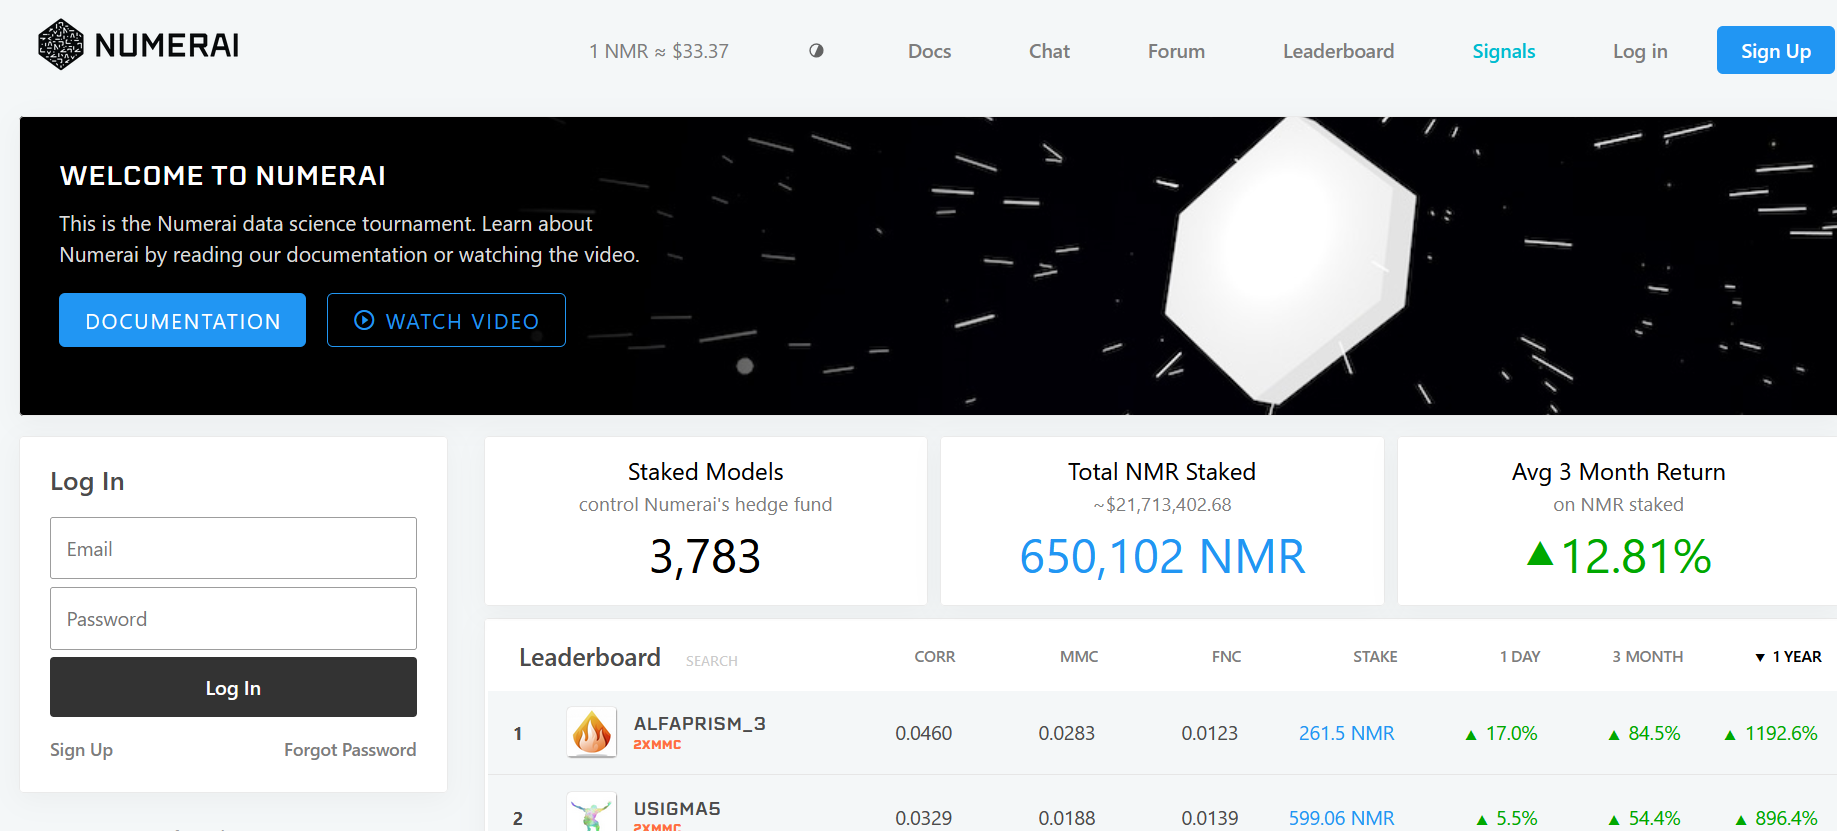
  1. Their data is encrypted so one does not know what the factors are. But the video in the link Azouz provides says “news” can be one of the factors.

  2. It is common to look at the predictions for an industry or sector and weigh those predictions for each industry. One can find a clear example of this over at Fidelity where this is done with the “Equity Summary Score.” I am pretty sure some P123 members do this so I am not claiming to have some wonderful new insight. But the link seems to suggest that Numerai also does this.

  3. Azouz mentions “Stacking.” Which is universal in machine learning. Arguably we do this when we combine nodes in a ranking system.

P123 could probably breathe new life into the Designer Models if they employed Azouz or otherwise develop a method for “Stacking” successful Designer models–with Designers opting in or out based on an incentive. Maybe even looking at what Numerai has done as an incentive.

This would probably instill a sense of cooperation in the members. Wanting others to do well because other member’s strategies could ultimately help them if they invest in the stacked strategy. Members would also be motivated to recruit new members that they thought had a talent. A successful model would be a strong incentive for joining P123.

Of course, we already have an AI specialist if Azouz cannot be recruited for the project. But if P123 is serious about machine learning it should not be a question of whether to do this but rather where to put it on the priority lists. A simple version would be…well, simple. Weighing the industries would a little hard. But it would take more than a little space to list all of the programmers I have encountered on this forum whom I think are quite capable of this.

Fidelity has been doing something like this since 2009 with positive out-of-sample results to report. Rivaling the median result of almost any Designer’s results (with or without survivorship bias). Perhaps with no rival at P123 over the same period.

To be clear there are some very bad models at Fidelity (most are bad on their own in fact), but they get weighted using a type of ML or stacking if you will (i.e, the Equity Summary Score). But even some of the bad models seem to work in some industries. And when they are all stacked together it just works out-of-sample.

More simply: Overfitted sim results (or bad port results for any reason) get taken out of the (stacking) equation. And P123 has far more strategies to stack than Fidelity does.

Best,

Jim